


Technical Analysis
Most Important Candle Patterns Every Trader Should Know
Unlock the power of candle patterns to decode market psychology and improve your trading precision....

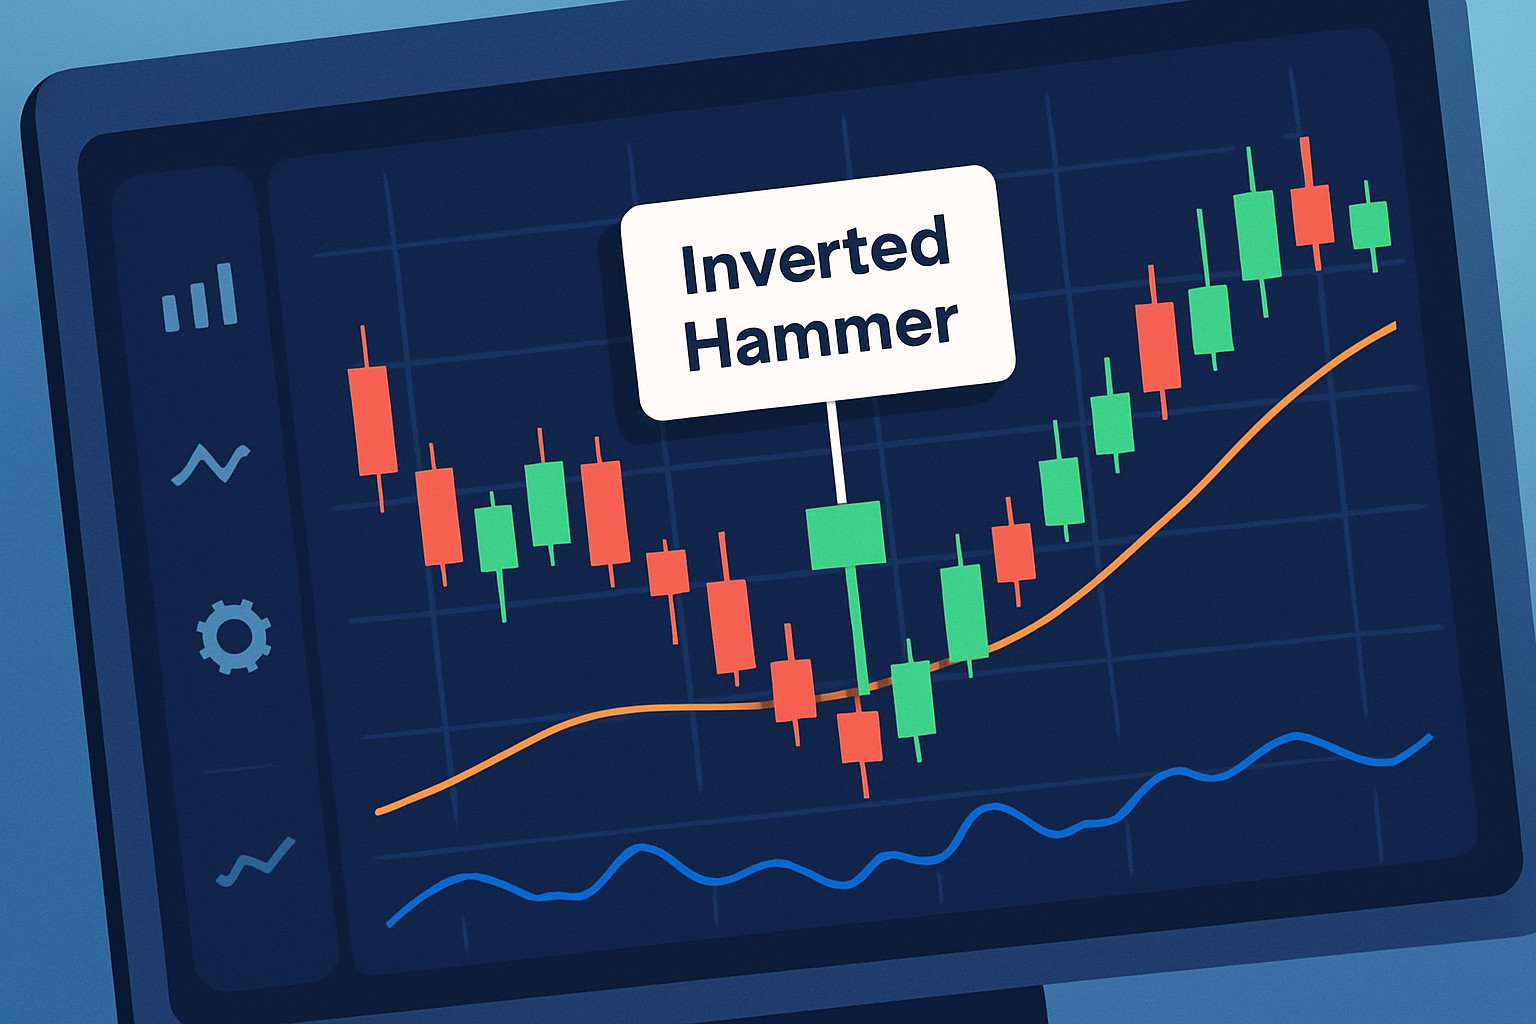
The hammer inverted candlestick pattern tends to grab the attention of traders hunting for clues about potential trend reversals. Nailing this pattern early can offer some handy hints about shifts in market momentum, giving traders a chance to jump on buy or sell opportunities just when it matters most.
Candlestick patterns capture price action in a way that helps traders get a feel for market sentiment and anticipate where prices might head next. These patterns trace their roots back to Japanese trading techniques and use open, high, low and close prices to paint shapes that reveal the subtle psychology of traders at play. In technical analysis, they highlight potential market reversals, continuations or moments of indecision. This offers traders helpful signals to act upon. Take the inverted hammer pattern for example. By studying formations like this, traders can get a leg up on anticipating market shifts and sharpen their timing on entry and exit points.
The hammer inverted pattern is a single candlestick with a long upper wick, barely any lower wick and a small real body near the candle's low. The hammer inverted suggests possible reversals and often requires more confirmation before you bet on it.
The hammer inverted pattern reveals that buyers really tried to push the price higher during the session, only to hit a wall that kept the close from reaching those highs. This little tug-of-war hints at a possible pause or even a reversal, especially if it shows up after a downtrend and selling pressure starts creeping in.
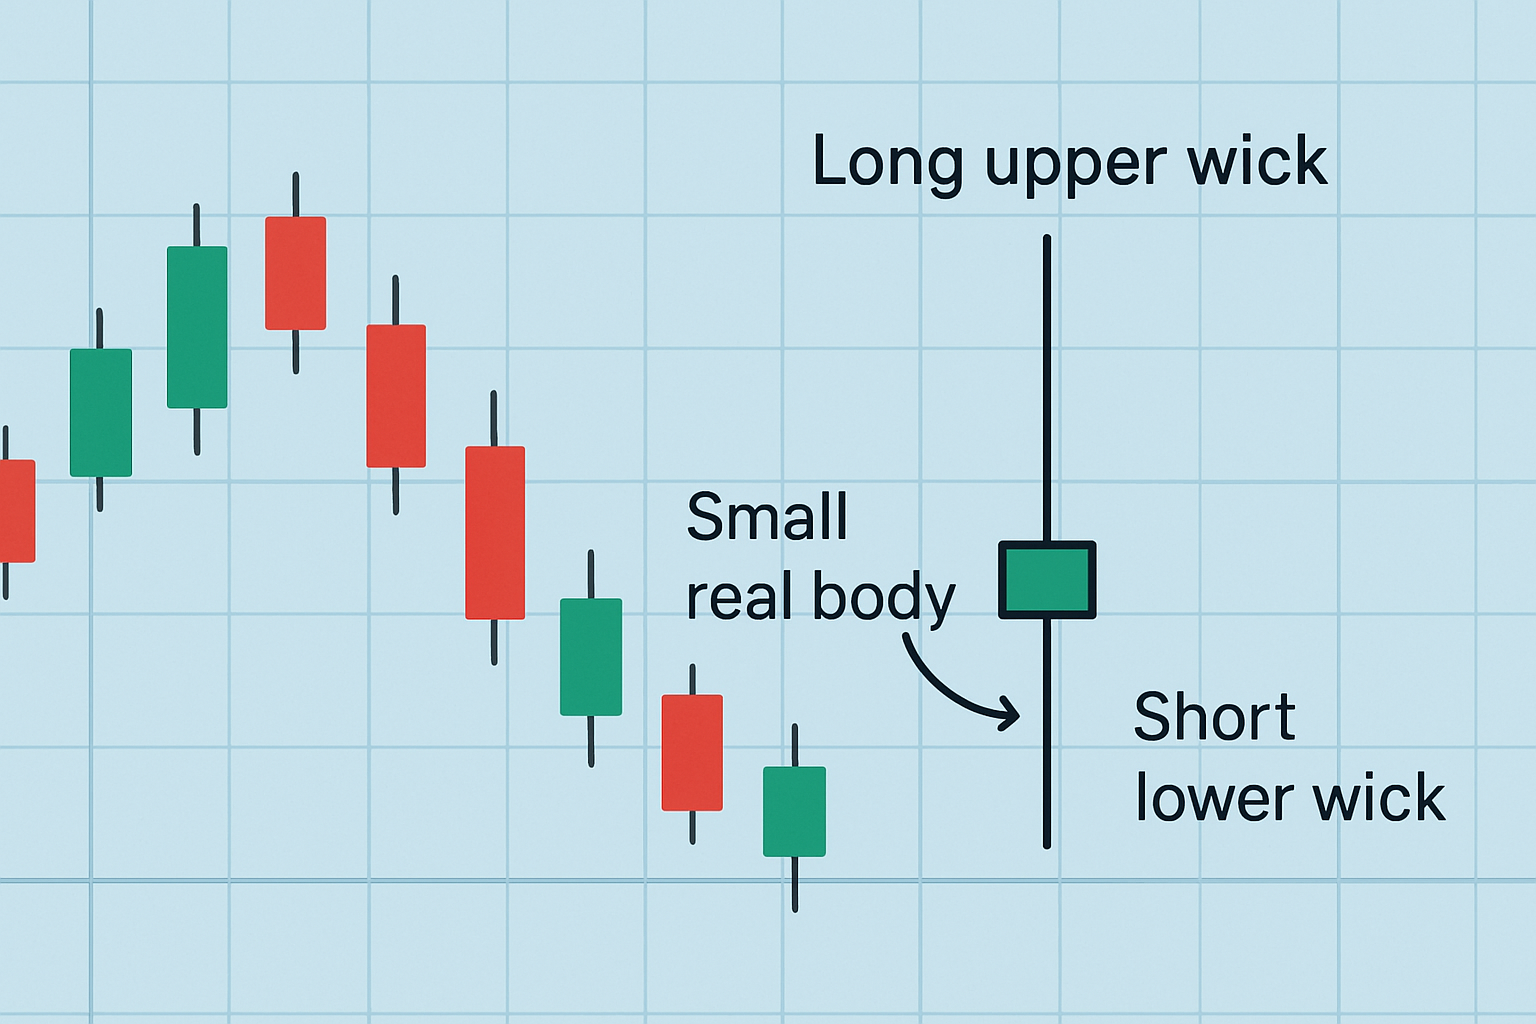
Illustration of the hammer inverted candlestick pattern with key elements labeled
Pick the right chart timeframe such as daily or weekly because candlestick patterns tend to have more significance then.
Carefully examine the chart for candlesticks with a long upper wick at least twice the length of the real body.
Ensure the real body is small and positioned near the bottom of the candle's price range as if it is trying to stay low.
Double-check that the lower wick is very short or completely absent to capture the classic inverted hammer shape.
Look at the bigger picture by observing the trend before the pattern. These patterns usually indicate a stronger reversal after a downtrend.
Use trading platforms with pattern recognition features like TradingView or TrendSpider because they can help you spot inverted hammer patterns easily.
Daily and weekly timeframes usually steal the show when it comes to spotting hammer inverted patterns since they cut through the usual short-term market noise and deliver much clearer signals. You can peek at intraday charts too.
A common hiccup when trying to spot hammer inverted patterns is getting them mixed up with shooting star candlesticks—those tricky lookalikes that tell very different tales. Traders often overlook the bigger picture and forget to double-check the pattern's validity with volume or other indicators.
Context really steals the spotlight when it comes to interpreting hammer inverted patterns. This little pattern packs the most punch after a clear downtrend and hints at a possible bullish reversal that traders love to spot. Without that setup its crystal ball gets foggy and its power to predict outcomes usually takes a backseat.
Using the hammer inverted pattern alongside these technical indicators usually makes trade setups feel more reliable. For example, catching a hammer inverted with high volume and an RSI dipping under 30 plus a bullish MACD crossover often lights up a strong buy signal. Platforms like TradingView come packed with advanced charting tools and many indicators.
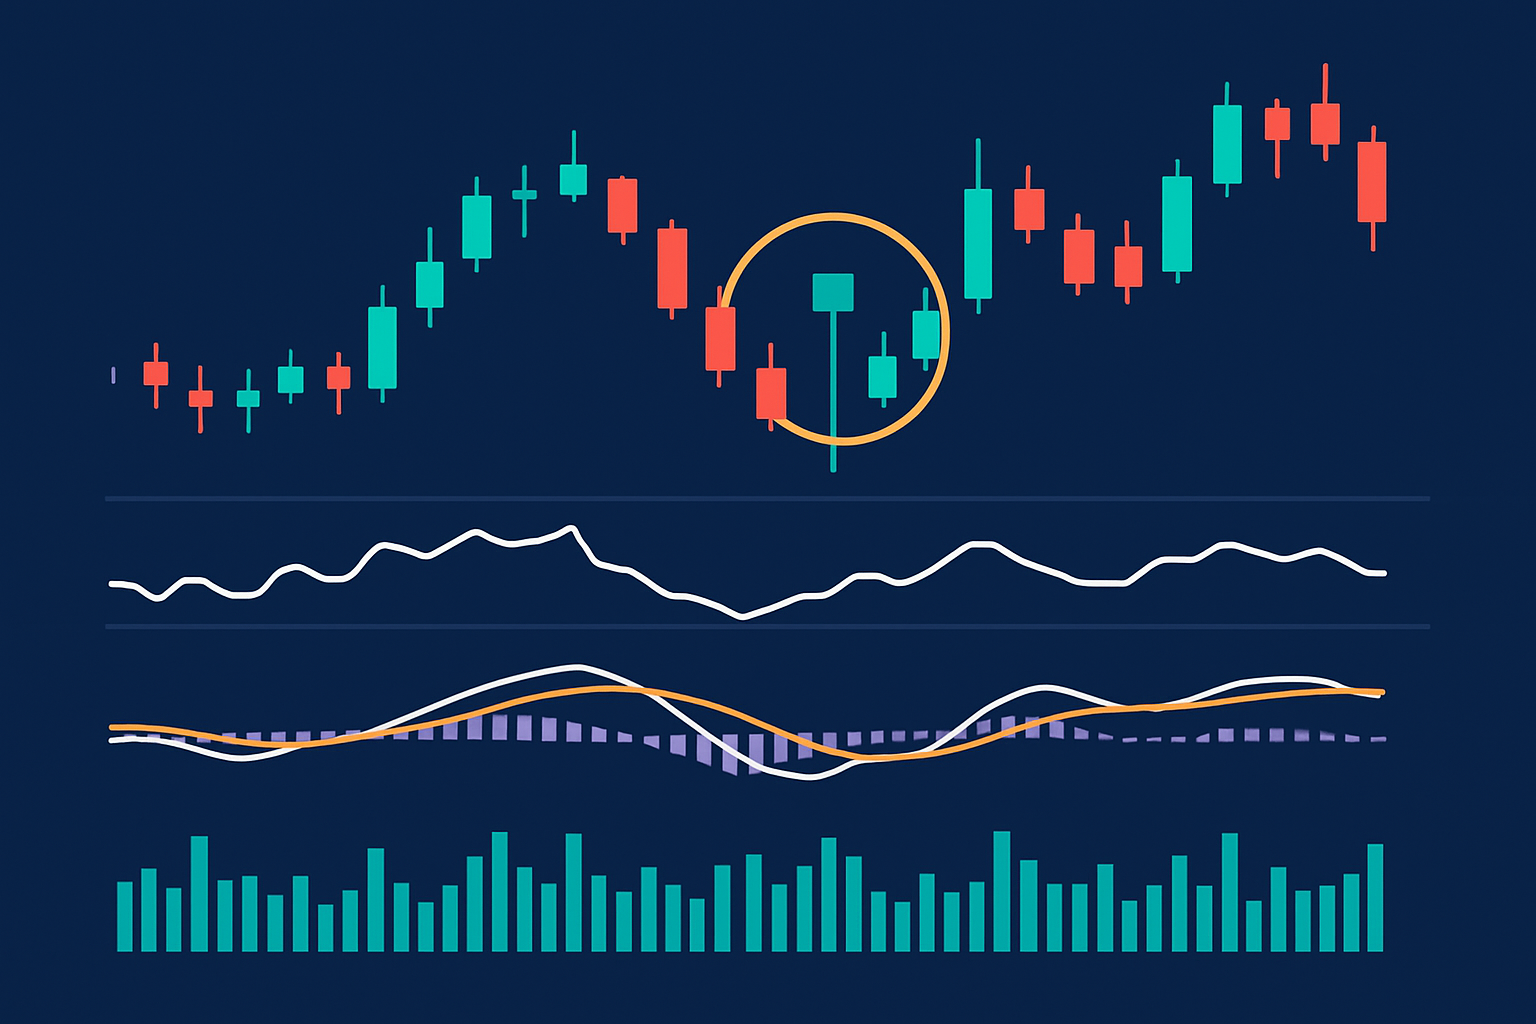
Example of hammer inverted candlestick pattern confirmed by RSI, MACD, and volume indicators
Trade effectively with the inverted hammer pattern by first spotting the pattern clearly—no squinting or guessing here. Next, lean on your trusted indicators to back it up before you dive in with your entry, stop-loss and target profit levels.
Make sure that trusty hammer inverted pattern has actually taken shape based on the criteria we went over. No guessing games here.
Keep an eye on the current trend and focus on pattern signals that pop up after a downtrend because that’s where the magic usually happens.
Double-check technical indicators like RSI or volume to back up the pattern’s reliability. Think of these as your safety net.
When you’re ready to jump in, plan your entry point just above the candlestick’s high so you’re not jumping the gun.
Always have a stop-loss set just below the pattern’s low to keep things in check if the trade throws a curveball.
Aim for realistic profit targets by eyeballing nearby resistance levels or sticking to a risk-reward ratio of at least 2 to 1 because nobody likes chasing rainbows.
Risk management is absolutely key. I’ve found it’s usually wiser to hold your horses and wait for confirmation from the next candle before jumping into a trade based on an inverted hammer pattern. This little bit of patience really helps weed out those pesky false signals and bumps up your odds of coming out on top.
To really up your game with the hammer inverted pattern, it’s a smart move to pair spotting the pattern with some good old-fashioned trend analysis and a few trusty technical indicators. I’ve found that practicing by hunting down the pattern across different charts and timeframes makes a world of difference. Tools like TradingView's advanced charting or TrendSpider's automatic pattern recognition can lend a helping hand as you get the hang of things.

Are you tired of juggling multiple tools for your trading needs? TradingView is the all-in-one platform that streamlines your analysis and decision-making.
With its powerful charting capabilities, real-time data, and vibrant community, TradingView empowers traders like you to stay ahead of the market. Join thousands who trust TradingView for their trading success.

10 posts written
Unlock the power of candle patterns to decode market psychology and improve your trading precision....

Discover what IOUs mean in finance, their role as informal debt acknowledgments, and how understandi...

Unlock the power of the bear flag pattern with our practical, step-by-step guide. Understand market...

Discover the doji candlestick—a powerful price action signal revealing market indecision. This begin...