


Technical Analysis
Profiting from Head and Shoulders Patterns in Any Market
Unlock the power of the head and shoulders pattern with this complete guide. Learn to spot, trade, a...

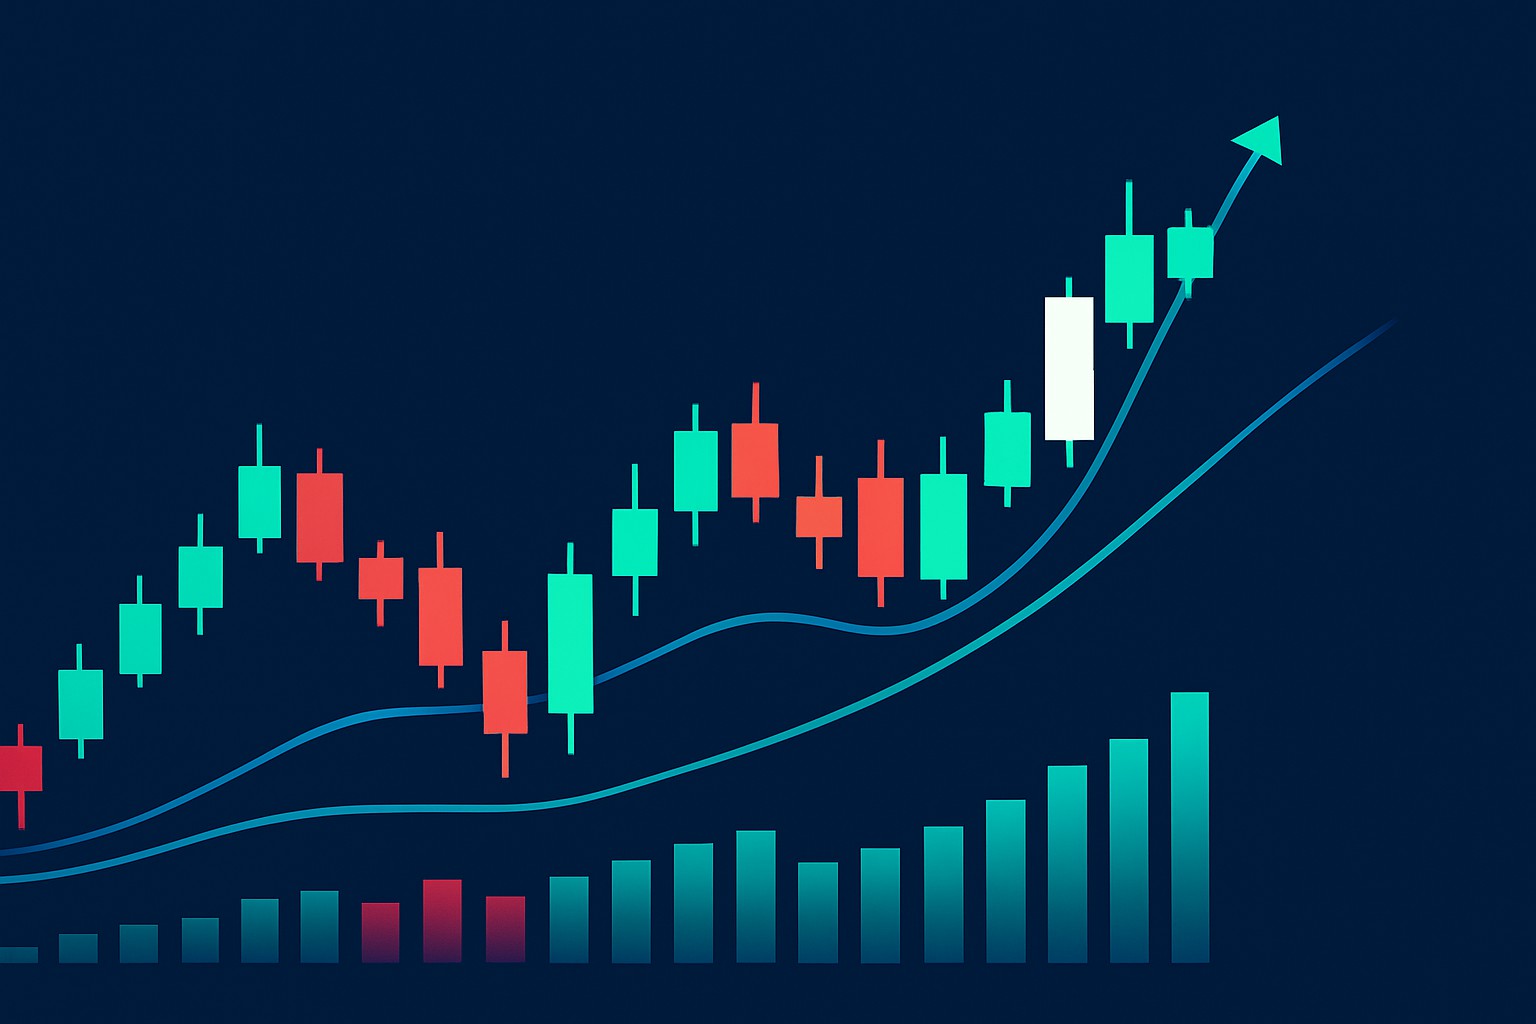
Technical chart patterns often provide handy clues about market sentiment and potential price moves. The engulfing pattern usually stands out as a pretty reliable signal that can help you better time your trades and boost your confidence.
An engulfing pattern is two candlesticks, where the second one swoops in and completely covers the first—kind of like a big wave drowning a little ripple. It often points to a potential shift in price direction, which traders from newbies to pros find pretty handy.
Engulfing patterns generally come in two main flavors: bullish and bearish. A bullish engulfing pattern typically appears right after a downtrend with a smaller bearish candle swallowed whole by a larger bullish candle. It’s like the buyers decided to crash the sellers’ party, hinting at rising buying pressure and a possible trend reversal heading north. On the flip side, a bearish engulfing pattern usually appears near the peak of an uptrend. Here a modest bullish candle gets overshadowed by a bigger bearish candle, suggesting buying enthusiasm is running out of steam and sellers might be ready to take the helm. The size difference between these candles matters because a larger engulfing candle tends to carry more weight and signals the pattern’s strength.
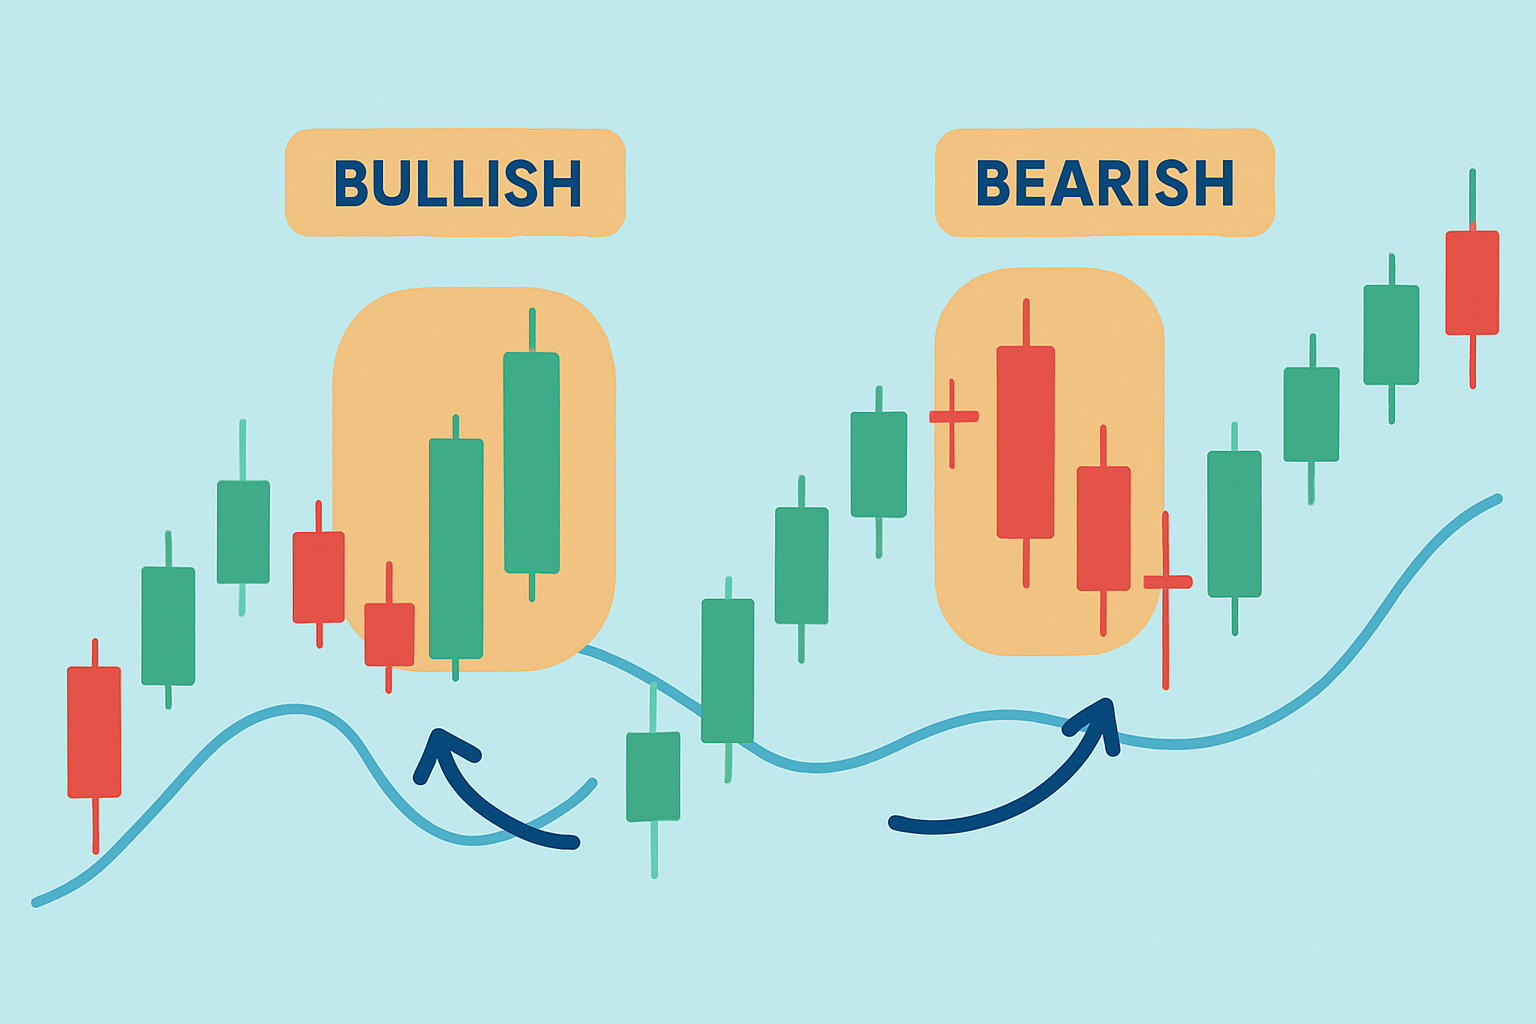
Illustration of bullish and bearish engulfing candlestick patterns on trading charts, highlighting candle sizes and trend directions.
Kick things off by choosing a solid charting platform that features candlestick charts. Having the right tools makes all the difference. Then pick a timeframe that suits your style. For example, 5-minute intervals work great if you’re day trading while daily charts tend to be the go-to for swing traders.
Take a good look at the recent price action and make sure there’s a clear trend going on. Think of it like setting the stage. You want a downtrend before hunting for a bullish engulfing pattern or an uptrend if you’re after a bearish engulfing setup.
Identify the first candle with a smaller real body. This often reveals the initial mood of the market, kind of like the calm before the storm.
Then spot the following candle that completely swallows the previous candle’s body. Make sure it opens outside and closes beyond the prior candle’s range. It’s like the second candle is saying, "I’ve got this."
Don’t forget to bring in volume or momentum indicators like RSI or MACD because these help confirm that the engulfing pattern isn’t just a fluke but is backed by real market muscle.
Finally, cross-check your signal with other trusty technical tools—think support and resistance levels, trendlines or moving averages—to stack the odds in your favor before pulling the trigger on a trade.
Give your detection accuracy a real leg up by playing with chart settings like candle size or timeframe depending on whether you’re scalping, day trading or swing trading. For instance, day traders usually stick to shorter timeframes such as 1 to 15 minutes. Swing traders often lean on daily or 4-hour charts to filter out market noise. You can also set handy filters like minimum candle size or volume thresholds to fine-tune your approach. Plenty of platforms—TradingView and TrendSpider among them—come equipped with customizable alerts and scanners that spot engulfing patterns in real time tailored for your trading style.
To dodge false signals it is key to consider engulfing patterns within the bigger picture of market structure and volume. You want to see that engulfing candle pop up at a meaningful price level or right around a trend boundary—not just lost in random price chatter. Taking a quick peek at momentum oscillators and trend indicators can up your confidence. For instance, if you spot an engulfing pattern but momentum feels limp or volume is low, it usually pays off to hold tight and wait for clearer confirmation before jumping in.
Engulfing patterns really shine when you pair them with other technical tools. When combined with trendlines and moving averages and indicators like RSI, traders get the extra confidence needed to nail their entry and exit points.
Always double-check that the engulfing pattern aligns with the bigger trend. You can usually confirm this by glancing at moving averages or drawing trendlines. It’s like making sure your story makes sense before you tell it.
Look at momentum indicators such as RSI or MACD to get an idea of whether the pattern suggests overbought or oversold conditions. Think of it as the market quietly sharing its mood.
Place your stop-loss orders just beyond the tail of the engulfing candle. This simple trick helps keep your risk contained, like setting a safety net before a tightrope act.
Don’t rely only on theory; test your engulfing pattern strategies on historical data. Watching how they perform in practice will help you adjust your approach until it feels right.
Adjust your position size based on how reliable the pattern seems and the market’s current mood swings. Managing risk is like knowing when to turn the volume up or down — it’s better to be safe than sorry.
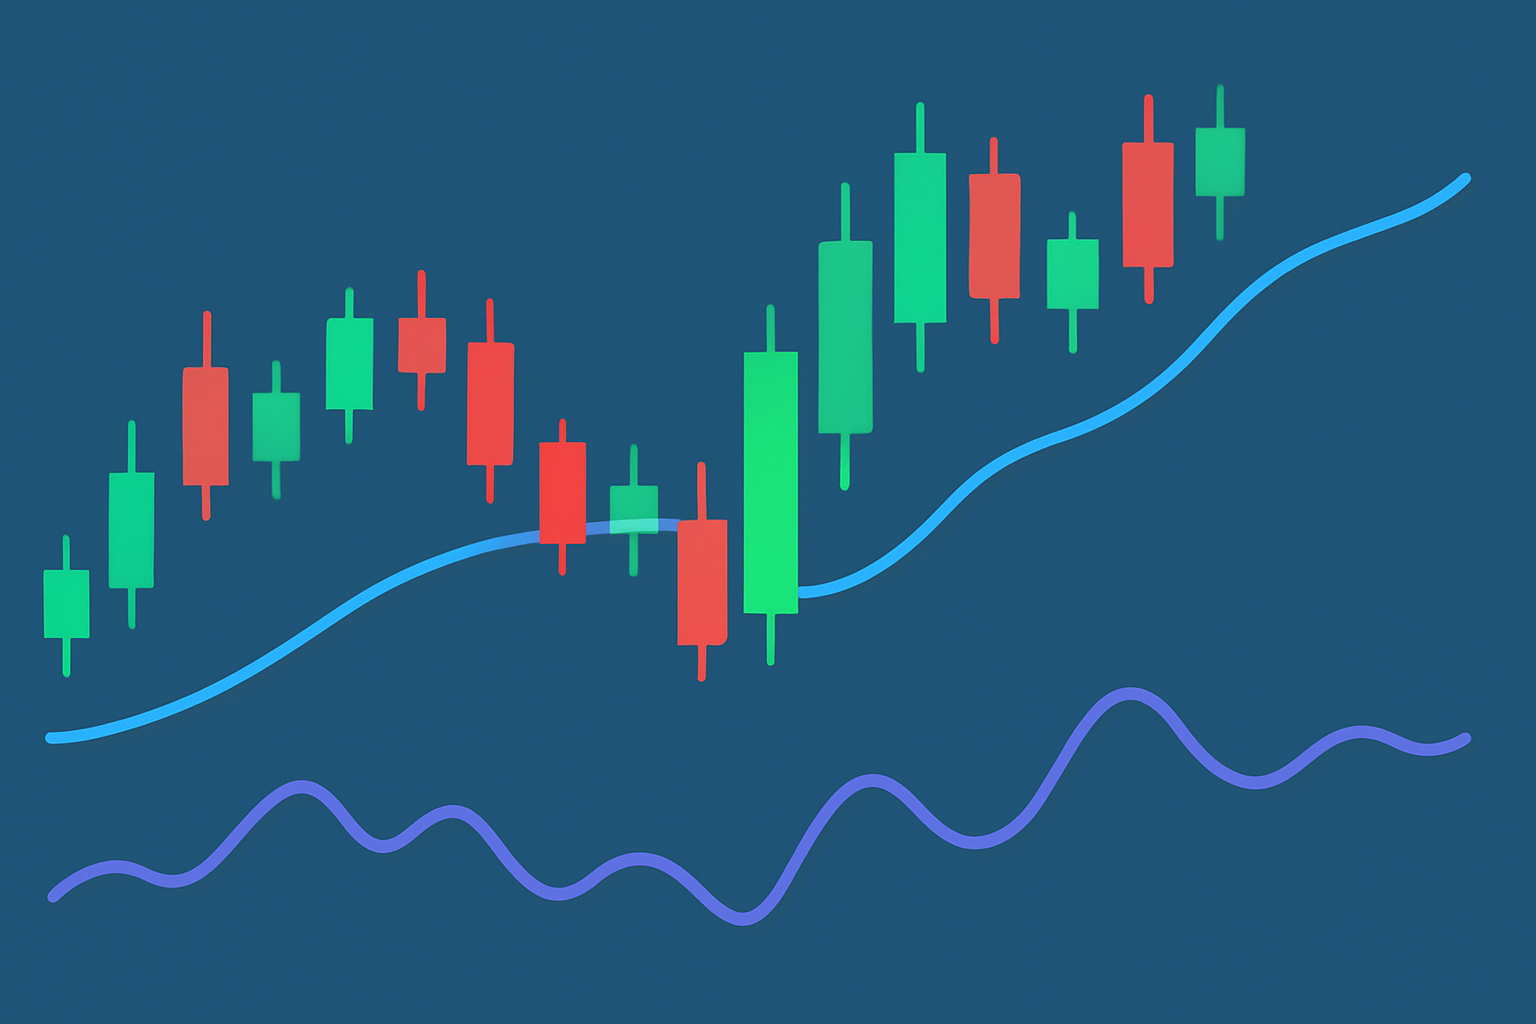
Chart demonstrating an engulfing candle aligned with moving average trends and RSI confirmation for entry signal.
Take a recent example where a bullish engulfing pattern popped up right at a solid support zone on the daily chart of a major currency pair. It was backed by rising volume and the RSI climbing out of oversold territory which sparked a nifty 5% price rally. On the flip side, a bearish engulfing candle showed up near a resistance level and teamed up with a bearish MACD crossover. That combo whipped up a pretty sweet short trade in an equity index.
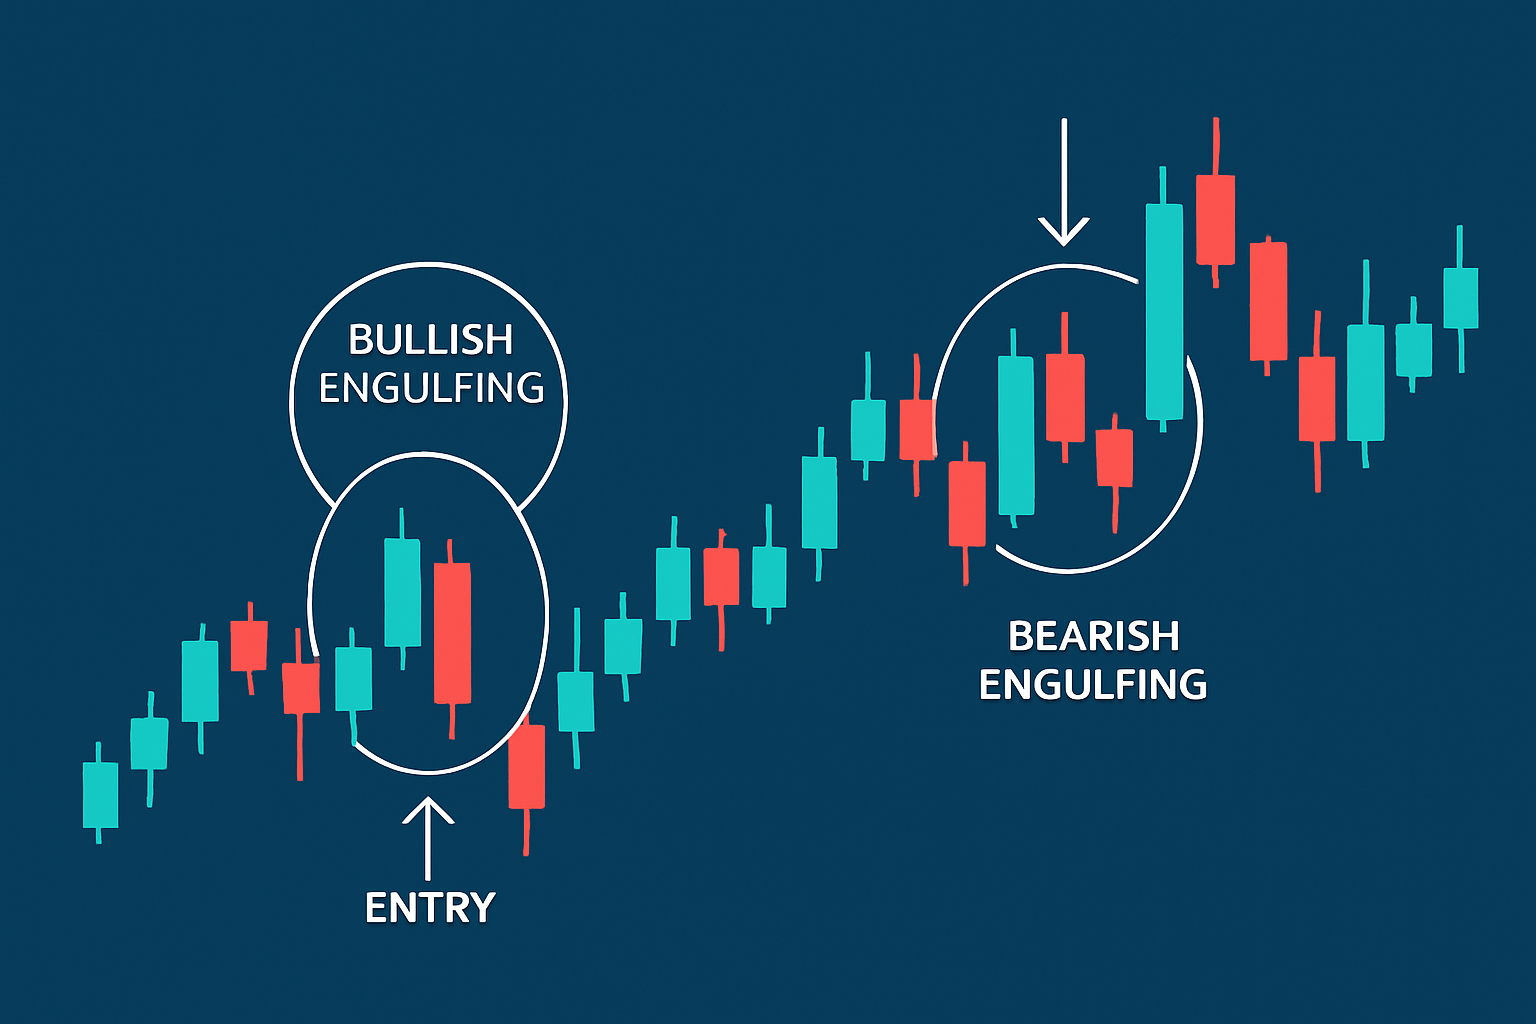
Real trading chart examples showing both bullish and bearish engulfing patterns with annotations indicating trade outcomes.
"Engulfing patterns often serve as handy little signals for potential reversals, but in my experience, patience and waiting for solid confirmation usually tip the scales between nailing a trade and missing the mark." — Susan Miller, Technical Analyst

Are you tired of juggling multiple tools for your trading needs? TradingView is the all-in-one platform that streamlines your analysis and decision-making.
With its powerful charting capabilities, real-time data, and vibrant community, TradingView empowers traders like you to stay ahead of the market. Join thousands who trust TradingView for their trading success.

17 posts written
Unlock the power of the head and shoulders pattern with this complete guide. Learn to spot, trade, a...

Discover the bullish harami candlestick pattern—a key technical signal that can hint at trend revers...

Master the hammer candlestick pattern—a key indicator for market reversals. This beginner-friendly g...

Learn how the harami candlestick pattern signals potential market reversals. This guide breaks down...