


Technical Analysis
Profiting from Head and Shoulders Patterns in Any Market
Unlock the power of the head and shoulders pattern with this complete guide. Learn to spot, trade, a...

This guide walks you through everything you need to spot and trade the head and shoulders pattern with fresh confidence.
The head and shoulders chart pattern is a classic favorite in the toolbox of technical analysts, often relied upon by traders trying to catch shifts in market trends before they fully unfold.
This article will help you spot the head and shoulders chart pattern and distinguish it from look-alikes. It also offers practical tips so you can confidently identify it on live trading charts.
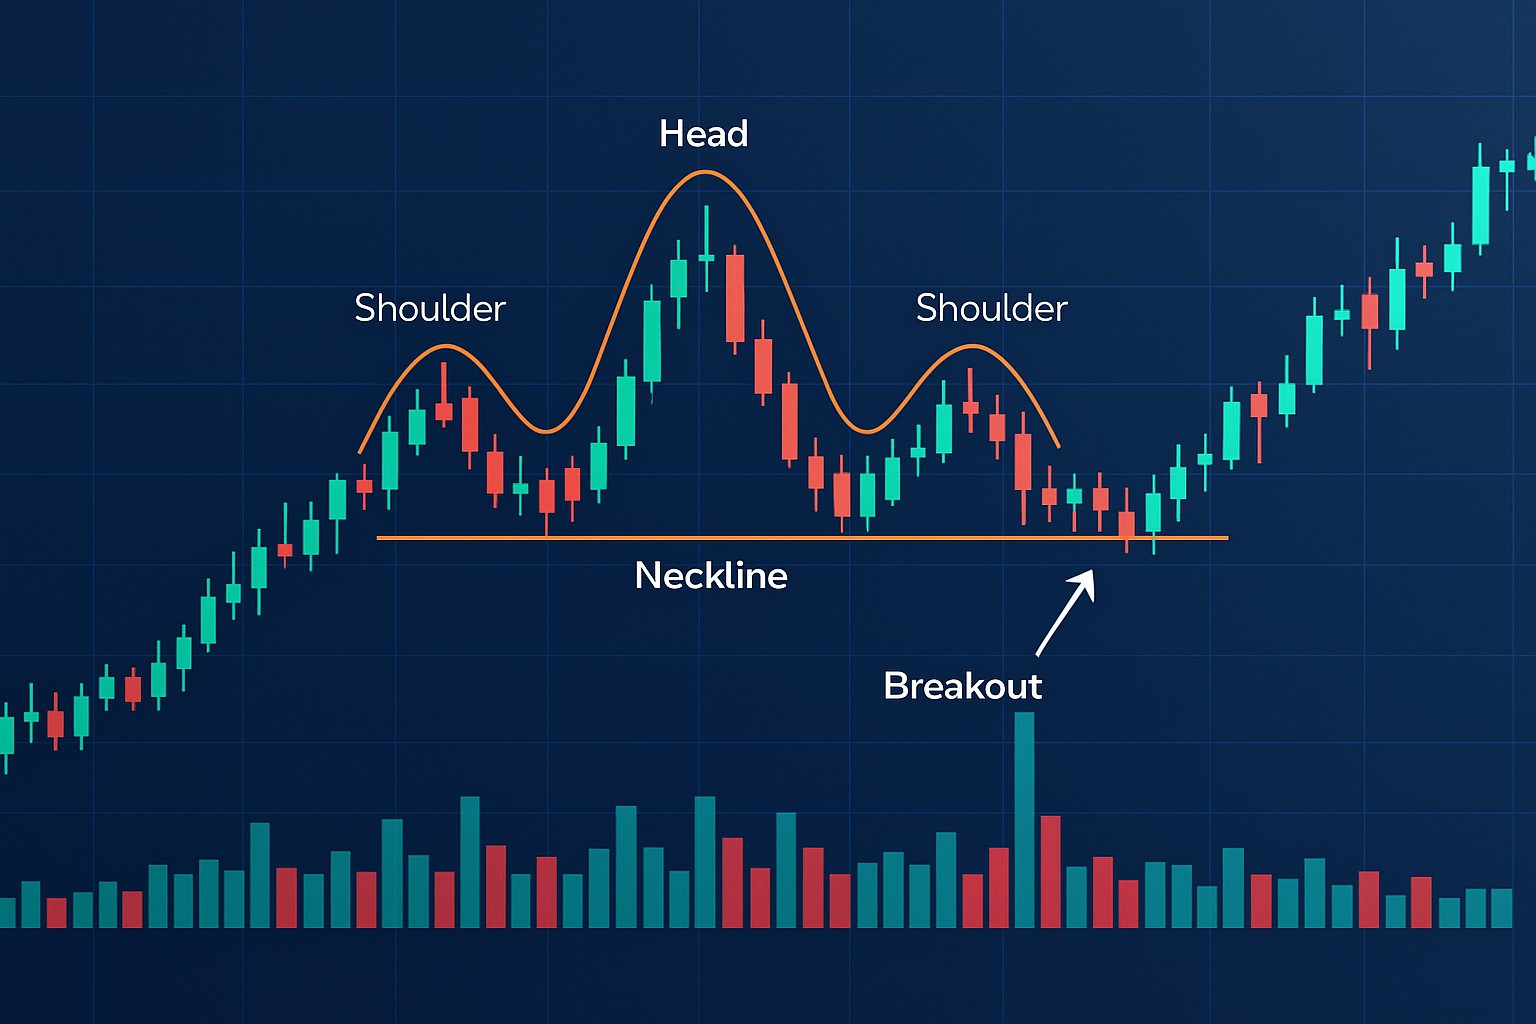
The head and shoulders chart pattern features three distinct peaks: two smaller ones on each side called the shoulders and a taller, more pronounced peak in the middle known as the head.
There are two main types you’ll want to keep in mind. The classic head and shoulders pattern typically signals a bearish reversal, while the inverse head and shoulders often hints at a bullish turnaround.
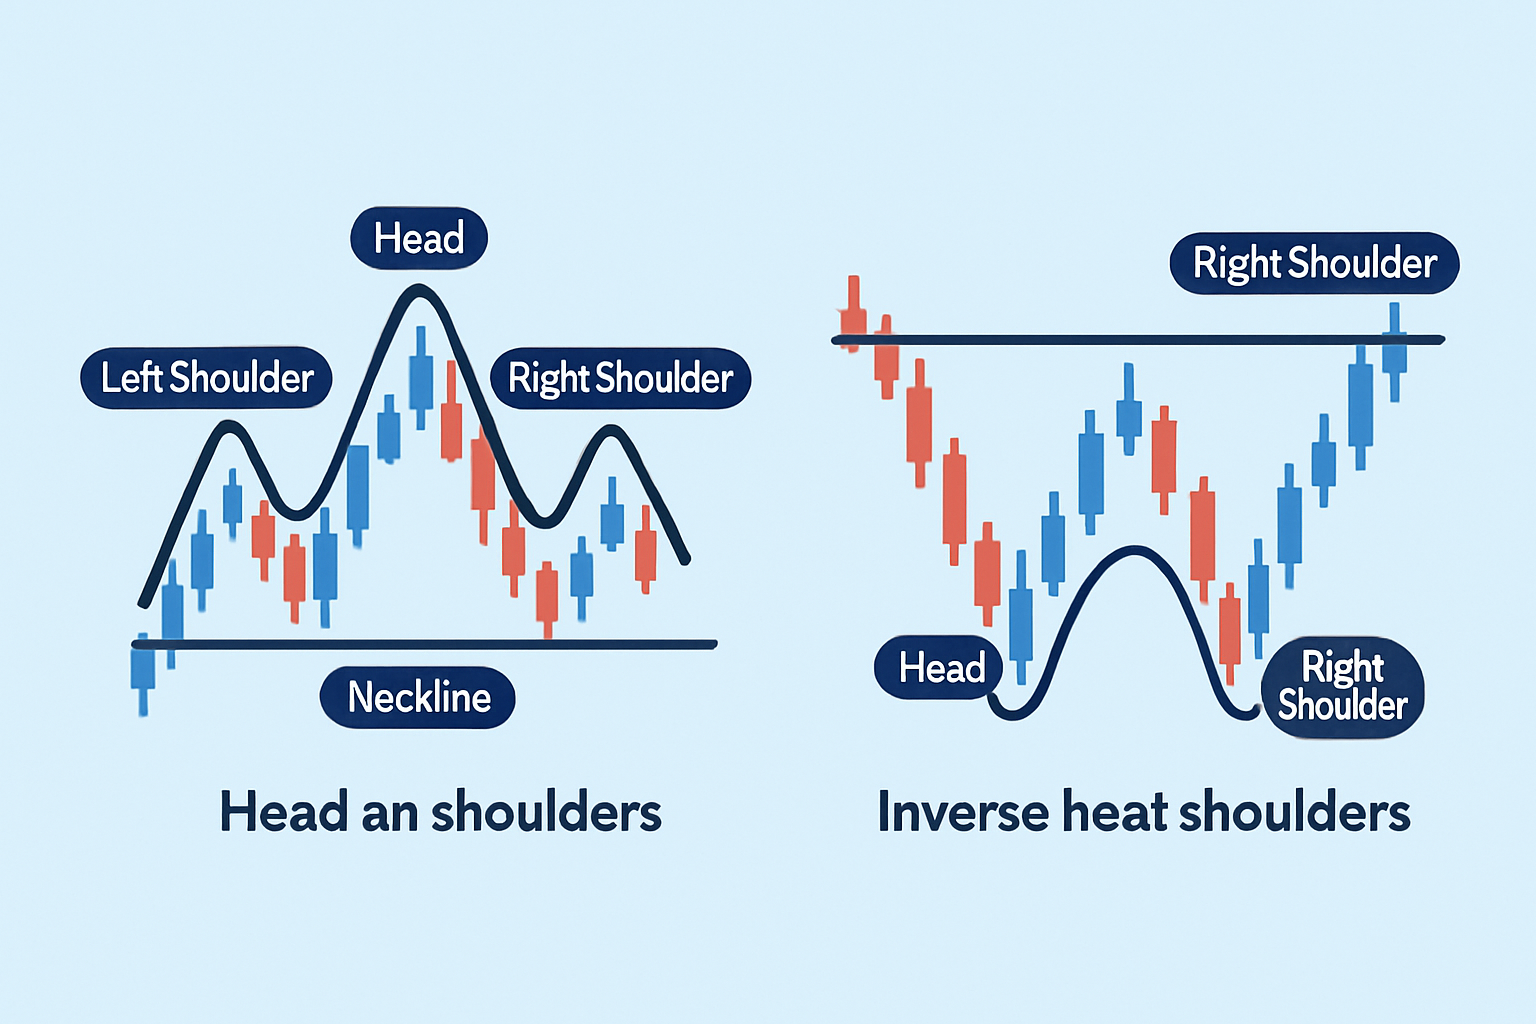
Visual comparison of the standard and inverse head and shoulders patterns, showing the formation's structure and neckline on price charts.
When it comes to reading the markets, the Head and Shoulders pattern stands out as a real crowd-pleaser for traders. It is one of those classic setups that can give you a leg up in spotting potential trend reversals. Sure, it is not foolproof—nothing in trading ever is—but understanding this pattern has saved many from a nasty surprise. You might say it’s like spotting a familiar face in a sea of strangers; once you know what to look for, it sticks with you. Whether you are a seasoned pro or just starting out, keeping an eye out for this pattern can add a little extra confidence to your decisions, and who does not like that?
This pattern carries quite a bit of weight because it often signals a clear reversal in the current trend and typically shows up just before major price swings.
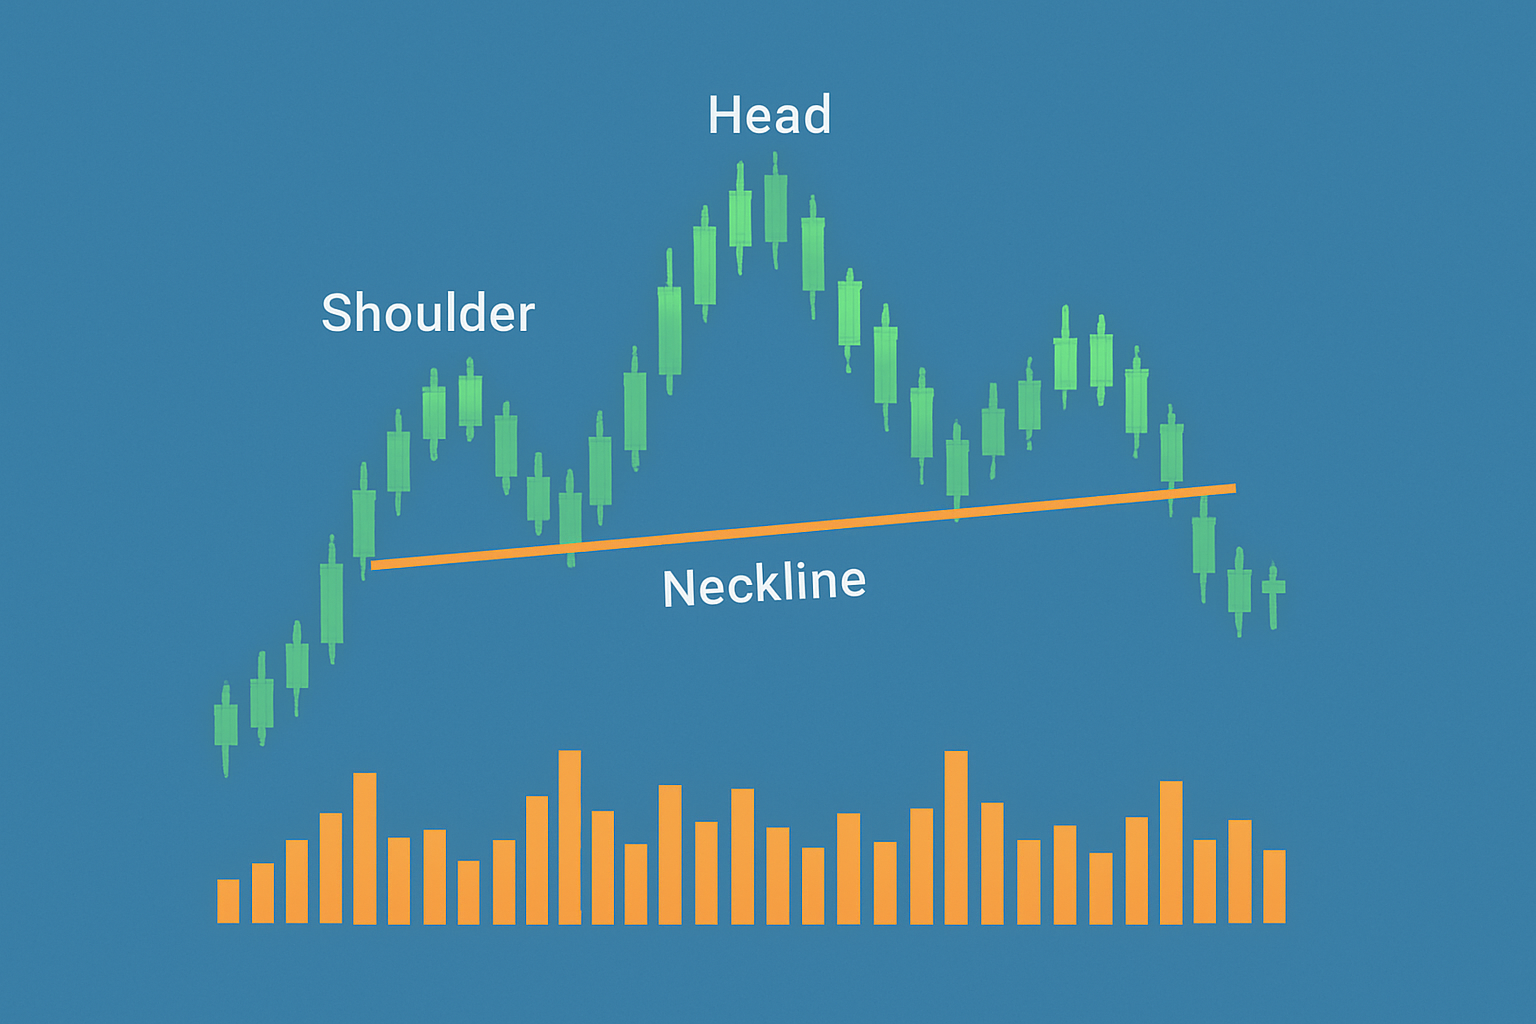
The head and shoulders pattern is a neat snapshot of how market sentiment shifts right before the tide turns. It starts with the left shoulder where buyers push prices upward but the buzz is starting to fade. Then comes the head, hitting a higher peak that seals the deal on the high point like the market saying "this is it." The right shoulder cannot keep up and falls short, showing that sellers are creeping in. This pattern shows bulls losing grip while bears flex as traders lock in profits or jump into short positions.
Spot the left shoulder which you can identify by an initial price peak followed by a moderate pullback, like the market taking a quick breather and signaling temporary resistance.
Keep an eye on the head as the price pushes above that left shoulder to hit a higher peak. This often shows signs that momentum is starting to lose steam.
Then comes the right shoulder, a peak lower than the head that hints the buying pressure is fading. Think of it as the market catching its second wind but not making the sprint.
Draw the neckline by connecting the lowest points between the left shoulder and head and between the head and right shoulder. This line acts as a vital support level holding things together for now.
Check the volume patterns. Volume tends to be higher during the left shoulder and head formation but often drops off during the right shoulder like the crowd slowly trickling away.
Watch out for a breakout below the neckline support since that’s the classic confirmation signal. It usually suggests it is time to consider a trade entry.
Really nail down the pattern’s strength by keeping an eye out for matching volume signals. Typically you’ll see higher volume during the head’s rise and then lower volume on the right shoulder. This tends to make the pattern more trustworthy.
An example of the head and shoulders pattern overlaid on a price chart with volume indicators showing typical volume behavior.
You can sidestep the usual traps by looking at price structure together with volume confirmation and then importantly waiting patiently for a clear breakout before jumping in. Working with longer timeframes and double-checking against other technical indicators boosts accuracy and helps weed out false signals that tend to mess with your head.
Modern charting platforms come packed with handy tools like customizable drawing options and volume indicators. They also include alert systems that help traders lock onto and confirm head and shoulders patterns with more confidence.
Platforms like TradingView come packed with many technical indicators and drawing tools that help users pinpoint tricky shoulders, heads and necklines accurately. Services such as TrendSpider bring AI-powered pattern recognition to the table. They automatically spot head and shoulders formations and alert you when key conditions line up just right.
Traders often jump in once the neckline breakout gets the green light. They’re quick to place stop-loss orders to keep risk from running wild and set price targets based on the pattern’s height, mapping out their exits like a well-rehearsed dance.
Hold your horses until you see a clear breakout below the neckline in a standard pattern or above it in an inverse pattern before jumping into a trade. Patience really pays off here.
Find your target price by measuring the vertical distance from the head’s peak down to the neckline, then project that exact distance starting from the breakout point. Think of it as drawing a straight line to your goal.
Set your stop-loss just above the right shoulder in a head and shoulders pattern or just below it in an inverse pattern. This little safety net helps keep potential losses in check because nobody likes surprises in trading.
Keep your risk in line by sizing your position according to your overall trading capital and risk tolerance. Think of it as knowing how much weight your financial boat can carry before taking on water.
Don’t rely on the head and shoulders pattern alone. Mix it up by combining it with other technical indicators like moving averages or RSI. This combo boosts your confidence and helps you avoid jumping the gun on those trade signals.
Cryptocurrency markets on platforms like Binance often show the head and shoulders chart pattern on longer timeframes. This signals a big trend reversal and can be useful for both spot and futures trading strategies. For stocks or forex, this pattern helps traders improve timing for entries and exits, especially when markets behave unpredictably.
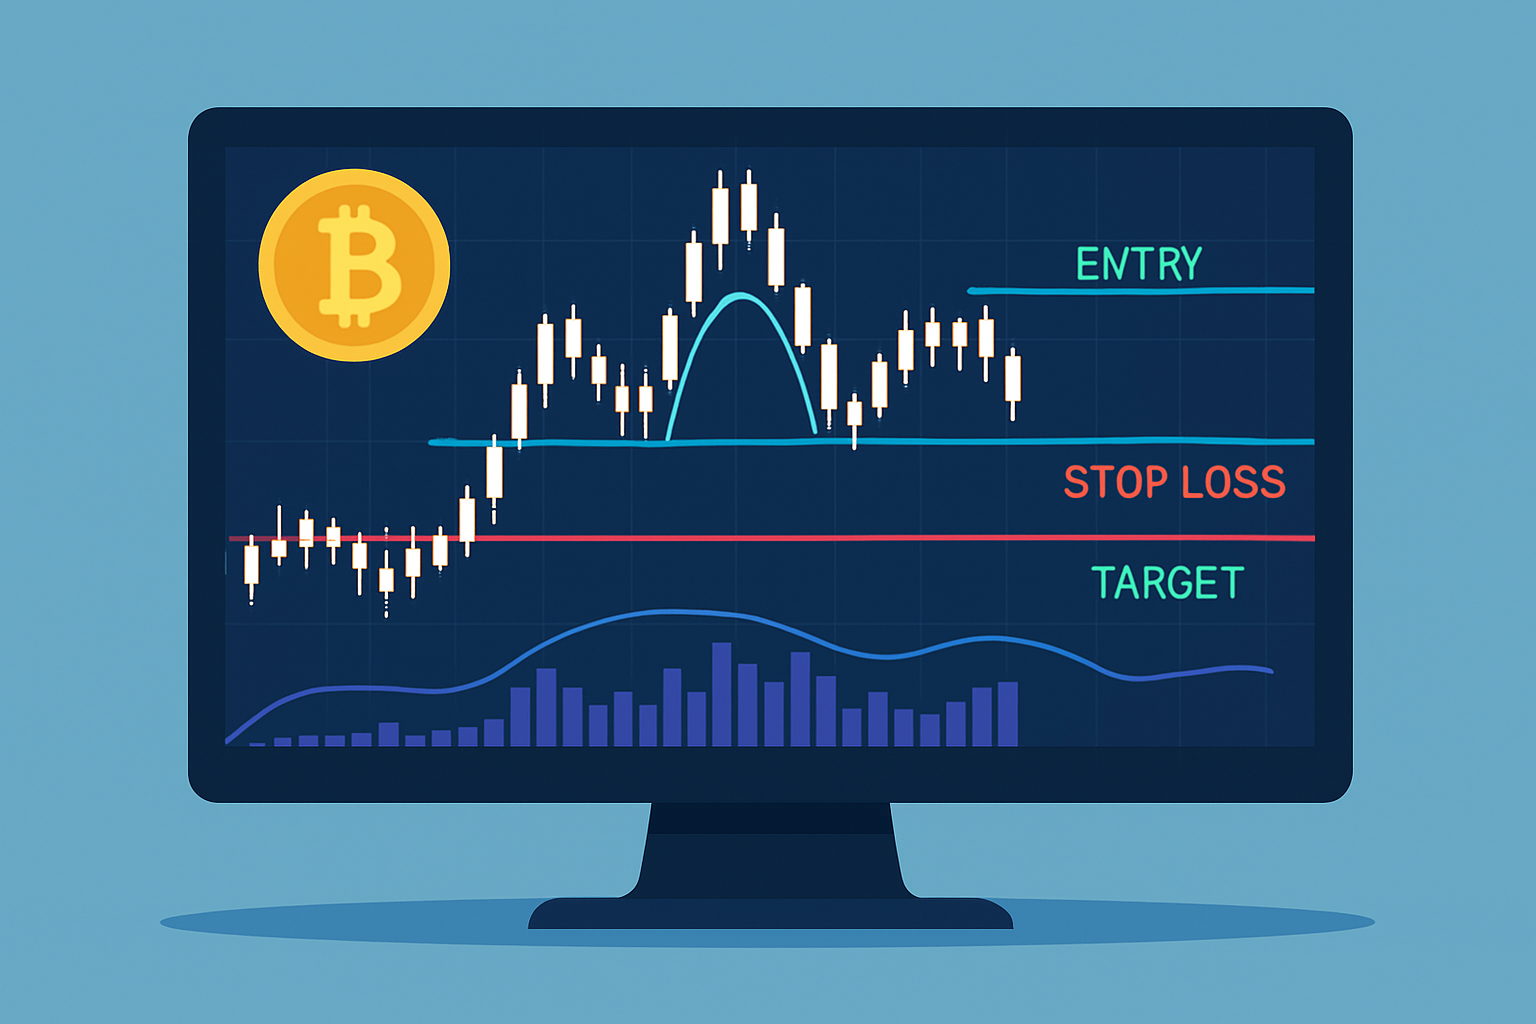
Example of a head and shoulders pattern applied to a cryptocurrency chart, demonstrating trade entry, stop-loss placement, and price target.

Are you tired of juggling multiple tools for your trading needs? TradingView is the all-in-one platform that streamlines your analysis and decision-making.
With its powerful charting capabilities, real-time data, and vibrant community, TradingView empowers traders like you to stay ahead of the market. Join thousands who trust TradingView for their trading success.

19 posts written
Unlock the power of the head and shoulders pattern with this complete guide. Learn to spot, trade, a...

Discover the doji candlestick—a powerful price action signal revealing market indecision. This begin...

Unlock the power of candle patterns to decode market psychology and improve your trading precision....

Discover the bullish harami candlestick pattern—a key technical signal that can hint at trend revers...