


Technical Analysis
Most Important Candle Patterns Every Trader Should Know
Unlock the power of candle patterns to decode market psychology and improve your trading precision....

This article walks you through spotting and trading the morning star candlestick pattern, a handy sign that the market might just be ready for a reversal.
The morning star candlestick pattern is a classic bullish reversal signal in technical analysis that many traders swear by. It appears at the bottom of a downtrend and offers a clear hint that selling pressure might finally be letting up. This paves the way for some upward momentum. This pattern consists of three distinct candles. Its main takeaway is that buyers are gradually starting to seize the reins.
The morning star candlestick pattern plays out over three candles, each telling a little story about how the market's mood swings. It kicks off with a hefty bearish candle that clearly shows selling pressure is at full throttle and momentum is negative. Next is a small-bodied candle—often a Doji or a spinning top—that gaps down. This hints at hesitation and a likely pause in the selling frenzy. Finally, the pattern wraps up with a strong bullish candle that closes well inside the first candle's body. This is a subtle but powerful signal that buyers are stepping back into the ring with renewed energy.
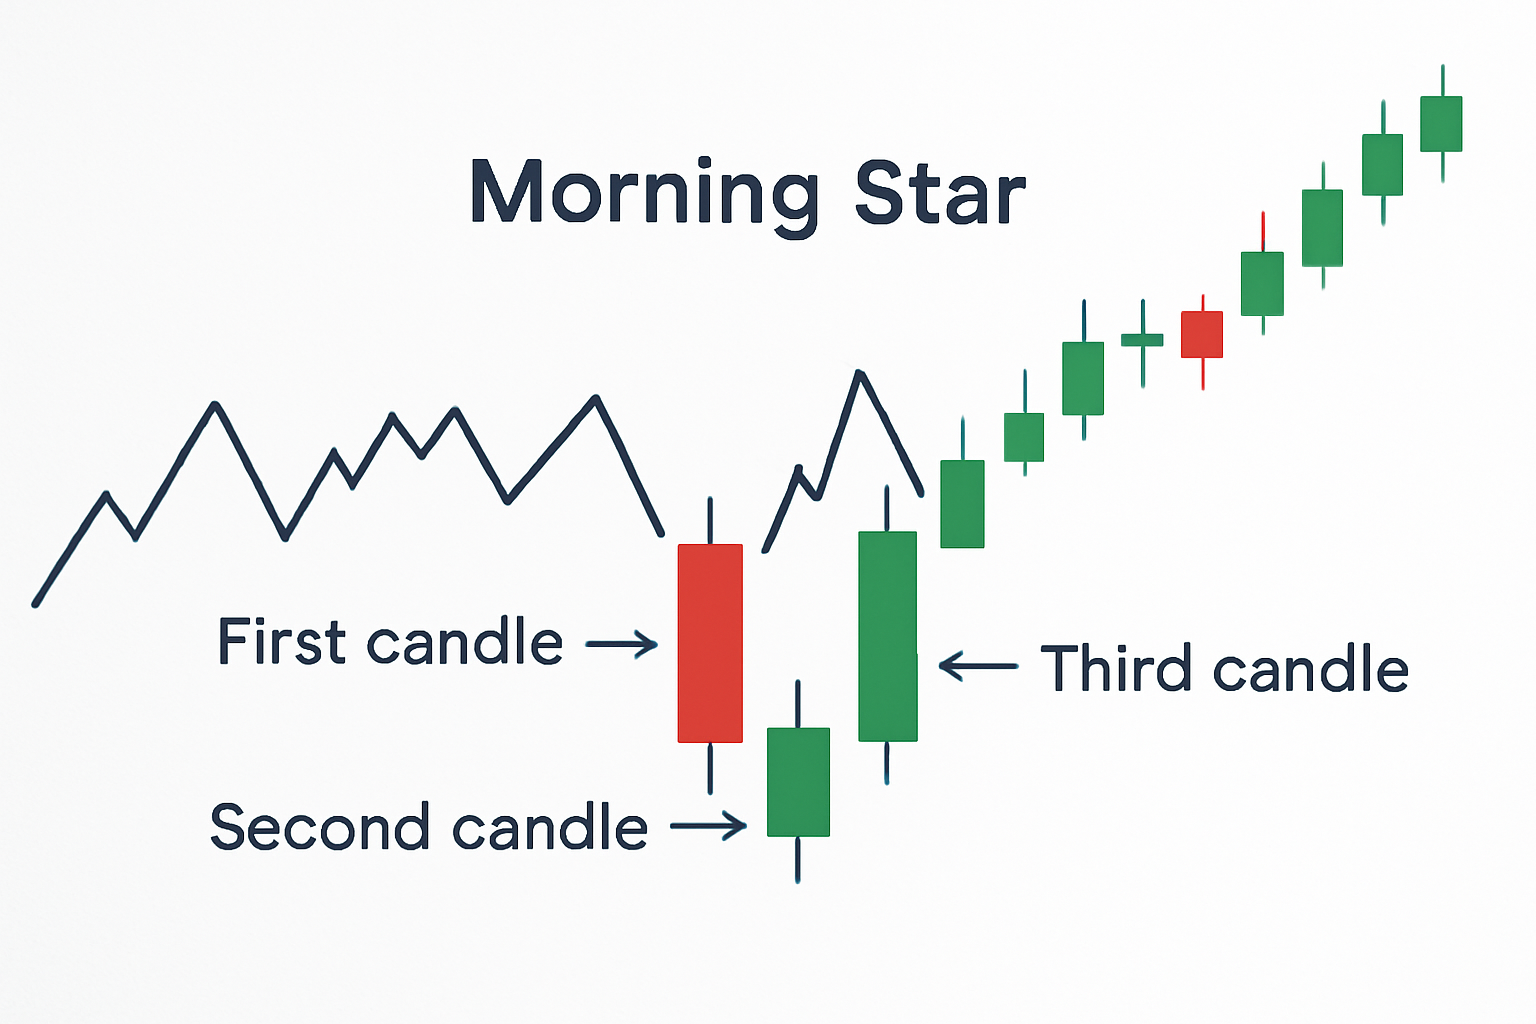
Visual representation of the morning star candlestick pattern showing the large bearish candle, the small indecisive star candle, and the large bullish candle.
Pinpoint a clear downtrend where the price has been steadily sliding downward, usually a pretty strong hint that bearish sentiment is running the show.
Keep an eye out for a long bearish candle—this one’s like a flashing neon sign telling you the selling pressure and momentum are still going strong.
Spot that second candle—a small-bodied one or sometimes a Doji—that gaps down from the first. It’s kind of like the market catching its breath, showing a touch of hesitation and maybe a brief pause in the downward march.
Look for a third candle, this time a big bullish candlestick that closes comfortably within the range of that initial bearish candle.
Seal the deal by checking if the last bullish candle is backed up by higher trading volume, which often signals that buyers are stepping up and throwing their weight around.
Spot a genuine morning star among other similar patterns or false alarms by zeroing in on the gap down between the first and second candles—and then take note of how much bigger the third candle is compared to the rest. Typically, a trustworthy morning star wraps up with a solid bullish candle that clawbacks a good chunk of the previous day's losses.
Each criterion plays a vital role in shoring up the pattern's reliability, signaling that buyers may finally be stepping up to take control after a stubbornly long downtrend. For example, a big bullish candle popping up after a lull of low volume or sideways action might not win you over without some solid volume backing it up. Similarly, the tiny size and noticeable gap of the middle candle reveal a moment of hesitation—something that tends to boost confidence that a shift in sentiment is brewing.
Advanced charting platforms often make it easy to spot morning star patterns quickly with less fuss. They have nifty pattern recognition tools that highlight possible morning stars and even nudge you with alerts so you do not miss a beat. You can customize your watchlists and filters to focus on your preferred asset types whether that’s stocks, forex or the ever-exciting crypto world. Automated scanning is great but I’ve found that manually scanning daily or weekly charts can be more effective since the signals stand out clearer there. Pairing candlestick patterns with volume and momentum indicators is another trick that usually ups your accuracy. It’s like having a little extra insight tucked under your sleeve.
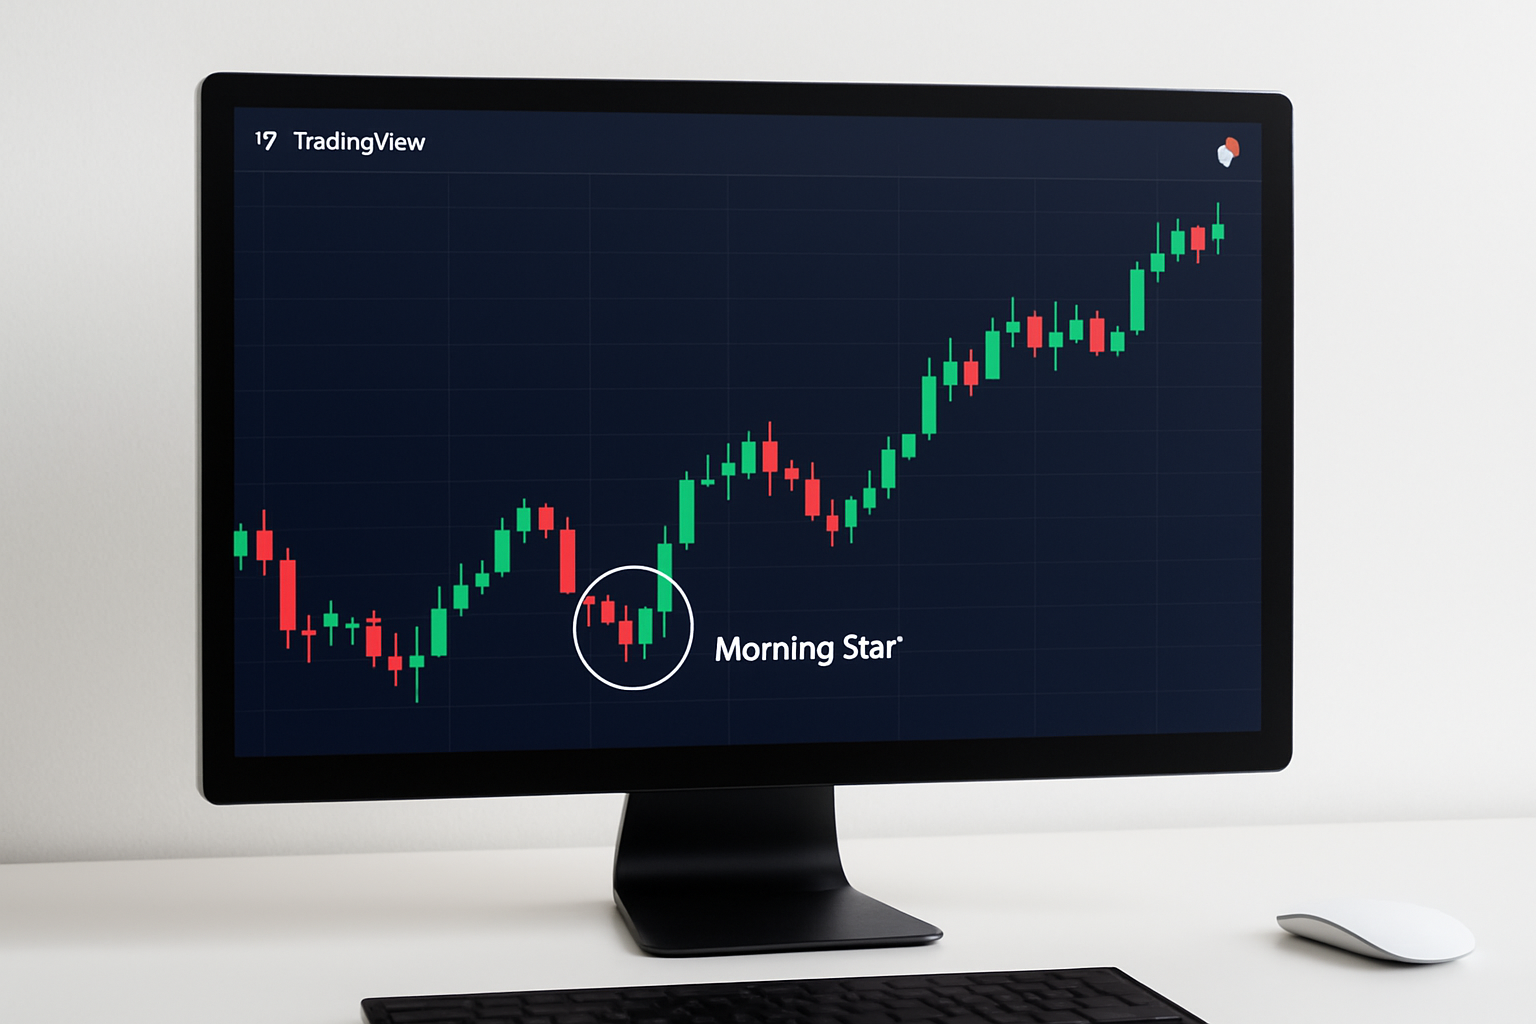
Example of a charting platform highlighting a morning star candlestick pattern with alert features enabled.
You can dodge these common pitfalls by pairing candlestick analysis with volume and momentum indicators. Patiently let the pattern reveal itself and then cross-check it against the bigger picture of the market trend.
Using the morning star candlestick pattern in your trading strategy involves more than just spotting the pattern itself. It requires careful risk management and thoughtful planning. I’ve found it’s best to set your entry points just above the high of the bullish candle. This way, you get confirmation that the upward move is genuine. Don’t forget to place your stop-loss orders below the middle star candle to protect yourself from unexpected losses. Pairing this pattern with other tools like moving averages or the Relative Strength Index (RSI) often helps confirm the signal’s reliability. It’s also wise to set conservative profit targets to lock in gains as the trend unfolds. Slow and steady usually wins the race here.
Make absolutely sure that the market or asset is genuinely in a downtrend before the morning star pattern appears.
Wait patiently until the morning star pattern fully forms — all three candles must meet the criteria.
Check volume or momentum indicators like RSI or MACD as they are useful for confirming whether buying pressure is starting to return.
Set your entry just above the high of the bullish candle to catch the initial momentum of the uptrend as it builds.
Be smart with your stop-loss and place it just below the low of the middle star candle to protect yourself from false breakouts.
Choose your profit targets carefully based on nearby resistance levels or consider using trailing stops to lock in your gains without worry.

Are you tired of juggling multiple tools for your trading needs? TradingView is the all-in-one platform that streamlines your analysis and decision-making.
With its powerful charting capabilities, real-time data, and vibrant community, TradingView empowers traders like you to stay ahead of the market. Join thousands who trust TradingView for their trading success.

19 posts written
Unlock the power of candle patterns to decode market psychology and improve your trading precision....

Discover the doji candlestick—a powerful price action signal revealing market indecision. This begin...

Unlock the power of the head and shoulders pattern with this complete guide. Learn to spot, trade, a...

Discover what IOUs mean in finance, their role as informal debt acknowledgments, and how understandi...