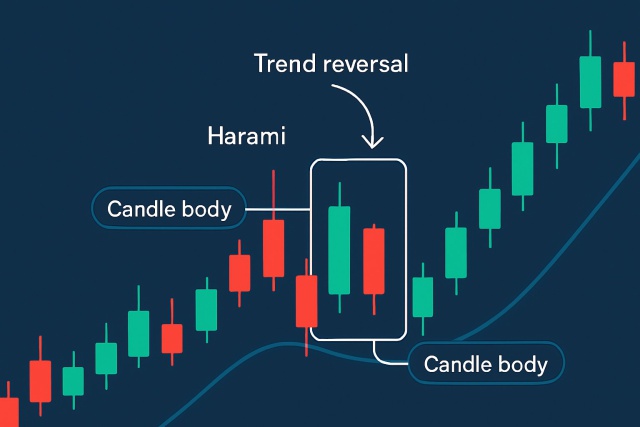
What is a Harami Pattern? Breaking It Down
Learn how the harami candlestick pattern signals potential market reversals. This guide breaks down...
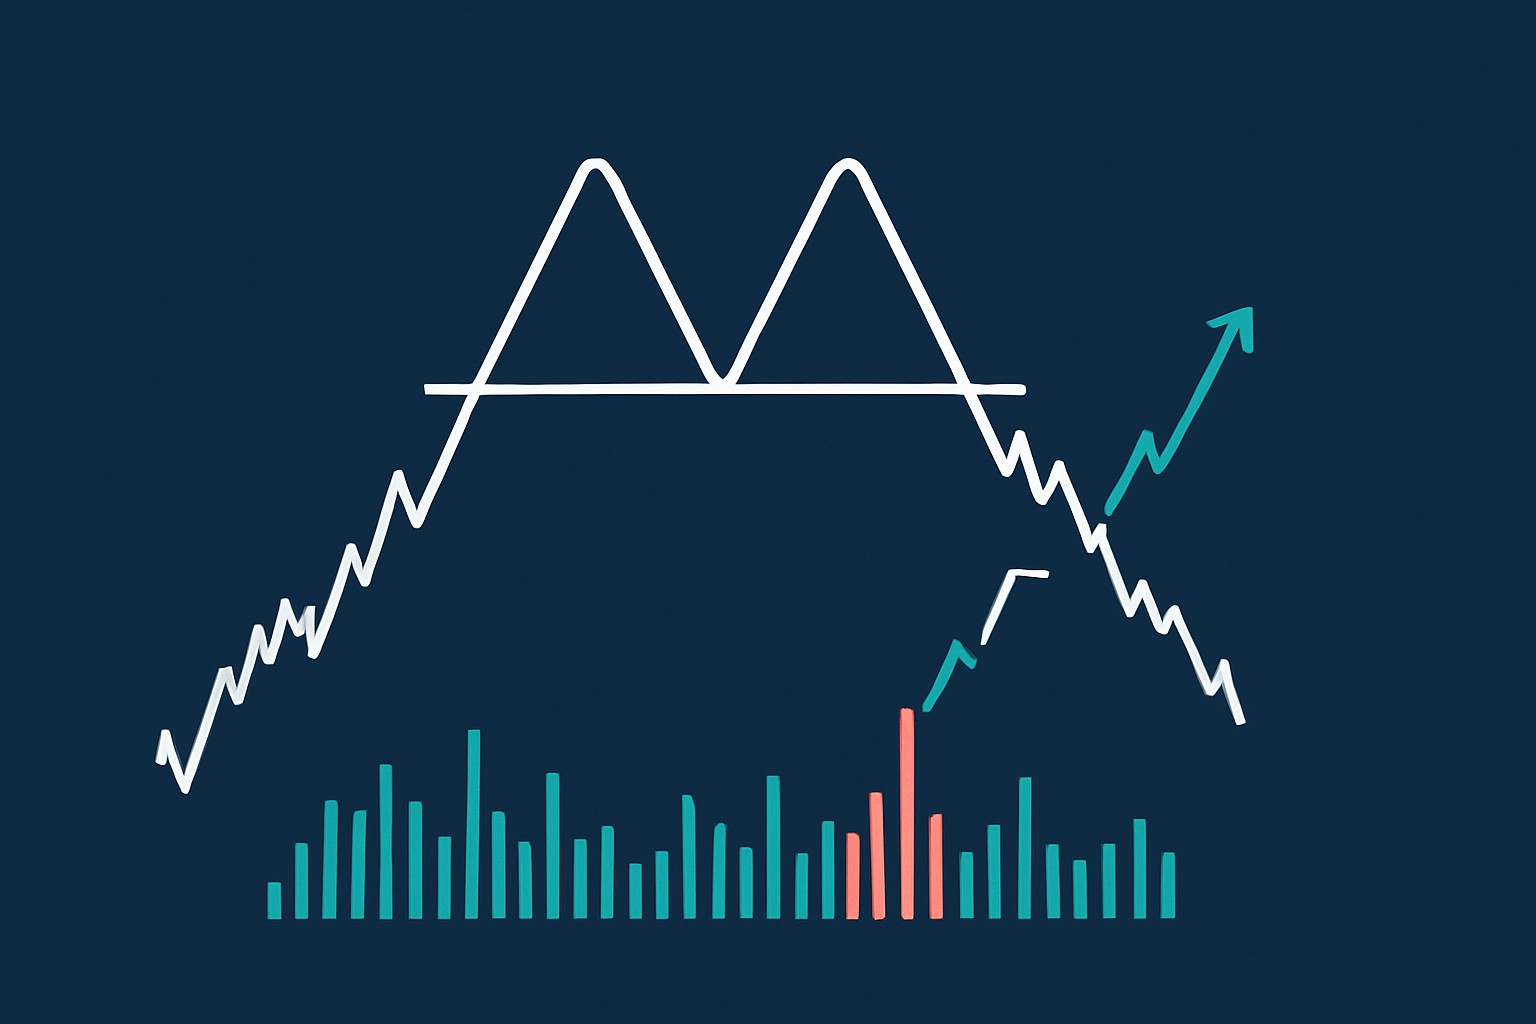
The double top pattern is a classic go-to signal in technical analysis, often waving a little red flag that an uptrend might be about to take a nosedive into a downtrend.
Picture a price climbing to a peak then taking a little breather before giving it another go but falling just short of reaching a new high. This familiar dance where you see two peaks hanging around the same level is what people call a double top.
Spotting a double top calls for a keen eye on those price charts. You’re looking for two peaks that sit nearly neck and neck in height, with a clear dip in between to catch your attention. It’s wise to keep a close watch on volume patterns.
Spot that first big peak where the price hits a noticeable high on the chart—kind of like the market making its grand entrance.
Keep an eye on the price as it dips back down to the support zone often called the neckline where it tends to catch its breath.
Watch for a second peak forming close to the first one but don’t expect it to top the initial high—think of it as a polite nod rather than a full-on encore.
The real confirmation comes when the price slips below the neckline. This is a classic sign that a reversal might be just around the corner.
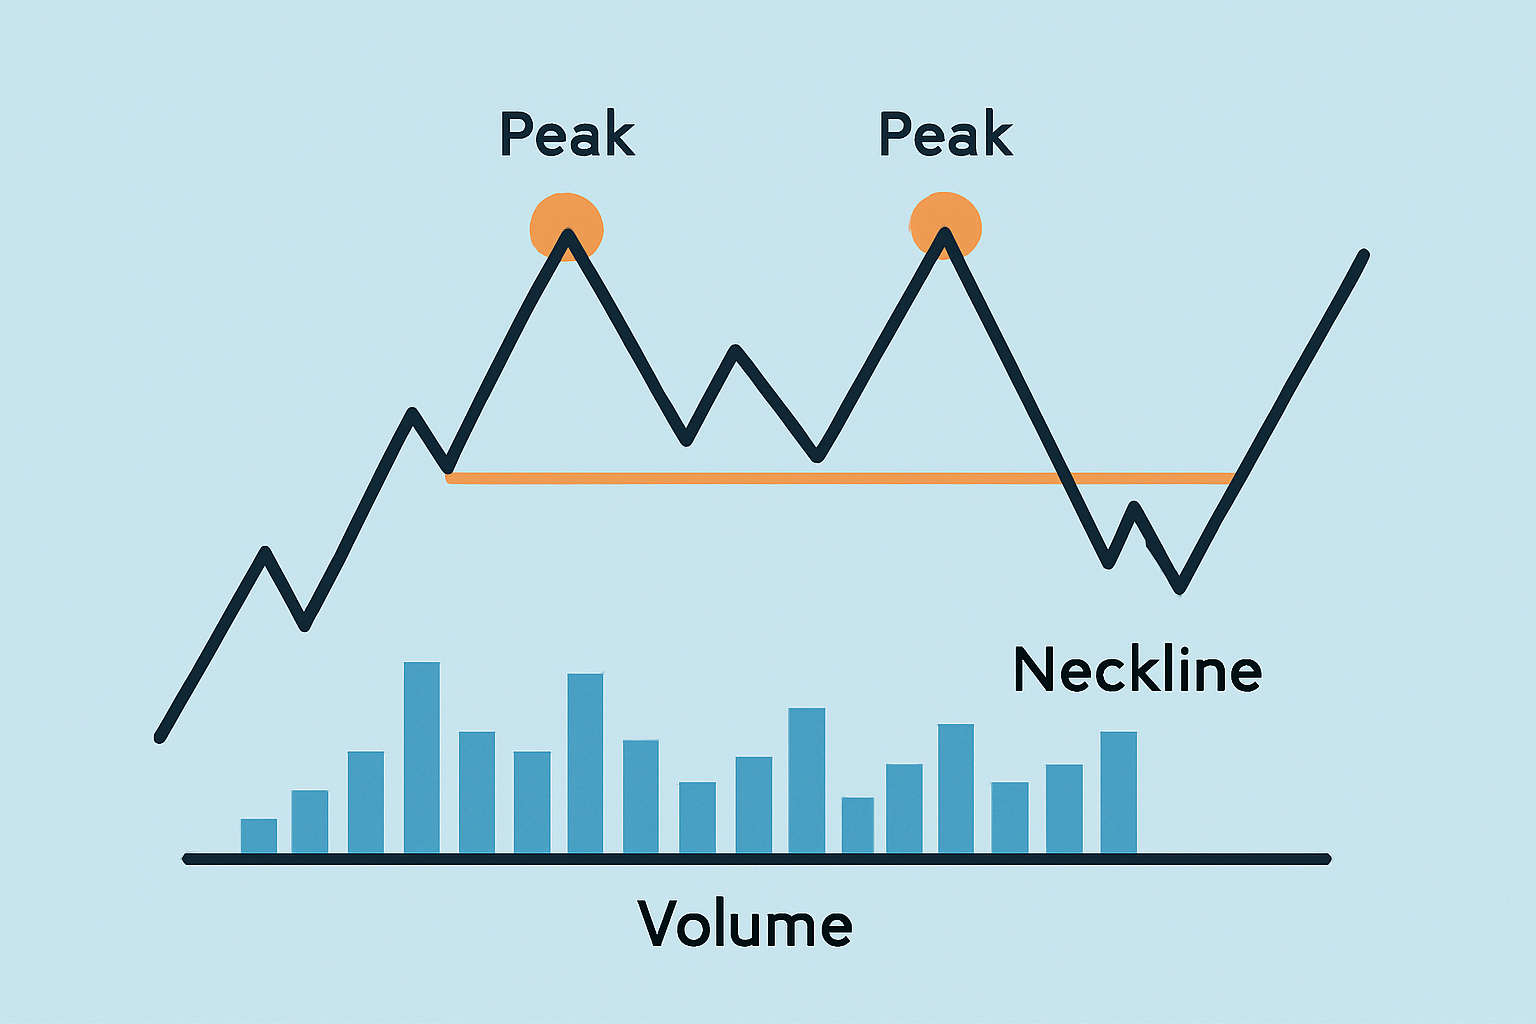
Annotated chart of a double top pattern illustrating the two peaks, neckline, and volume changes for clear identification.
Volume really holds the keys when you’re trying to confirm a double top pattern. Typically you’ll see a noticeable spike in volume as the price hits the first peak. This signals strong buying interest. Then as the price dips back down to the neckline, the volume usually takes a breather and drops off. When climbing back up to the second peak, the volume tends to be lighter and quietly hints that the buying pressure is starting to fade.
The double top pattern is handy because it signals when the upward momentum is starting to lose steam and sellers could be stepping up their game. For traders, it often marks a potential turning point—where rising prices might take a breather or even head south—giving them a timely heads-up to manage risk or brace for possible declines.
"> The double top pattern often shows up as the classic last-ditch warning before a rally decides to take a U-turn. Catching it early on can save your investments from unpleasant surprises and, if you play your cards right, open the door to fresh trading opportunities."
Traders often lean on the double top pattern as their trusty signpost for when to jump into a trade and just as importantly how to keep their risk in check by waiting for that all-important confirmation when the neckline finally gives way. Typically, they tuck in their stop-loss orders just a whisker above the second peak—kind of like setting a safety net—so they don’t get caught off guard by sudden moves. Profit targets tend to be drawn up by measuring the pattern’s height, giving them a nicely tailored exit plan.
Clearly spot the double top pattern by identifying two peaks sitting pretty close to the same price level—think of it as the market trying to hit the same high note twice.
Be patient and hold your horses until the price dips below the neckline before jumping in with a short position.
Place a stop-loss order just above the second peak to shield yourself from any surprise price leaps that might catch you off guard.
Work out your profit target by measuring the distance between those peaks and the neckline, then imagine that same gap dropping down from the breakout point—it's like setting your sights on where the price might land next.
Traders often sharpen their accuracy by pairing double top patterns with other trusty indicators such as the Relative Strength Index (RSI) or moving averages. Platforms like TradingView or TrendSpider come packed with slick charting tools and handy automated alerts that really take the guesswork out of spotting these patterns.
No technical pattern can guarantee success if only it were that simple. The double top pattern is definitely a handy tool in your trading toolbox, but it’s far from foolproof and sometimes throws false signals your way. That’s precisely why good old-fashioned risk management is a must, like setting stop-loss orders and keeping an eye on the broader market landscape.
Imagine a stock chart where the price rises to $50 then declines to $45 and rebounds to approximately $49.50 but struggles to surpass the $50 level. Volume spikes at the first peak but decreases at the second indicating reduced momentum. When the price falls below $45, traders using tools like TrendSpider often receive alerts that confirm a double top pattern which typically triggers sell orders promptly. By placing stop-loss orders just above $50 and setting profit targets near $40 based on the distance between the peak and the neckline, traders can navigate the anticipated downtrend with greater confidence.
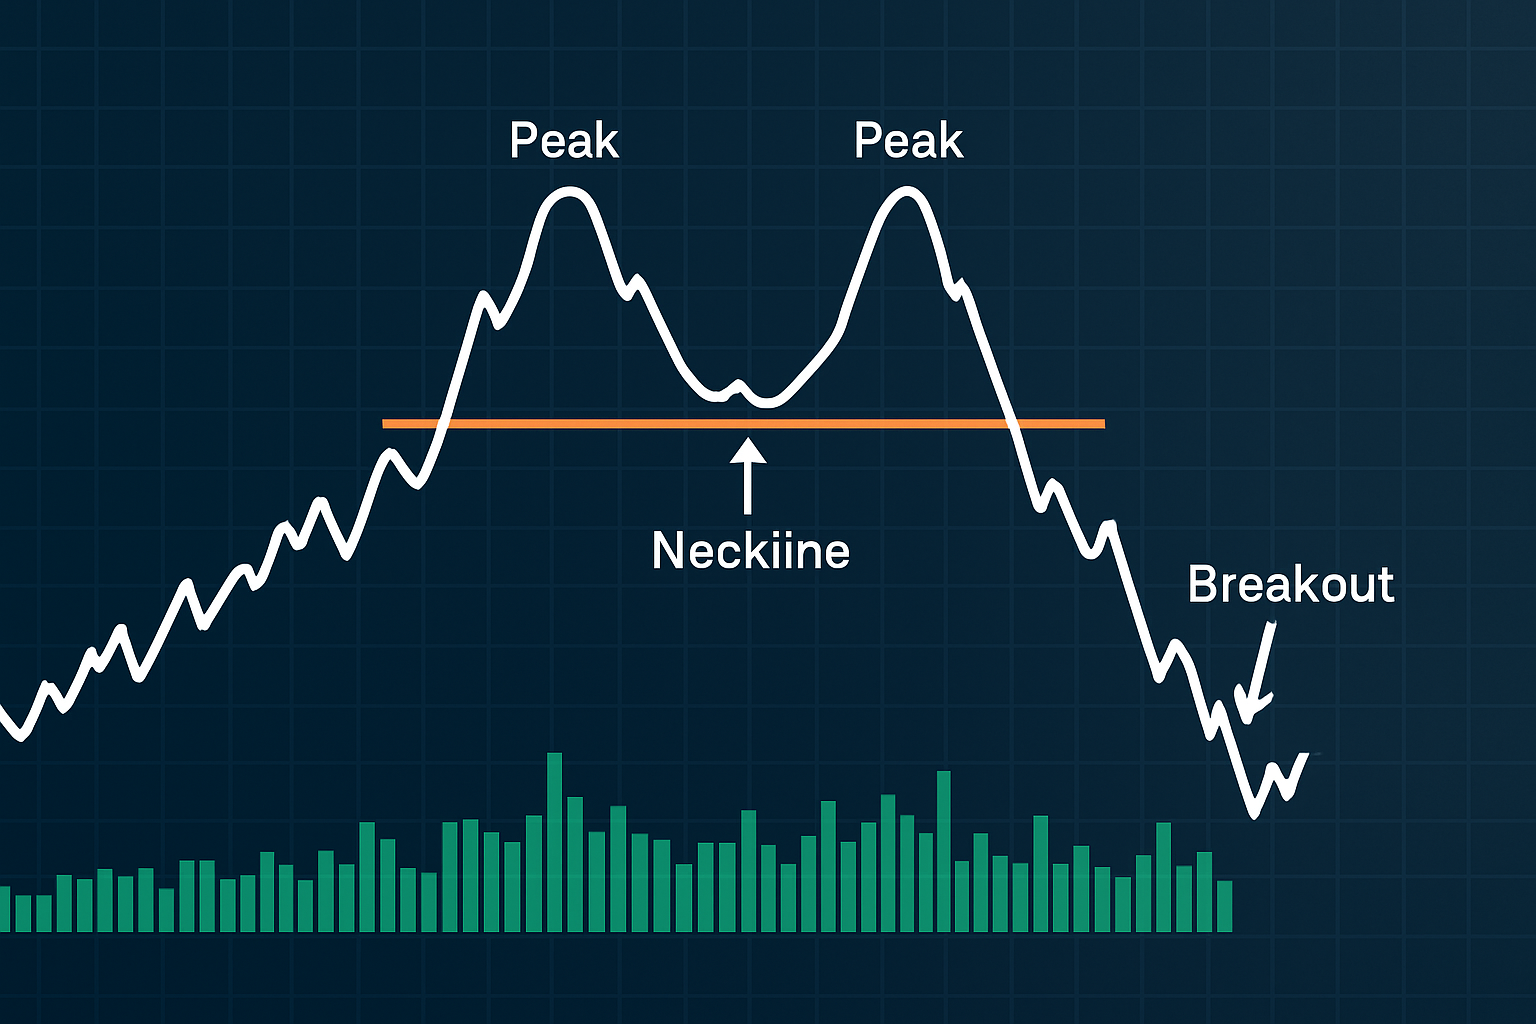
Example of a double top pattern on a real trading chart annotated with peaks, neckline, and breakout confirmation.
Are you tired of juggling multiple tools for your trading needs? TradingView is the all-in-one platform that streamlines your analysis and decision-making.
With its powerful charting capabilities, real-time data, and vibrant community, TradingView empowers traders like you to stay ahead of the market. Join thousands who trust TradingView for their trading success.
As a trader seeking opportunities in the dynamic crypto market, you need a reliable and secure platform to execute your strategies. Coinbase, the leading cryptocurrency exchange, offers a seamless trading experience tailored to your needs, empowering you to navigate the market with confidence.
17 posts written
Born in Athens, Ariadne Petrou is a leading expert in behavioral finance, exploring the psychological factors that influence trading decisions and market dynamics.
Read Articles
Learn how the harami candlestick pattern signals potential market reversals. This guide breaks down...
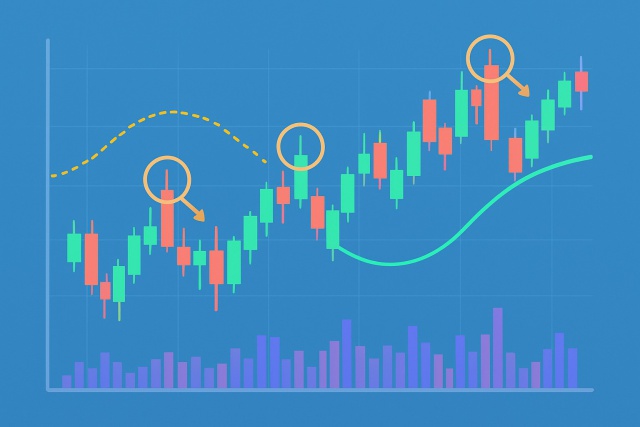
Discover the doji candlestick—a powerful price action signal revealing market indecision. This begin...
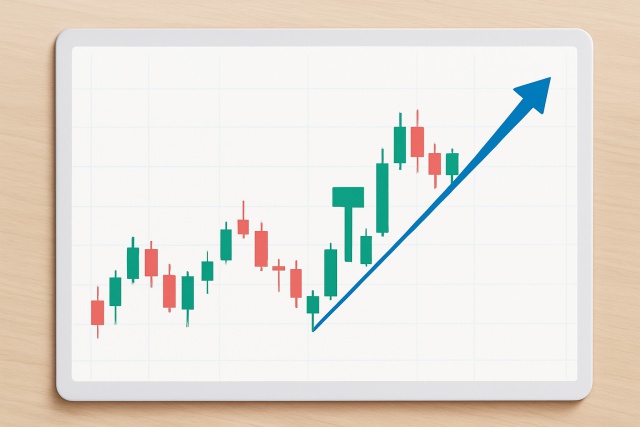
Master the hammer candlestick pattern—a key indicator for market reversals. This beginner-friendly g...
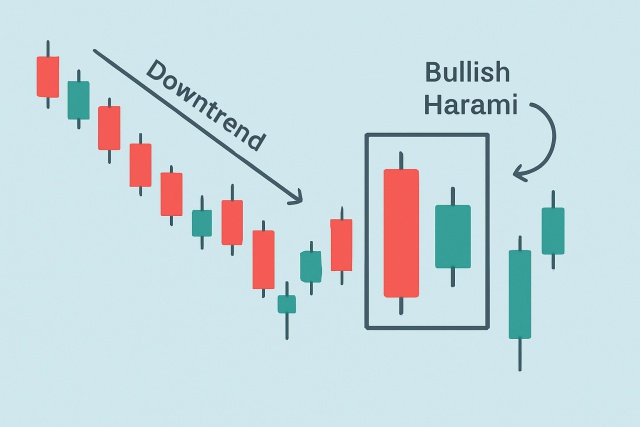
Discover the bullish harami candlestick pattern—a key technical signal that can hint at trend revers...
