


Technical Analysis
How to Spot a Hammer Candlestick in Trading Charts
Master the hammer candlestick pattern—a key indicator for market reversals. This beginner-friendly g...

The morning star pattern is a popular candlestick formation that traders often lean on when they are hunting for signs of a trend reversal. You will most commonly spot it popping up at the tail end of a downtrend, waving a flag that bearish momentum might be running out of steam and that the bulls are gearing up to take the reins. This pattern is made up of three candles, which together tell a little story of selling pressure easing off and fresh buying interest stepping onto the scene.
Before we jump headfirst into the morning star pattern, it’s worth taking a moment to get cozy with what candlestick charts actually are and how they visually display price information. These charts feature individual candlesticks that capture price movements over a set period.
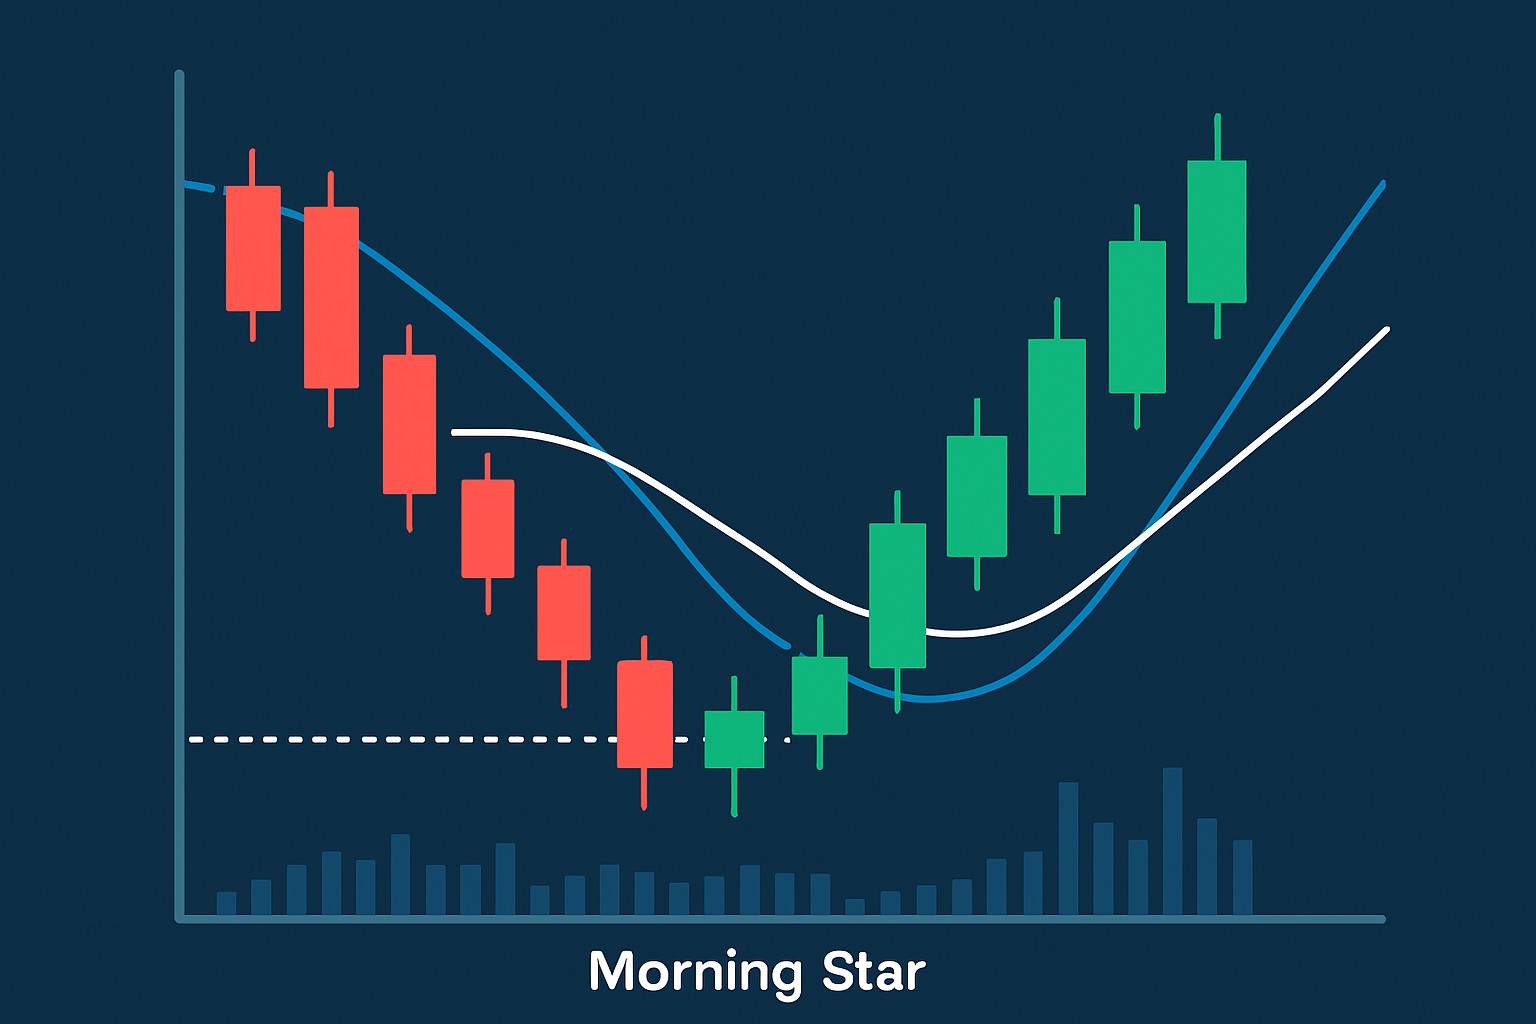
The morning star pattern is a formation of three candlesticks that often signals the start of a bullish trend after a downtrend. Think of it like a star climbing up at dawn. It hints at a brief breather from selling and a shift toward buying. You usually spot this pattern near market lows and it suggests the bears might be losing their hold or slipping up.
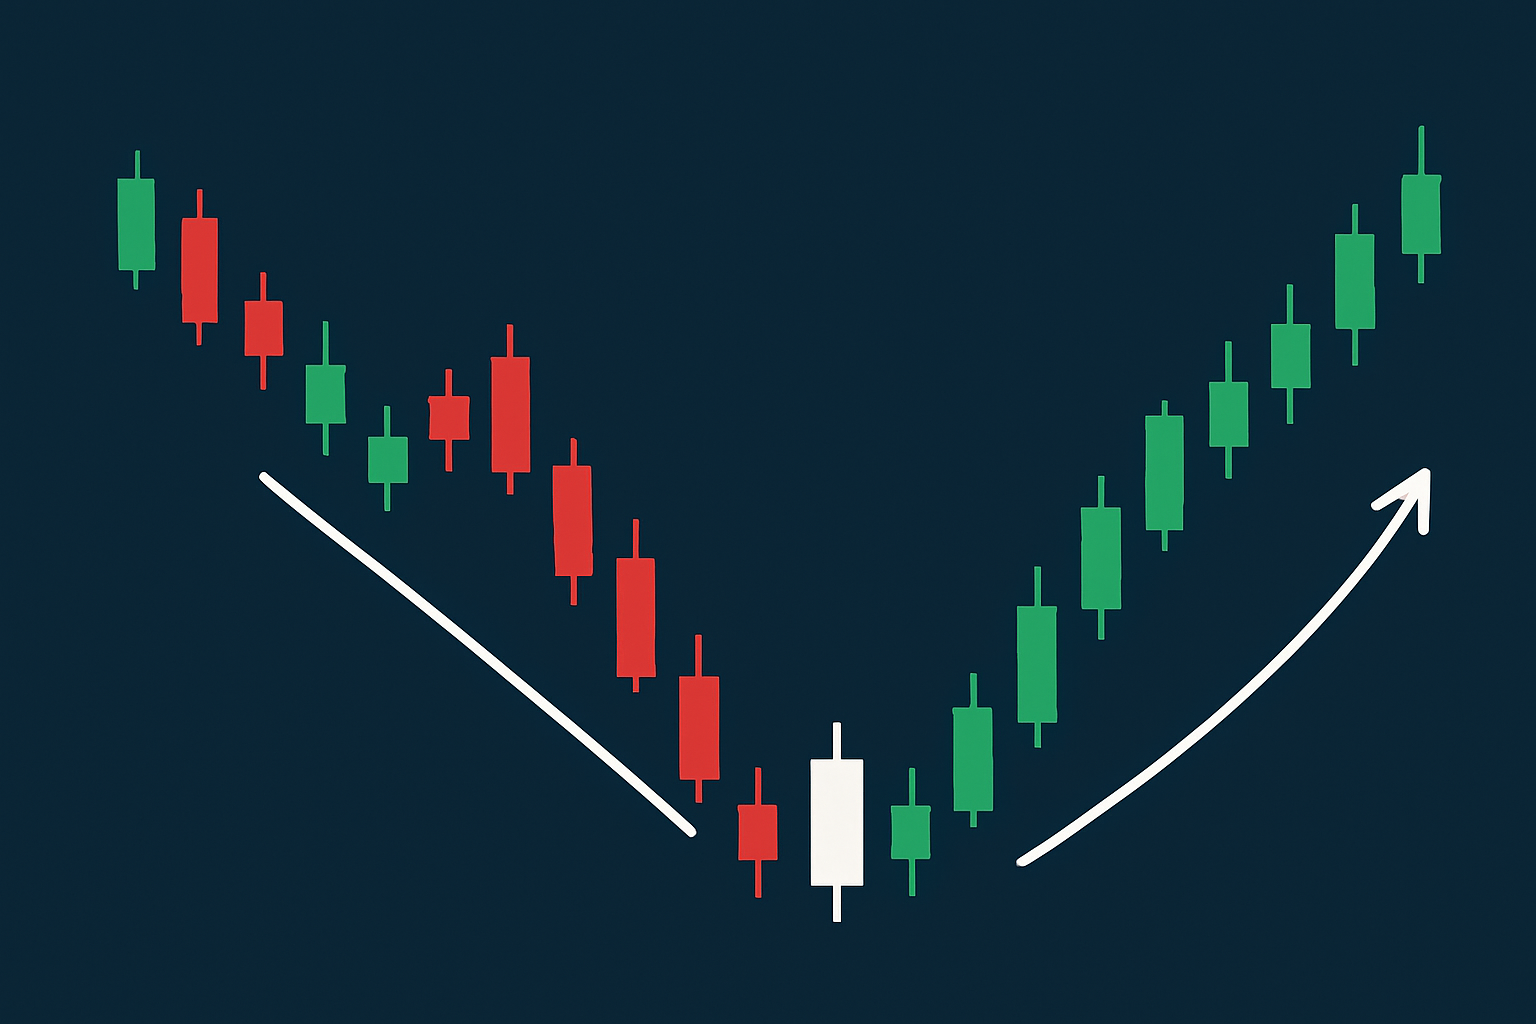
Diagram of the morning star pattern showing its three key candlesticks and the bullish reversal signal
This pattern really matters because it signals a shift in market sentiment, moving from bearish to bullish territory. The morning star captures that tug-of-war where sellers are starting to lose their grip while buyers quietly gain confidence.
The morning star pattern is like that first glimmer of dawn breaking through after a rough night of heavy selling, suggesting buyers are quietly stepping up to the plate and that a fresh chapter might just be unfolding for the price trend.
Spotting a genuine morning star pattern requires more than just a quick glance at the price movements. You need to pay close attention and confirm that a few key features are ticked off.
Make absolutely sure the market is clearly in a downtrend before the pattern even kicks in. This shows the bearish vibes have already taken hold.
Keep an eye out for a strong bearish candle with a hefty body since this usually means the sellers really had their day.
Spot the second candle sporting a small body or a doji. This hints at some hesitation and possibly a brief breather from all the selling pressure.
Watch for a gap down on that second candle followed by a gap up on the third one because this combo really cranks up the chances we’re looking at a reversal.
Make sure the third candle is a big, bold bullish candle that closes well above the midpoint of the first candle. Bonus points if it’s backed by stronger-than-usual trading volume because volume rarely lies.
The morning star pattern can be a bit of a shape-shifter, changing depending on the market and the asset at hand. It’s easy for traders to mix it up with similar patterns or overlook key volume details that really tell the story.
Many traders swear by the morning star pattern as a trusty addition to their toolkit, especially when it comes to timing entries and exits more precisely. Paired with other technical indicators and tools, it usually gives a nice confidence boost before pulling the trigger on an investment.
Make sure the morning star pattern shows up clearly within a steady downtrend because this really helps reduce false signals.
Hold your horses and wait for the third candle to close completely before making a move. This way you’re less likely to jump the gun during wild volatile swings.
Go ahead and enter a long position right after that bullish confirmation candle finishes.
Place a stop-loss just below the lowest point of the three-candle pattern to keep your downside risk in check. It is better to be safe than sorry.
It’s often a good idea to pair the pattern with momentum indicators like RSI or MACD to double-check that buying pressure is really picking up before you dive in.
The morning star is a handy signal though it’s not foolproof by any means. You’ll often see false signals cropping up especially when the market is doing the sideways shuffle or volumes are running low. That’s why it’s smart to pair it with other analysis techniques rather than putting all your eggs in one basket.
The morning star pattern is one of several bullish reversal candlestick patterns that traders watch. Patterns like the bullish engulfing, hammer and piercing line each bring their own unique perks to the table.
| Pattern Name | Number of Candles | Signal Strength | Typical Location | Key Characteristics | Ideal Confirmation |
|---|---|---|---|---|---|
| Morning Star | 3 | Strong | Bottom of downtrend | Starts with a big bearish candle, then a tiny indecision candle that leaves you guessing, and finally a confident bullish candle that really grabs attention | Look for a volume boost and a confirming gap to seal the deal |
| Bullish Engulfing | 2 | Moderate to Strong | Bottom of downtrend | A bullish candle that swallows the previous bearish candle whole, signaling a possible turnaround | Keep an eye on rising RSI and MACD momentum for extra conviction |
| Hammer | 1 | Moderate | Bottom of downtrend | A small body topped with a long lower wick, telling the tale of sellers pushed back and buyers stepping in | Best when paired with high trading volume and a thumbs-up from the trend confirmation |
| Piercing Line | 2 | Moderate | Bottom of downtrend | This one’s interesting: a bullish candle that dives below the last bearish close at the open but climbs back to close above its midpoint | Volume picking up and support holding steady usually does the trick |

Tired of missing opportunities and making suboptimal trading decisions? TrendSpider's cutting-edge platform automates complex technical analysis, saving you time and reducing human error.
With multi-timeframe analysis, dynamic alerts, backtesting, and customizable charting, you'll gain a competitive edge in identifying trends and making informed trades across global markets.

19 posts written
Master the hammer candlestick pattern—a key indicator for market reversals. This beginner-friendly g...

Discover the bullish harami candlestick pattern—a key technical signal that can hint at trend revers...

Learn how the harami candlestick pattern signals potential market reversals. This guide breaks down...

Unlock the power of the head and shoulders pattern with this complete guide. Learn to spot, trade, a...