


Technical Analysis
Most Important Candle Patterns Every Trader Should Know
Unlock the power of candle patterns to decode market psychology and improve your trading precision....

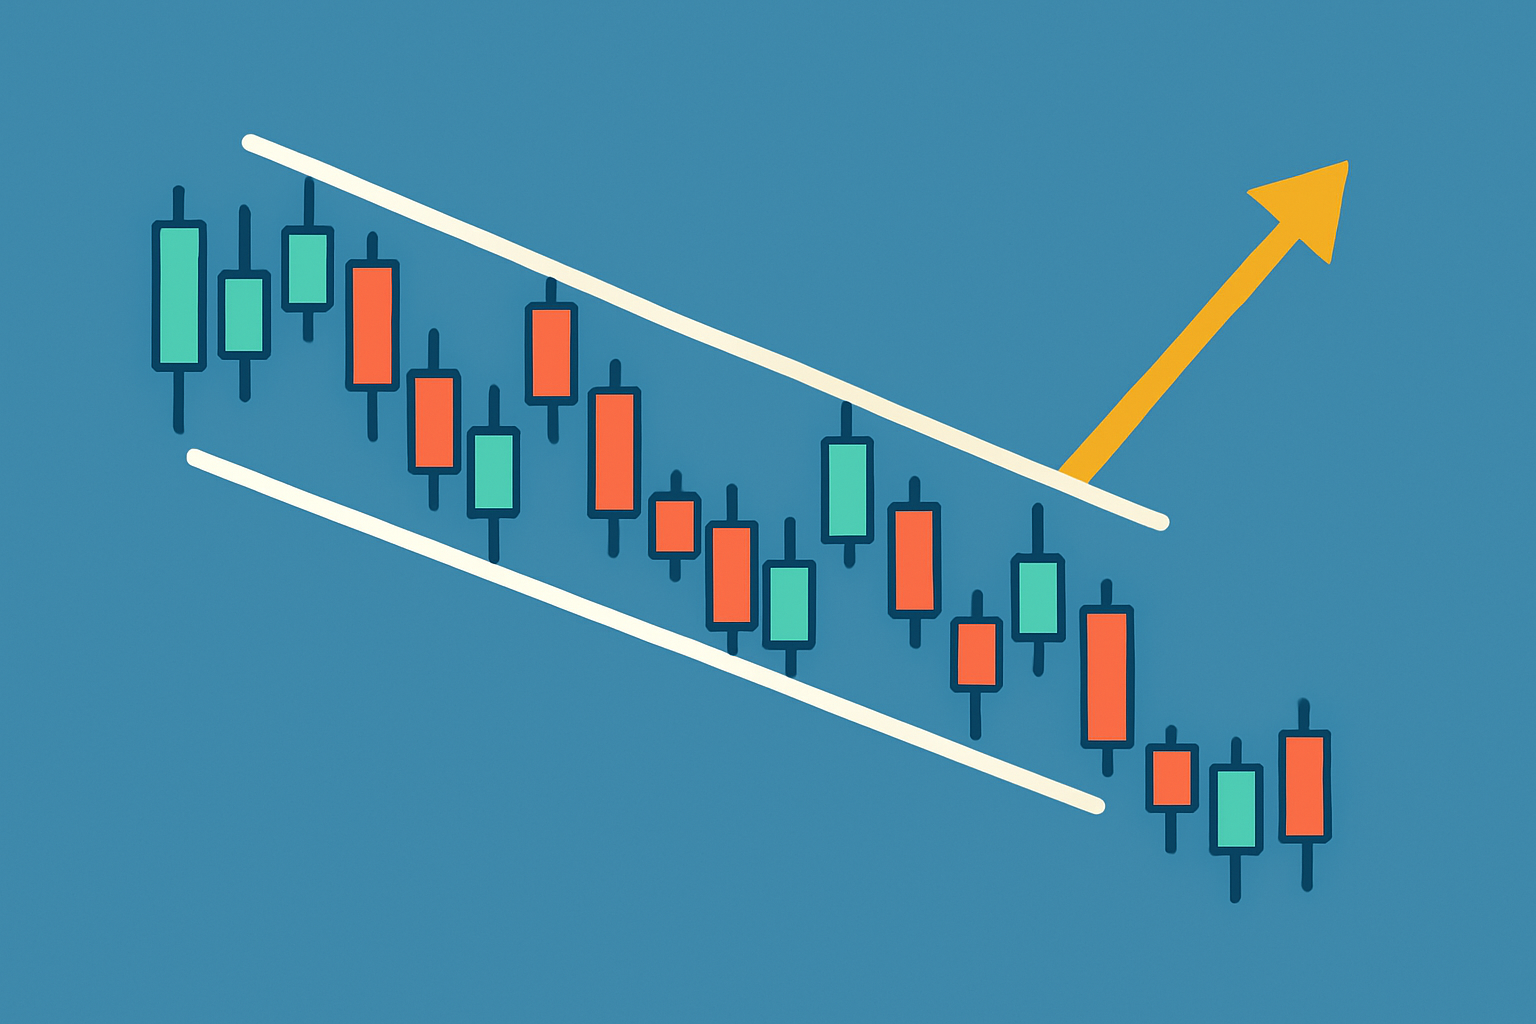
The falling wedge pattern is a pretty interesting formation in technical analysis that often signals a bullish reversal or continuation after a downtrend. You’ll spot it by two downward sloping trendlines that gradually squeeze together. This pattern tends to give traders a useful heads-up about potential price breakouts that can ignite some serious upward momentum.
Chart patterns are those intriguing shapes formed by price movements that savvy traders use to get a leg up on what might come next, like spotting a possible trend reversal or continuation before it happens.
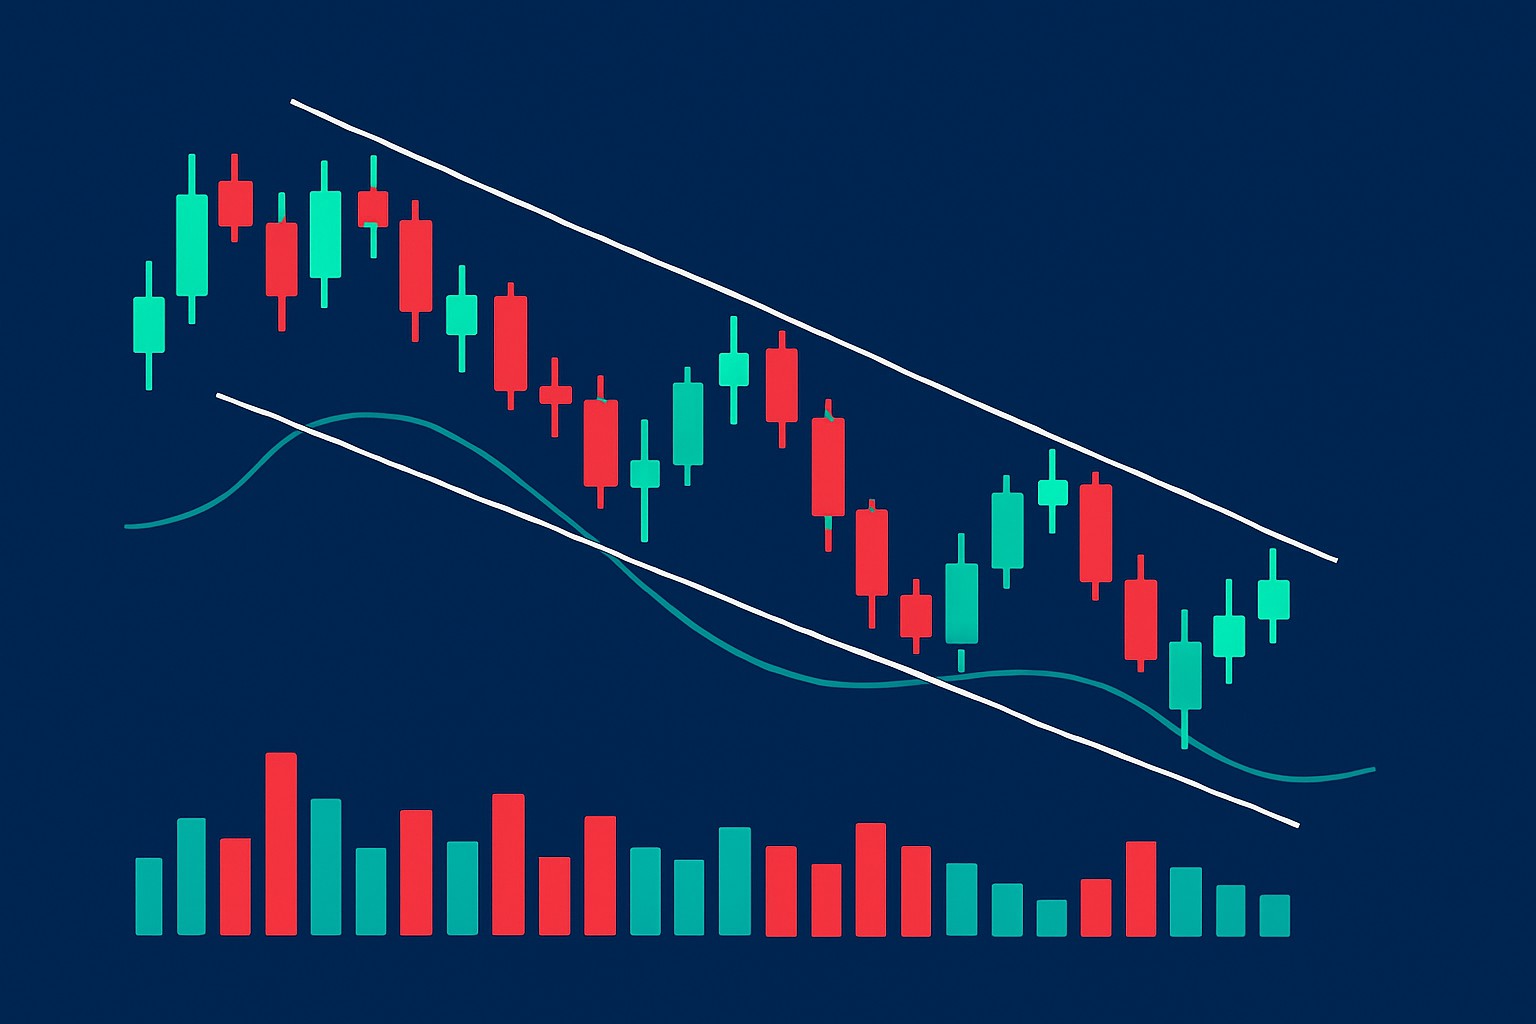
The falling wedge pattern shows up when price action creates two downward-sloping trendlines that slowly squeeze together with the upper line acting as resistance and the lower line holding support. Unlike descending triangles that have a flat support line, falling wedges have both lines sliding down toward each other like they are on a slow-motion collision course. You usually see this pattern during a downtrend or a quiet consolidation phase.
The falling wedge often signals a subtle change in market mood. Sellers gradually lose steam and show less enthusiasm for pushing prices lower while buyers cautiously begin to inch their way in.
Visual example of a falling wedge pattern showing converging trendlines and breakout on a candlestick chart
Start by identifying a clear downtrend or slow consolidation where prices gently move downward.
Draw two trendlines: one connecting the lower highs and the other tracing the lower lows. Make sure both slope downward and eventually meet.
Watch volume patterns carefully. Usually volume decreases as the wedge forms, suggesting the selling pressure is fading.
Look closely for a breakout above the upper resistance trendline because this often signals the bulls are ready to take control.
Before entering, confirm the breakout by checking for a volume spike and steady price action above the resistance line. Be sure before placing your bet.
Taking a peek at different timeframes and chart styles can do wonders for sharpening your accuracy. Candlestick charts with their detailed price moves and reversal hints really bring the action to life. Bar or line charts provide a cleaner no-nonsense look at the overall trend.
One common pitfall traders often fall into is jumping the gun on a wedge breakout before volume steps up or the price clearly closes above resistance. Misinterpreting patterns with uneven trendlines or glossing over the bigger market picture tends to throw up false signals and losses.
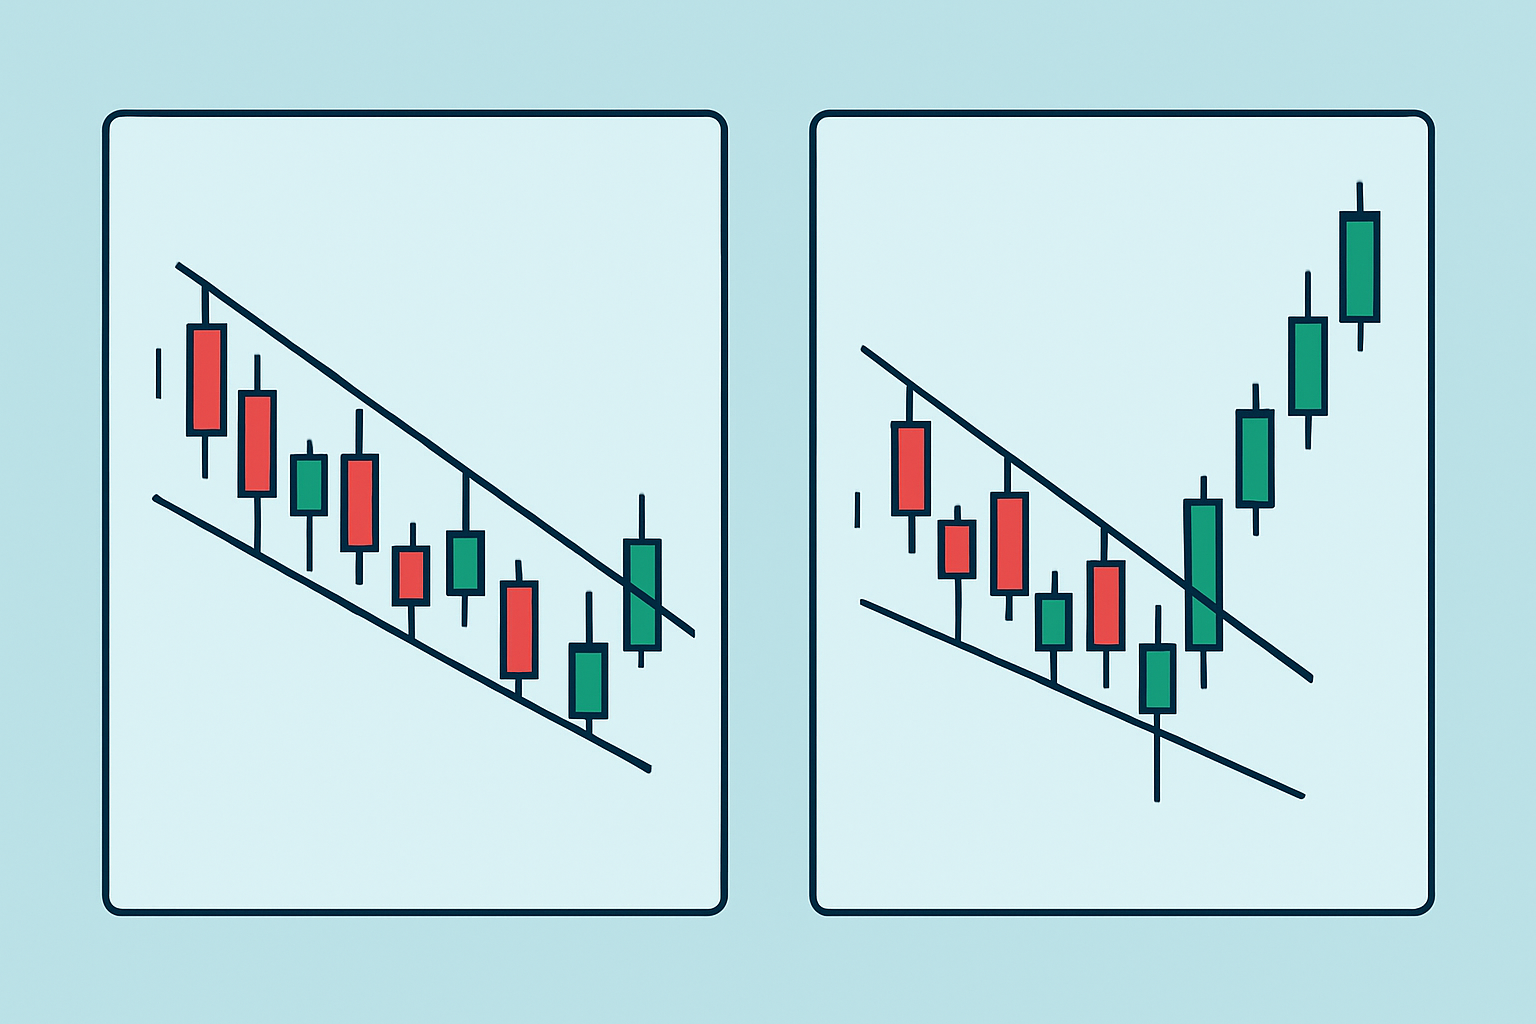
Examples contrasting a false breakout and a real bullish breakout from a falling wedge pattern
A few tried-and-true technical indicators often pair nicely with the falling wedge pattern to give traders that little extra boost of confidence. Keeping an eye on volume is a smart move—it can reveal weakening momentum and really help confirm if a breakout is for real. Momentum oscillators like the RSI often light up with bullish divergences just when you need them, while MACD crossovers have a knack for flagging shifts in momentum early on.
Tossing these indicators into your analysis routine offers an extra layer of confirmation that usually helps weed out false signals. It bumps up your odds of landing trades with a better shot at success.
Real-world examples across different asset classes like stocks, forex and cryptocurrencies bring the falling wedge pattern to life in various market environments. Each example highlights key trendlines and shifts in volume along with all-important breakout moments. Handy notes help you recognize these patterns.
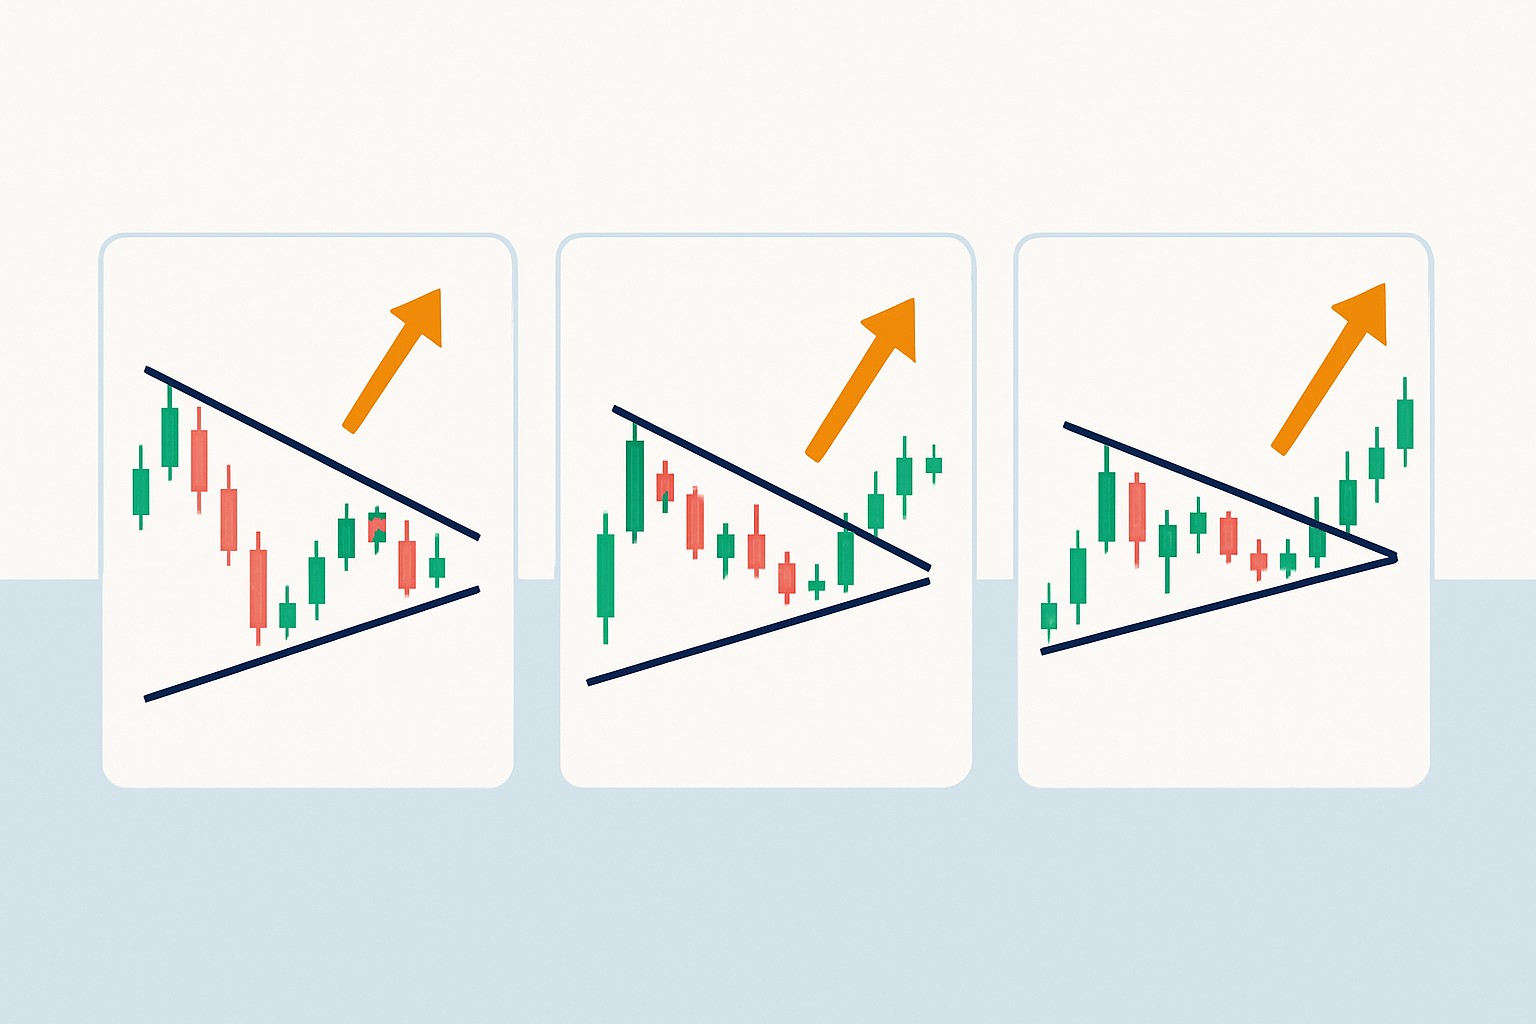
Multiple annotated real market charts displaying falling wedge pattern formations and breakout points
Spot the converging trendlines and notice that the volume usually takes a little nap and shrinks as the pattern forms. Then just when you are starting to wonder if it’ll actually happen, watch for the breakout above resistance that is confirmed by steady price movement and rising volume.
When it comes to trading a falling wedge effectively, it is best to hold your horses until the price actually breaks above the upper resistance trendline and closes firmly beyond it before making a move. Set your stop loss just a hair below the wedge's lowest point—that way, you are managing risk without sweating bullets. For profit targets, a handy trick is to measure the widest part of the wedge and then project that distance upward from the breakout point.
Volume often steps into the spotlight when confirming whether a breakout is real. When you see volume ramping up during a breakout it usually means the odds of a false signal are falling. It’s wise to hang back and wait for a few more green lights—steady price movement, supportive indicator signals and sometimes a retest of the breakout level—before jumping all in on a trade.
Using the falling wedge pattern alongside other technical and fundamental analysis generally makes trading more dependable. For example, pairing the pattern with fundamental news or earnings reports often adds valuable context to price swings. In my experience, this boosts confidence when making trades. It’s also smart to use tools like moving averages or trend strength indicators to get a clearer read on the trend’s direction.
Spotting falling wedge patterns can be quite the challenge because drawing trendlines is not an exact science—it often involves guesswork. It’s also not easy to separate genuine breakouts from false alarms that sneak in. These patterns often appear with others like descending triangles, which adds confusion. Traders often find themselves scratching their heads trying to figure out where the lines meet and if a breakout is worth betting on.
Mastering the nuances of the falling wedge pattern really calls for consistent practice and patience. Keeping a detailed trade journal where you jot down your observations, setups and results can fast-track your pattern recognition skills over time. Tools like TradingView’s advanced charting or TrendSpider’s AI-driven pattern detection add a nice analytical edge and make the process less daunting.

Struggling to improve your trading performance? Edgewonk's advanced analytics tools are designed to give you the edge you need.
With detailed trade journaling, robust strategy analysis, and psychological insights, you'll gain a comprehensive understanding of your strengths and weaknesses. Don't miss out on this game-changing opportunity.

23 posts written
Unlock the power of candle patterns to decode market psychology and improve your trading precision....

Discover the doji candlestick—a powerful price action signal revealing market indecision. This begin...

Learn how the harami candlestick pattern signals potential market reversals. This guide breaks down...

Master the hammer candlestick pattern—a key indicator for market reversals. This beginner-friendly g...