


Technical Analysis
Understanding the Bullish Harami Candlestick Pattern
Discover the bullish harami candlestick pattern—a key technical signal that can hint at trend revers...

This guide is crafted to help traders make better use of reversal candlestick patterns so you can more confidently anticipate when the market is about to switch gears.
Reversal candlestick patterns are like the seasoned storytellers of technical analysis, quietly signaling when the market might be about to change its tune.
Candlestick charts lay out price changes over specific time frames with each little candlestick revealing the open, close, high and low prices. Compared to your run-of-the-mill line charts this format offers a richer and more detailed glimpse into price action.
Reversal candlestick patterns hint at a potential change in the ongoing market trend, standing apart from continuation patterns that suggest the current trend could just keep trucking along.
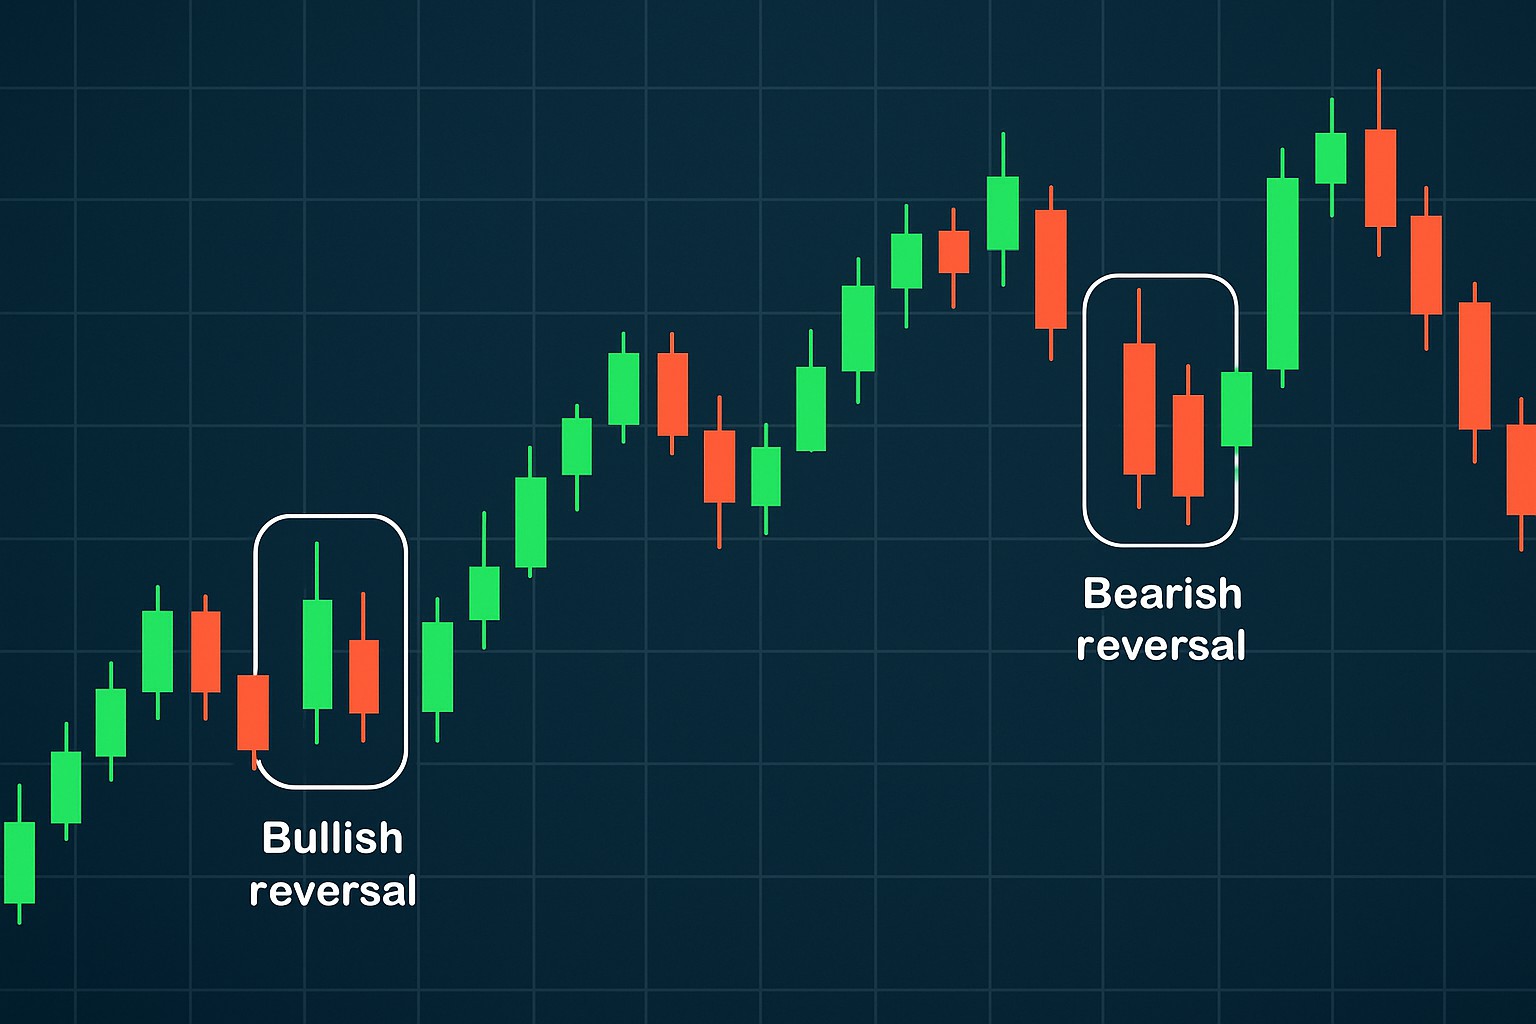
Example of reversal candlestick patterns appearing on a candlestick chart, illustrating their typical formation and placement within market trends.
Bullish reversal patterns often signal that the selling pressure is finally starting to take a breather, with upward momentum quietly gathering steam.
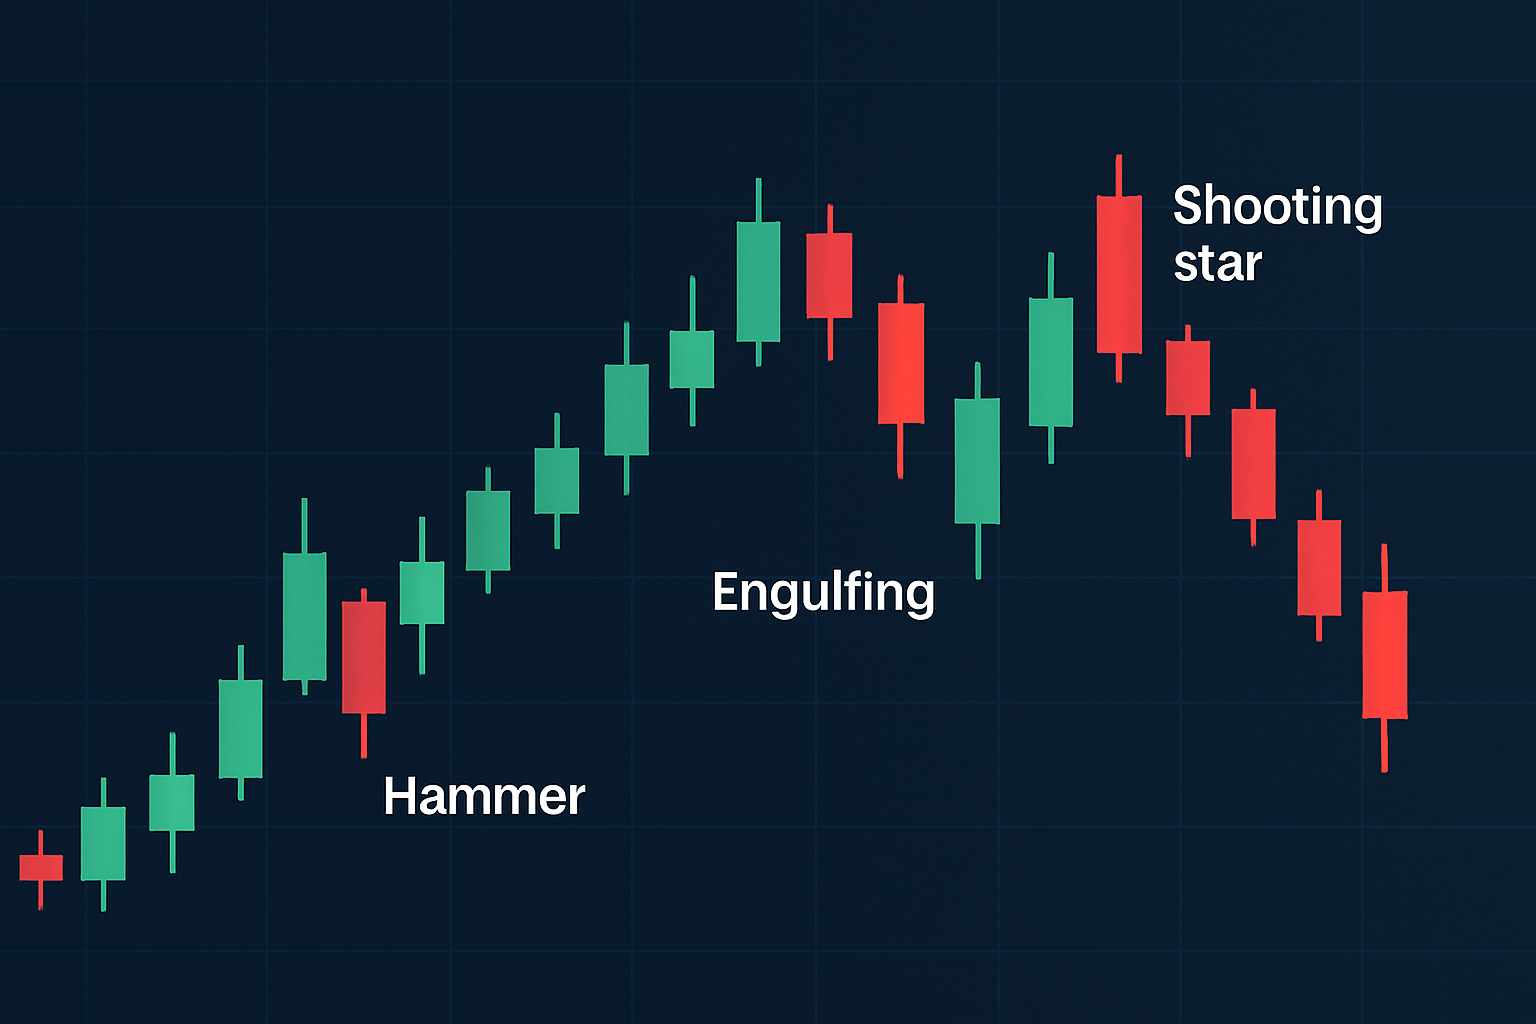
Hammer: Features a small body with a long lower shadow hinting that buyers are firmly pushing back against lower prices—kind of like saying “Not today bear market.”
Inverted Hammer: This one pops up with a small body and a long upper shadow. It usually shows up at the bottom of a downtrend as if the market’s testing the waters before deciding to swim up.
Bullish Engulfing: Picture a big confident bullish candle that completely swallows the previous bearish candle. It’s like one day saying to the last, “I’ve got this.”
Piercing Line: A bullish candle opens below the prior close but rallies hard to close above the midpoint of that candle—talk about making a comeback within a single session.
Morning Star: A charming three-candle pattern signaling a solid reversal after a downtrend. It starts with a gap down, followed by a humble little candle, and wraps up with a bullish close that feels like the market’s morning coffee kick.
| Pattern Name | Visual Characteristics | Market Context | Signal Strength | Typical Confirmation Methods |
|---|---|---|---|---|
| Hammer | Small real body with a long lower shadow and little or no upper shadow. This little guy often pops up after a sell-off, trying to catch support before the bounce | Shows up in downtrends, usually near support zones | Moderate | Often backed up by a spike in volume and a bullish close on the very next candle — a nice one-two punch |
| Inverted Hammer | Small body capped with a long upper shadow, typically making its appearance after a downtrend. It’s the market’s way of poking the bears before the bulls step in | Found in downtrends, signaling a possible bottom | Moderate | Look for a follow-up bullish candle accompanied by rising volume to really trust this signal |
| Bullish Engulfing | A big bullish candle that swallows the previous bearish candle whole. Think of it as the bulls stamping their authority after a downtrend | Seen during downtrends | Strong | Usually gets a thumbs-up from a volume surge and RSI divergence, making the reversal more credible |
| Piercing Line | A bullish candle that opens with a gap down below the previous candle but then rallies to close above its midpoint. Classic sign that buyers are stepping in with some gusto | Occurs in downtrends near support levels | Strong | Often gains confirmation from a bullish MACD crossover paired with increased volume — a solid combo |
| Morning Star | A charming trio of candles: first bearish, then a small or neutral candle, and finally a bullish one. It often feels like the market’s way of saying, "Okay, time for a change!" | Indicates a strong reversal at support levels | Very strong | Confirmation usually involves a trendline break plus a pickup in volume, giving you that extra nudge of confidence |
To nail down bullish reversal patterns, it’s a good idea to look for volume spikes that hint at genuine buying interest—not just some fleeting blip. Indicators like RSI showing bullish divergence or an MACD crossover tend to boost your confidence quite a bit. And when these line up neatly with key support levels or moving averages, the signals usually feel a lot more trustworthy.
Bearish reversal patterns often show up as little warning flags, hinting at a possible price drop and a change in direction from an uptrend to a downtrend.
Shooting Star A small body with a long upper shadow that often appears near the peak of an uptrend like a warning flare in the sky.
Bearish Engulfing A big bearish candle that swallows the previous bullish candle and signals strong selling pressure.
Evening Star A three-candle setup that tells a story of decline starting with a tiny uncertain candle near the top.
Dark Cloud Cover A bearish candle that opens above the prior high but closes below the midpoint of the earlier bullish candle — a clear mood shift.
Hanging Man Resembling a hammer and appearing after an uptrend, this pattern signals a reversal might be near.
| Pattern Name | Key Features | Trading Environment | Reliability | Recommended Confirmation Techniques |
|---|---|---|---|---|
| Shooting Star | Small body with a long upper wick near a high price area, like a little flag waving at the peak | Near the peak of an uptrend | Moderate | Keep an eye out for rising volume and signs that RSI or MACD might be losing steam |
| Bearish Engulfing | Large bearish candle swallowing the previous bullish candle whole—quite the mood changer | During an uptrend | Strong | Best to confirm with volume spikes and clear signals of a trend reversal |
| Evening Star | A trilogy of candles: bullish, then a small or indecisive one, followed by a bearish finale | At the top of an uptrend | Very strong | RSI showing overbought conditions plus a drop in volume usually seals the deal |
| Dark Cloud Cover | Bearish candle opening above the prior high but closing below the midpoint—like a cloud casting a shadow | At resistance in an uptrend | Strong | Confirm this with shifts in volume and momentum indicators for added certainty |
| Hanging Man | Small body with a long lower shadow hanging out after an uptrend, hinting at a potential twist | During an uptrend | Moderate | Watch closely for a bearish follow-up candle to back up the warning |
Be careful not to get led astray by false bearish signals—they can be sneaky little things. It pays off to double-check patterns with volume, especially noticing when it dips during an uptrend and then picks up as selling pressure builds. Momentum indicators like MACD and RSI often give you a heads-up when bullish strength is quietly slipping away. Zoom out and take in the bigger market picture too, including those all-important support and resistance levels along with trendlines.
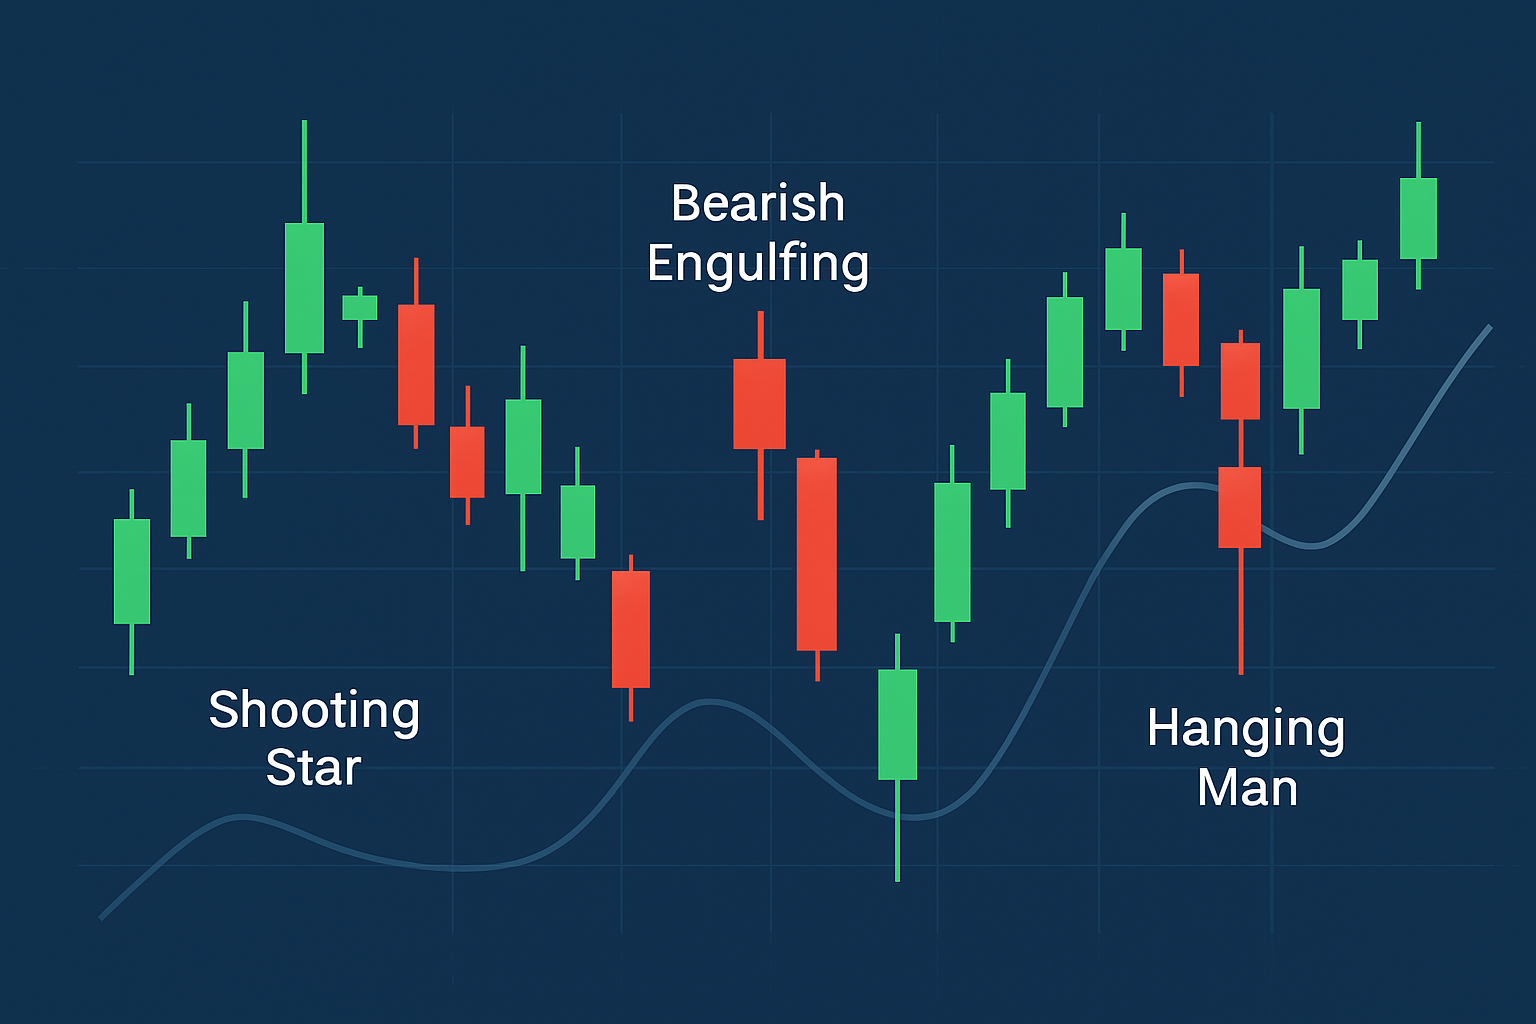
Visual representation of common bearish reversal candlestick patterns appearing at the top of an uptrend on a trading chart.
Spotting reversal candlestick patterns means you’ve got to really keep your eyes peeled, scanning those charts closely while always bearing in mind the bigger picture the overall market context and timing.
Pick timeframes that truly match your trading style—I’ve found that higher timeframes often serve up more reliable signals, almost like they’ve done their homework beforehand.
Scout out strong support and resistance zones where prices usually like to take a breather or change direction.
Keep an eye out for clusters of reversal patterns, or mix in other indicators to give your confidence that extra nudge.
Double-check those signals with volume and momentum tools like RSI or MACD to make sure you’re not jumping the gun.
Define clear entry and exit points, including realistic stop-loss and profit targets—tailored to just how convincing the pattern looks on your charts.
Common mistakes usually come down to focusing too much on single candles without stepping back to see the bigger picture or ignoring volume. Jumping the gun on early signals is another common error. These slip-ups often lead to false breakouts or whipsaws that can really throw you off.
Successful trading often boils down to patience and waiting until those signals shout loud and clear. Relying solely on single candlestick signals can easily lead to impulsive moves and, quite often, missed opportunities slipping right through your fingers.
If you have ever dabbled in trading, you know that spotting a turning point is like catching lightning in a bottle. Reversal candlestick patterns can serve as your trusty roadmap, hinting that the market might just be about to do a 180. Incorporating these patterns into your trading strategies is not just a neat trick—it's practically essential if you want to avoid getting caught on the wrong side of a move. Whether you’re a seasoned pro or just starting out, knowing when and how to use these signals can add that extra edge to your decisions.
Using reversal candlestick patterns alongside other technical tools can genuinely boost your decision-making and help you manage risks more effectively.
Spotting a bullish engulfing pattern alongside a rising MACD and support close to a moving average usually lights up a green flag for a potential long trade.
Reversal candlestick patterns can pack a punch but they’re far from perfect. Every so often, you’ll get fooled by false signals—usually thanks to market noise or thin volume playing tricks.
Recent advances in technical analysis have been leaning heavily on algorithmic scanning and some pretty clever AI-driven pattern recognition, all designed to up the ante on detection accuracy. Multi-timeframe analysis takes a closer look at patterns across different scales, which really helps separate the wheat from the chaff and avoid those pesky false signals - especially when identifying reversal candlestick patterns. Platforms like TrendSpider and TradingView cleverly blend these high-tech tools with good old-fashioned candlestick patterns, giving traders a noticeable edge.

An advanced trading interface displaying AI-driven recognition of reversal candlestick patterns across multiple timeframes.

Are you tired of juggling multiple tools for your trading needs? TradingView is the all-in-one platform that streamlines your analysis and decision-making.
With its powerful charting capabilities, real-time data, and vibrant community, TradingView empowers traders like you to stay ahead of the market. Join thousands who trust TradingView for their trading success.

20 posts written
Discover the bullish harami candlestick pattern—a key technical signal that can hint at trend revers...

Unlock the power of candle patterns to decode market psychology and improve your trading precision....

Discover what IOUs mean in finance, their role as informal debt acknowledgments, and how understandi...

Learn how the harami candlestick pattern signals potential market reversals. This guide breaks down...