


Technical Analysis
IOU Meaning in Finance
Discover what IOUs mean in finance, their role as informal debt acknowledgments, and how understandi...

The head and shoulder pattern is often hailed as one of the most trusty chart formations traders lean on to catch potential turning points in financial markets.
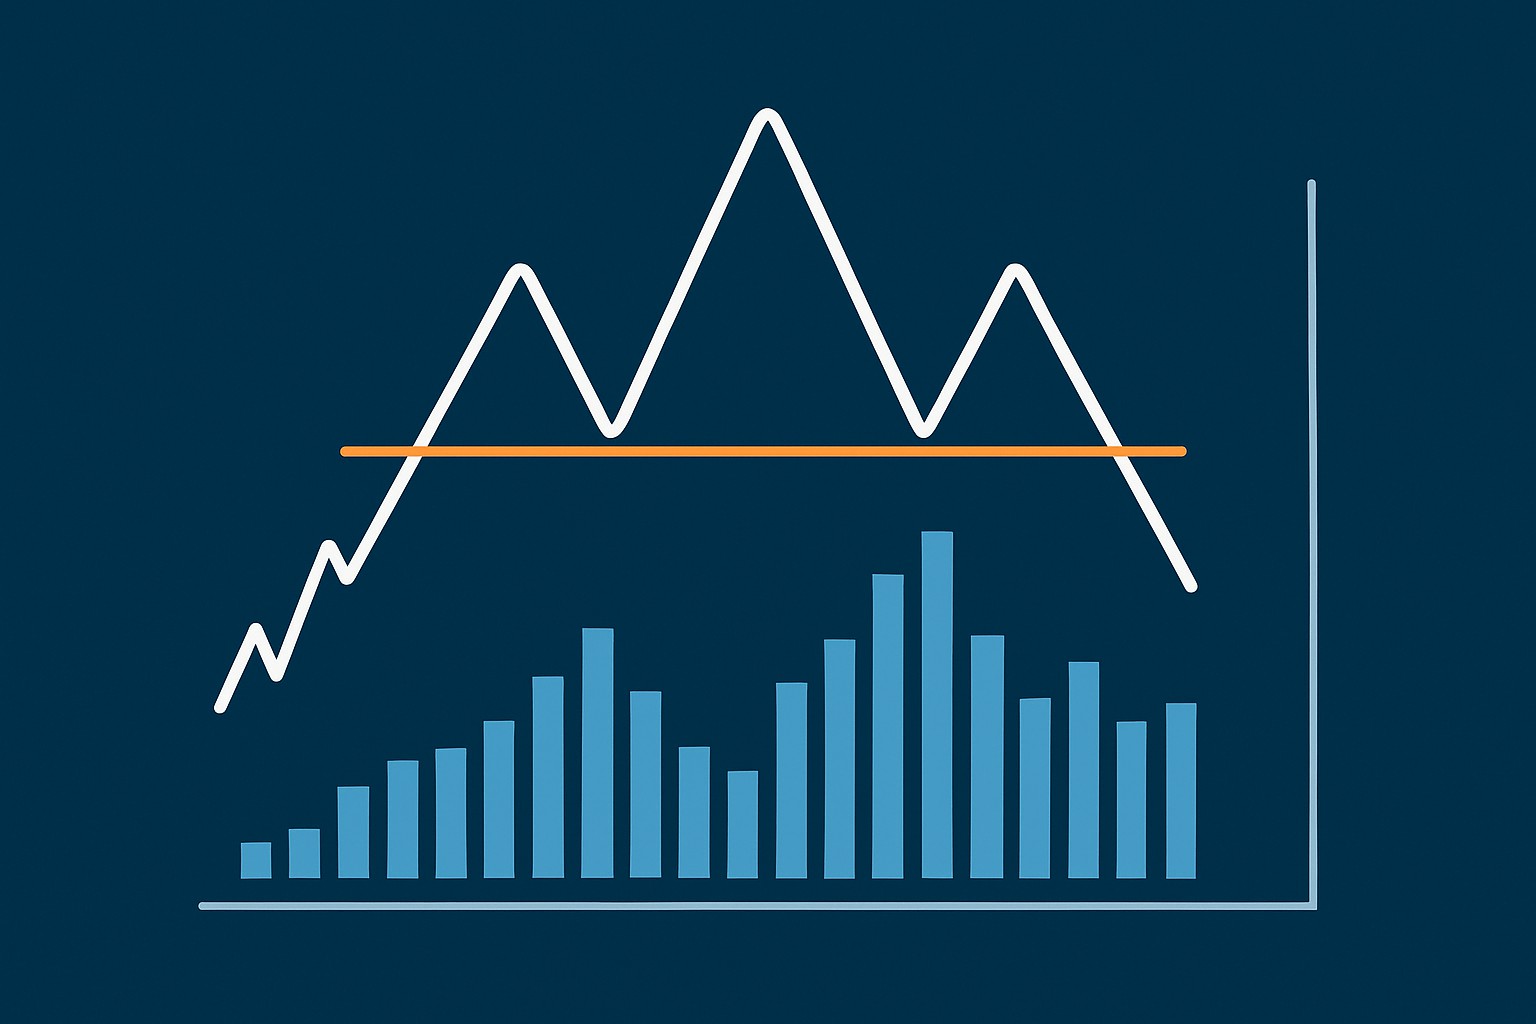
The head and shoulders pattern is a price chart formation that looks like a person's head flanked by two shoulders. It’s made up of three distinct peaks: the left shoulder, a taller peak called the head, and the right shoulder, which usually matches the left in height. Connecting the lows between these peaks is a line called the neckline. It plays a key role as a support level you don’t want to overlook.
The head and shoulders pattern is often viewed as a reliable hint that a trend might flip, usually signaling a shift from a bullish to a bearish market. Once the neckline gives way after the right shoulder forms it signals a drop in buying enthusiasm and an uptick in seller dominance. This can spark a noticeable price slide. This pattern captures investor psychology in a neat package. The left shoulder and head reflect an early burst of optimism. By the time the right shoulder rolls around resistance and profit-taking start to kick in, showing hesitation to push prices higher.
"The head and shoulders pattern shines a spotlight on a shift in momentum where buyers start to lose steam and sellers quietly step into the driver's seat."
Spotting a head and shoulders pattern is all about tuning into the highs and lows on a price chart with a keen eye. Traders look for three noticeable peaks, where the middle one—the head—really steals the show as the highest point. Getting the neckline right is important, and that means connecting the two valleys nestled between these peaks. Beginners often mistake everyday price wiggles for this pattern or miss out on the subtle but telling volume trends.
Keep an eye out for that initial peak forming the left shoulder followed by a noticeable dip.
Look for the taller peak known as the head. It marks the highest price point and is the star of the show.
Spot the third peak, the right shoulder, which usually appears around the same level as the left shoulder.
Draw the neckline by connecting the lows between these peaks. It could be straight or have a tilt.
Don’t forget to check the volume patterns. Volume often ramps up during the left shoulder and head but tails off on the right shoulder.
Hold tight and wait for the price to break below the neckline. That’s your green light confirming the pattern and hinting at a possible trend reversal.
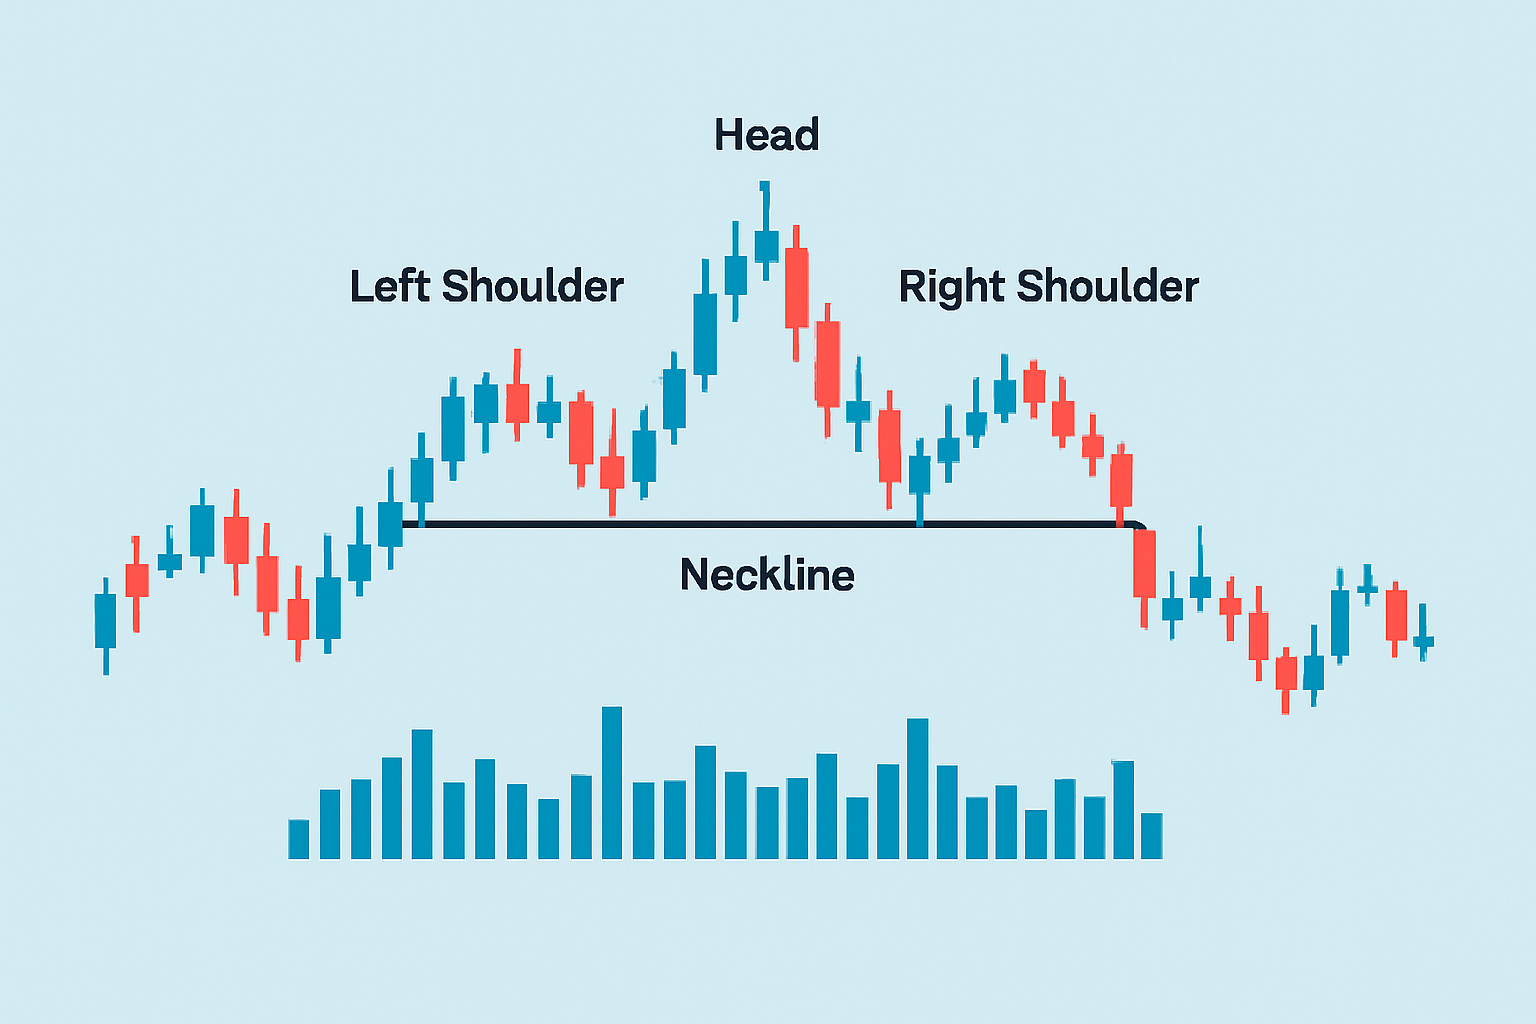
Illustration of a head and shoulders pattern on a price chart with labeled components and volume bars
Volume is absolutely important when confirming the head and shoulders pattern. You’ll typically notice a surge in volume during the formation of the left shoulder and the head which shows serious buying interest brewing. Then as the right shoulder takes shape, volume usually tapers off and hints that demand is starting to lose steam. A sharp spike in volume when the price breaks the neckline is a big deal because it confirms that sellers have seized the reins and makes the reversal signal much more trustworthy.
The inverse head and shoulders pattern is basically the regular one turned upside down, signaling a bullish reversal after a downtrend. The head marks the lowest dip in the action, flanked by shoulders that rise on each side. Every now and then, markets throw a curveball with more intricate shapes like triple head and shoulders or uneven shoulders that don’t quite line up perfectly.
A lot of traders especially those just starting out often fall into the trap of seeing head and shoulders patterns in what are really just random price swings. This leads them to jump the gun or make shaky trading decisions. Ignoring volume trends or relying solely on symmetrical price action without stepping back to see the full picture tends to trip people up with false signals. The real magic happens when you combine pattern recognition with other technical indicators and practice patience, waiting for solid confirmation before diving into trades.
Traders often lean on the head and shoulders pattern to pinpoint entry points, stop-loss levels and profit targets—it’s their go-to playbook. The clearest entry usually shows up when the price breaks below the neckline with real volume behind it, giving it extra confidence. Typically stop-loss orders get tucked just above the opposite shoulder. This is a neat trick to keep risk from sneaking up on you. As for profit targets, they’re often figured out by measuring the distance from the head’s peak down to the neckline then projecting that distance from the breakout point—kind of like drawing a line in the sand.
Make sure the head and shoulders pattern is fully cooked—think clearly visible shoulders and a nicely defined neckline that you won’t mistake for anything else.
Jump into a sell trade once the price sneaks below that neckline. Timing is everything here.
Don’t forget to set a stop-loss just above the opposite shoulder—this little guardian angel helps keep your risk in check.
Measure the distance from the head down to the neckline, then project that same distance downward from the breakout point. It’s a bit like using a ruler but for money.
Eyeball other signals like volume spikes and the usual technical indicators to give your trade setup that much-needed thumbs up.
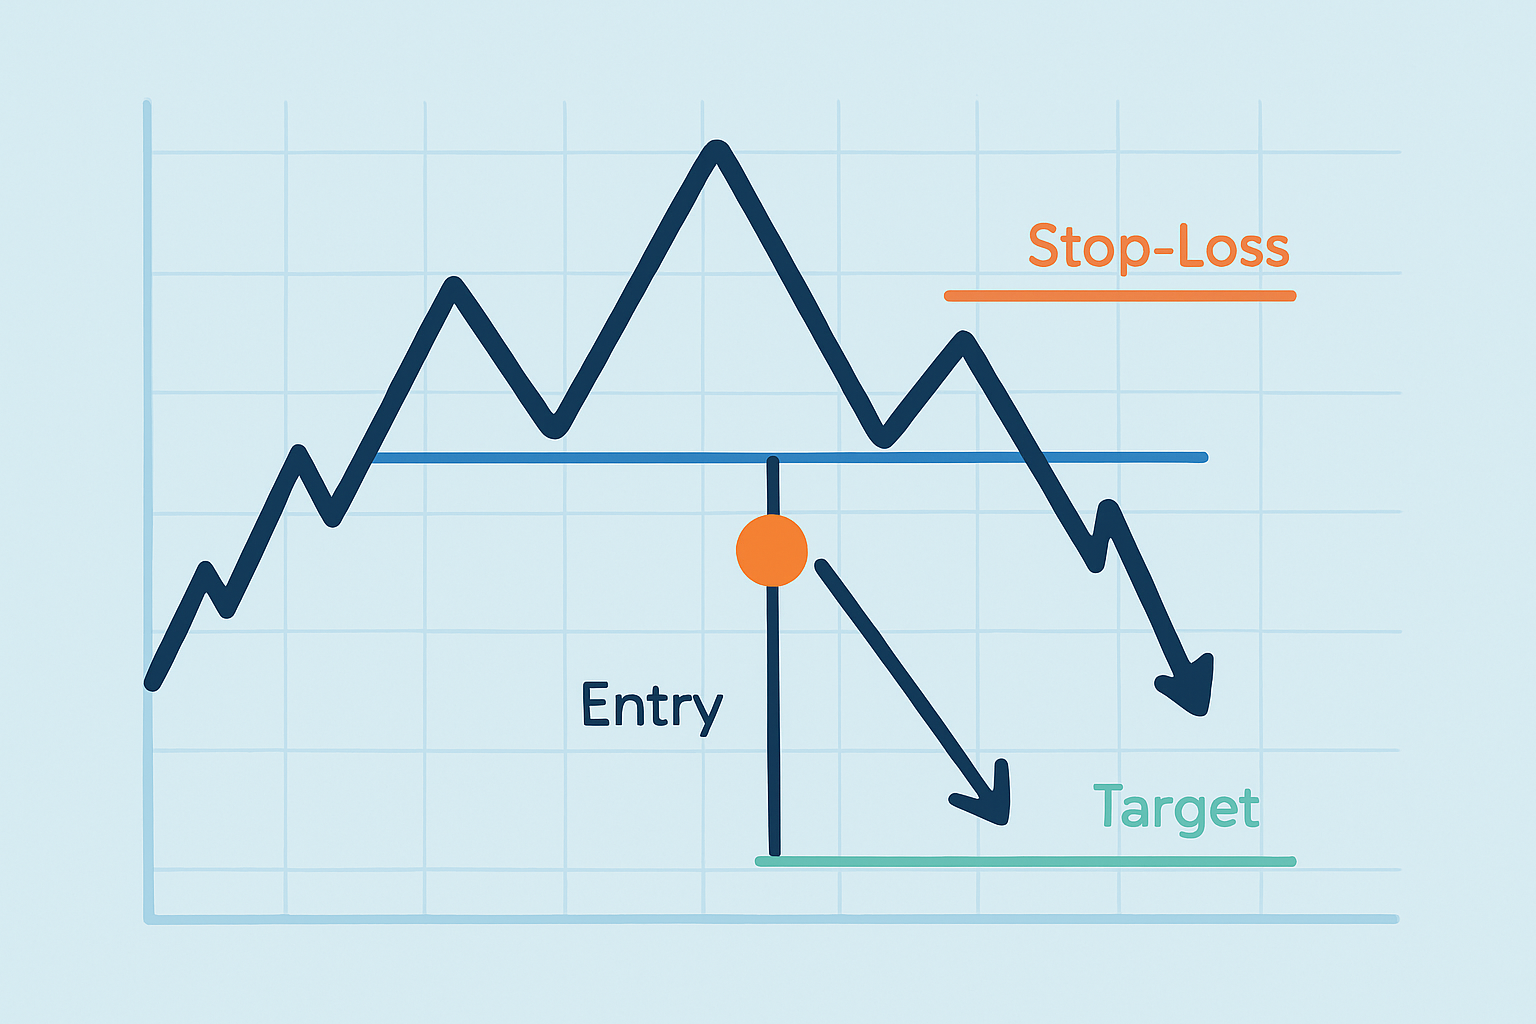
Example of trade setup using head and shoulders pattern showing entry, stop-loss, and target areas
Imagine a stock chart forming the classic head and shoulder pattern: the price first inches up to form a left shoulder around $50 then pushes higher to a peak of $55 creating the head. After that it dips back down to $52 before climbing once more to shape a right shoulder close to $50. The lows between these key points draw a neckline near $
You will often notice volume peaking during the initial climb then gradually fading as the right shoulder forms—kind of like the market catching its breath. When the price slips below $48 on stronger volume many traders jump in with short positions. They usually set a stop-loss just above the right shoulder and eye profit targets based on the $7 gap between the head and neckline.
| Pattern Element | Price Level | Volume Change | Trade Action | Result |
|---|---|---|---|---|
| Left Shoulder | $50 | High | Not applicable | Sets up the opening peak, kind of the starter pistol for the pattern |
| Head | $55 | Very High | Not applicable | Hits the highest point, stealing the spotlight for a moment |
| Right Shoulder | $50 | Lower | Keep an eye out for a drop below the neckline | Seals the deal on the pattern’s shape |
| Neckline | $48 | Moderate | Jump in if price dips below neckline | The go-to entry zone, where things get interesting |
| Stop-loss | $51 (just above right shoulder) | Not applicable | Keeps risk in check | A safety net to help avoid nasty surprises |
| Target Price | $41 (calculated as neckline minus head-neckline distance) | Not applicable | Time to exit or pocket those profits | Wraps up the trade on a high note |

Tired of missing opportunities and making suboptimal trading decisions? TrendSpider's cutting-edge platform automates complex technical analysis, saving you time and reducing human error.
With multi-timeframe analysis, dynamic alerts, backtesting, and customizable charting, you'll gain a competitive edge in identifying trends and making informed trades across global markets.

14 posts written
Discover what IOUs mean in finance, their role as informal debt acknowledgments, and how understandi...

Unlock the power of candle patterns to decode market psychology and improve your trading precision....

Discover the bullish harami candlestick pattern—a key technical signal that can hint at trend revers...

Unlock the power of the bear flag pattern with our practical, step-by-step guide. Understand market...