


Technical Analysis
Master the Bear Flag Setup
Unlock the power of the bear flag pattern with our practical, step-by-step guide. Understand market...

The bearish harami is a classic candlestick pattern that often signals a potential flip from an upward to a downward trend.
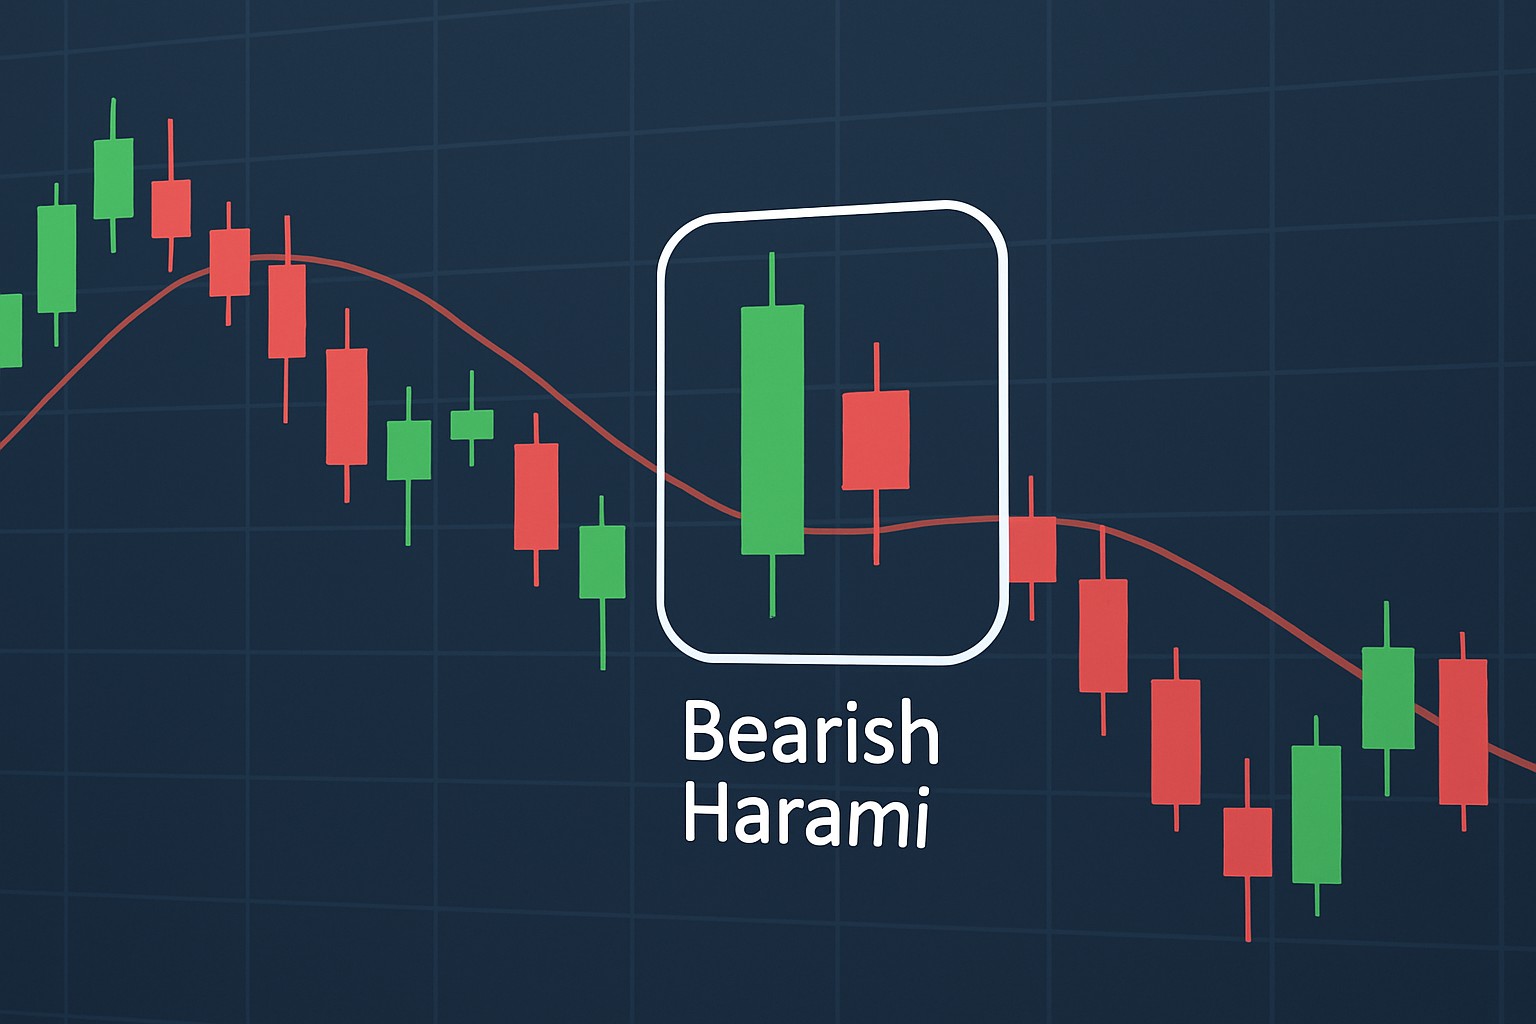
The bearish harami is a candlestick pattern made up of two candles. You have a big, bullish candle that really shows strong buying enthusiasm. Then comes a smaller bearish candle, snugly fitting within the body of the previous one like it’s trying not to steal the spotlight.
The bearish harami often feels like a caution flag waving gently on the trading floor. After a robust upward rally, this smaller bearish candle quietly whispers that buying enthusiasm might be running out of steam
Spotting the bearish harami on your charts takes a keen eye—you have to pay close attention to the candles and the bigger market picture. Ideally this pattern appears in a well-defined uptrend. Checking the volume can help you dodge false alarms.
Example of a bearish harami pattern displayed on a candlestick chart with the two candlesticks clearly marked.
The bearish harami pattern is a subtle wink from the market signaling a meaningful shift in trader sentiment. The first bullish candle proudly stands tall showing strong confidence and solid momentum pushing prices upward. Then comes the smaller second candle, almost like a hesitant footstep suggesting that buyers might be losing some of their gusto. This little pause often sets the stage for a market correction or reversal as sellers quietly start to edge in.
The bearish harami often signals the market is taking a breather, almost like it’s pausing to catch its breath and rethink the next move. Buyers seem to be holding back, while sellers might be getting their game faces on, ready to step in and take charge.
The bearish harami can be a handy tool in your trading toolkit but I’ve noticed many traders jump the gun on what it really signals. It’s not a guaranteed sell-off trigger and it doesn’t play out the same across all timeframes. If you focus on this pattern without seeing the bigger market picture or checking trading volume, you might make some avoidable costly mistakes.
Trading the bearish harami isn’t simply about spotting the pattern and calling it a day. Real success hinges on waiting for solid confirmation, sticking to your risk management rules, and having clear exit plans ready to roll.
Spot the bearish harami pattern during a clear uptrend making sure the context really lines up—after all, timing is everything in these scenarios.
Look for confirmation from the very next candle or lean on supporting indicators like RSI or MACD to give you that extra confidence before calling a possible reversal.
Place a stop loss just above the high of the initial bullish candle to keep your risk neatly in check—because nobody likes unpleasant surprises.
Set profit targets around nearby support levels or Fibonacci retracements to keep your expectations firmly grounded avoiding the all-too-common trap of chasing unrealistic gains.
Manage your position size with care, always factoring in your overall portfolio risk and the asset’s volatility—think of it as balancing on a tightrope where prudence keeps you steady.
Bearish harami patterns often appear just before notable price drops and act like a quiet warning before the storm hits. For example, during a strong rally in a popular stock or cryptocurrency, spotting a bearish harami can be a helpful sign that a correction might be coming soon. Traders should study past charts to see how this pattern played out in various settings and timeframes.
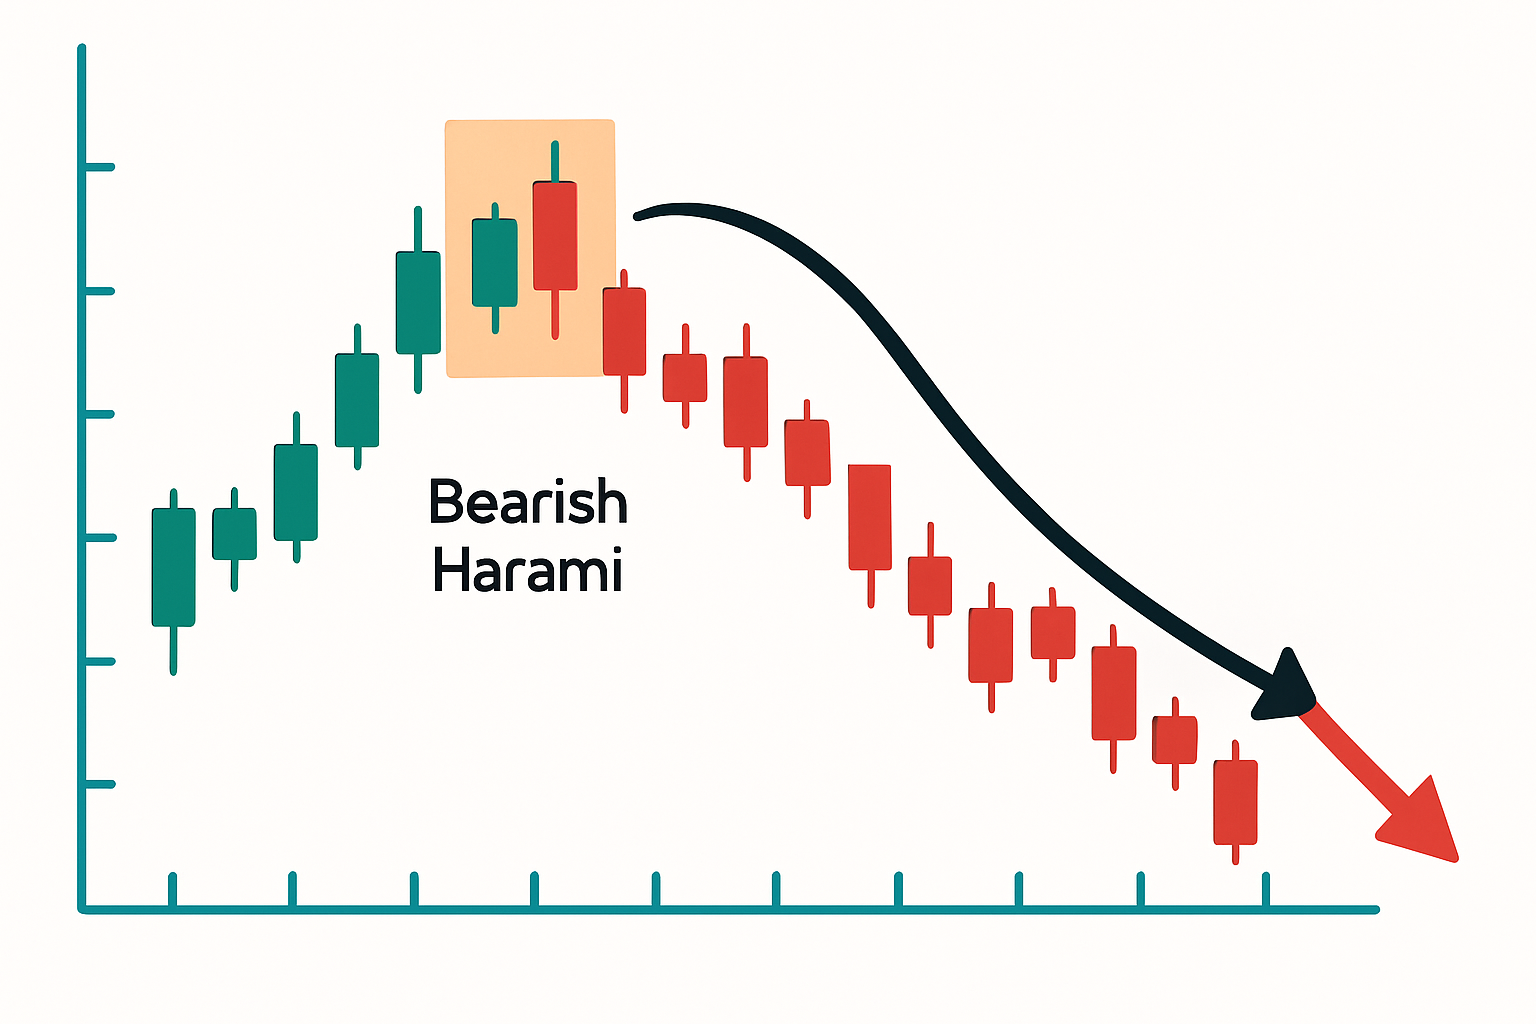
Historical example illustrating the bearish harami pattern leading to a significant price downturn.
Taking a closer look at instances where the bearish harami nailed the reversal versus when it totally missed the mark really drives home the point. Confirming signals and sizing up market conditions is absolutely key. Sometimes the pattern genuinely signals a reversal but other times the market’s momentum just steamrolls through leaving you with false alarms.
The bearish harami can be quite helpful but it definitely has its quirks. It tends to throw out false signals when the market’s choppy or just meandering sideways so you can’t take it at face value. Usually, you’ll want to see some volume backing it up before you put any stock in it. Its reliability can swing quite a bit depending on the timeframe you’re looking at.
Snagging more reliable bearish harami signals really pays off when you pair them with other technical analysis tools. Checking volume and momentum indicators like RSI or trend-following systems often gives you a clearer picture of what’s going on.

Struggling to improve your trading performance? Edgewonk's advanced analytics tools are designed to give you the edge you need.
With detailed trade journaling, robust strategy analysis, and psychological insights, you'll gain a comprehensive understanding of your strengths and weaknesses. Don't miss out on this game-changing opportunity.

17 posts written
Unlock the power of the bear flag pattern with our practical, step-by-step guide. Understand market...

Unlock the power of the head and shoulders pattern with this complete guide. Learn to spot, trade, a...

Discover the bullish harami candlestick pattern—a key technical signal that can hint at trend revers...

Master the hammer candlestick pattern—a key indicator for market reversals. This beginner-friendly g...