


Technical Analysis
What the Doji Candlestick Means in Price Action
Discover the doji candlestick—a powerful price action signal revealing market indecision. This begin...

The bullish engulfing candle pattern is a key candlestick formation that often signals a potential turnaround from a downtrend to an uptrend. Widely favored in technical analysis circles, it helps traders spot when strong buying momentum is stepping in to take the reins after a period of selling pressure.
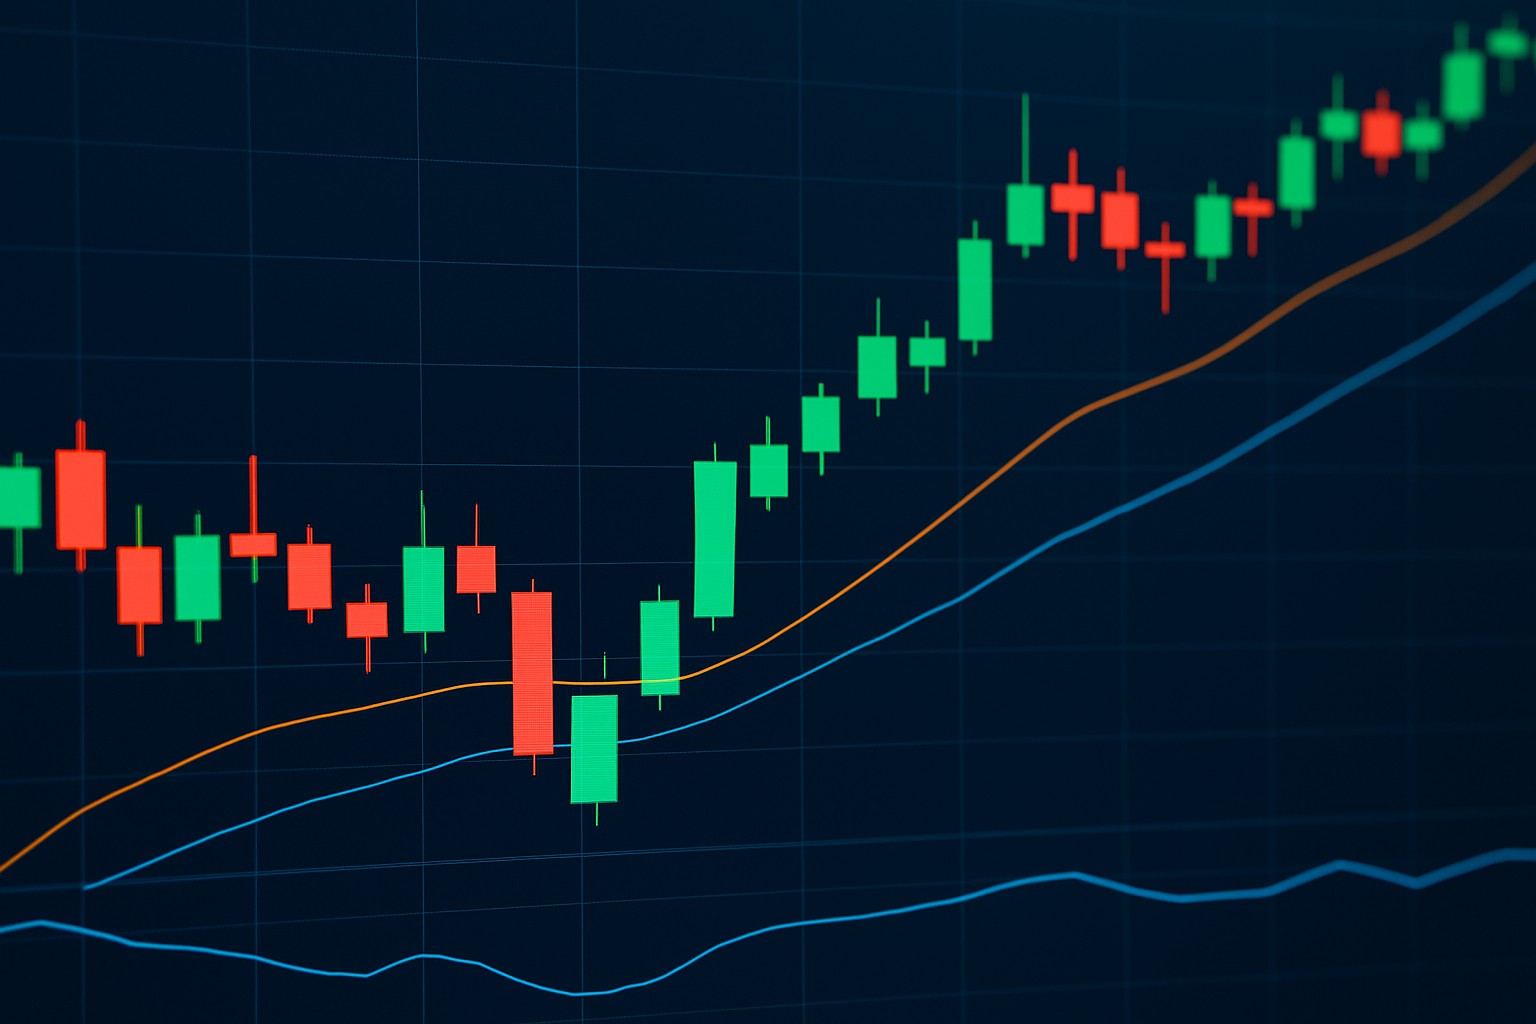
Before diving into the bullish engulfing candle it’s helpful to get a handle on the basics of candlestick charts. These nifty charts lay out price changes over time in a way that’s easy on the eyes and packed with clues about what’s going on in the market.
A bullish engulfing candle pattern features two candles and hints at a potential shift from selling pressure to a surge of buying interest.
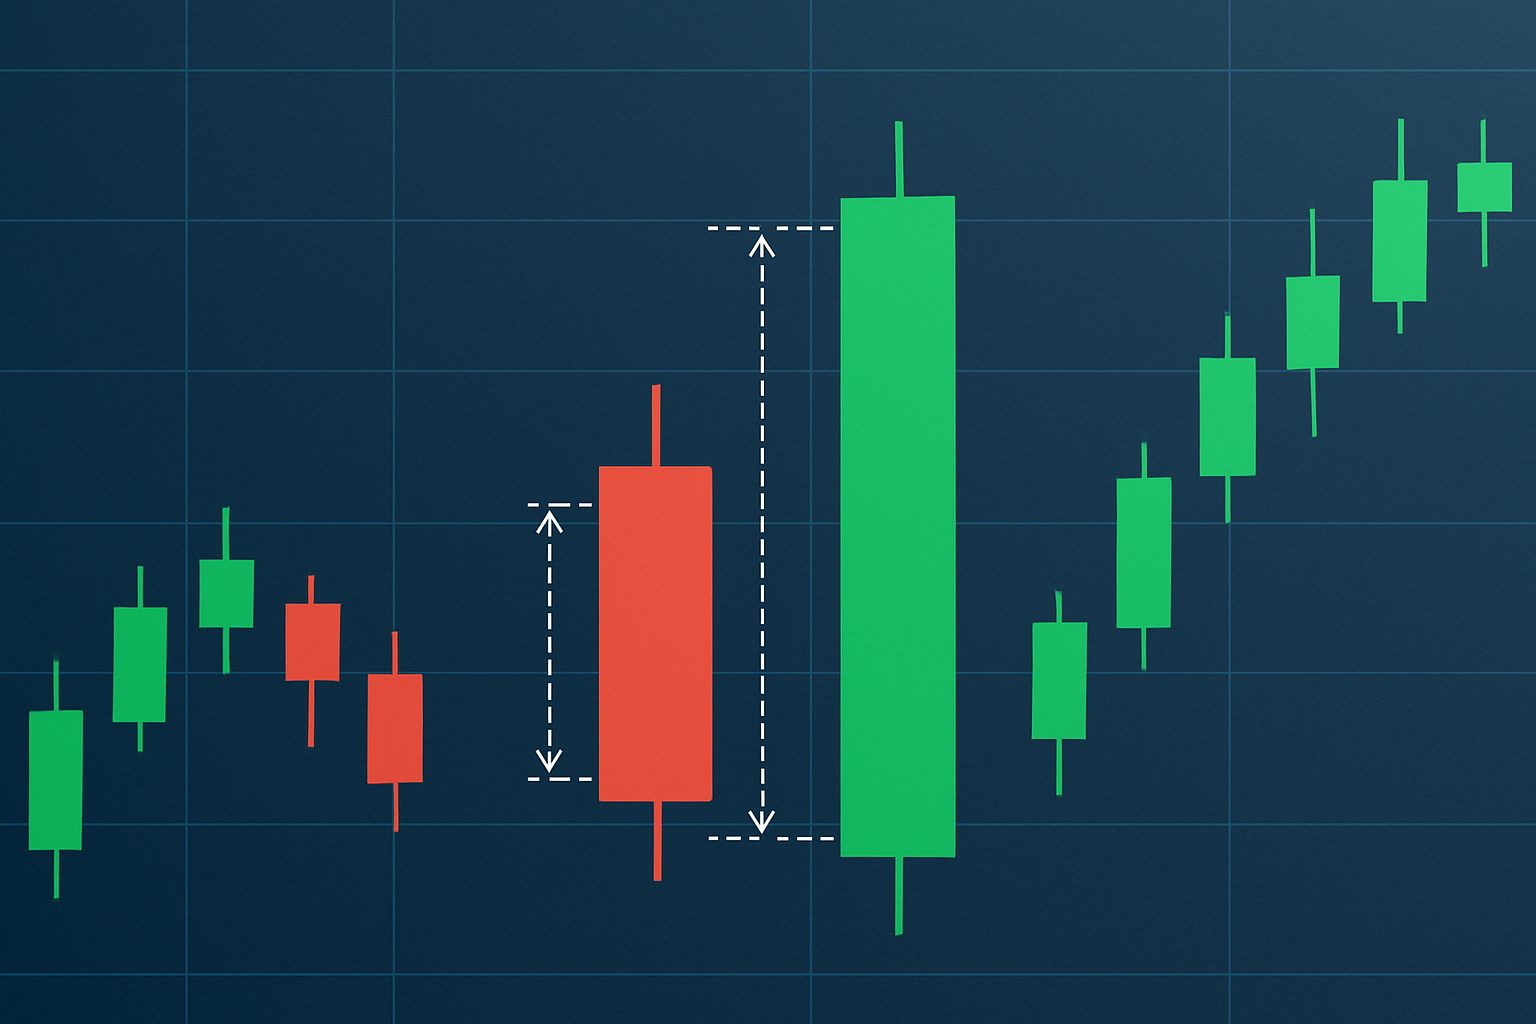
A chart illustration of the bullish engulfing candle showing the larger bullish candle engulfing the smaller bearish candle body.
This example nicely highlights the hallmark of the bullish engulfing pattern, where the body of the second candle completely swallows up the previous one. It’s pretty clear how the color switch hints at a shift in market mood.
The bullish engulfing pattern is a classic sign that market sentiment is shifting gears. After sellers have had the upper hand for a stretch, buyers suddenly jump in with conviction and grab the reins.
The bullish engulfing candle often signals a sudden switch from a moment of hesitation to full-on confidence, sending prices climbing as eager buyers jump in and seize control.
The bullish engulfing pattern is a pretty powerful signal though it’s really just one star player in a whole team of candlestick reversal patterns.
| Pattern Name | Number of Candles | Pattern Characteristics | Typical Implication | Visual Cues |
|---|---|---|---|---|
| Hammer | 1 | Small body perched near the top with a surprisingly long shadow dangling below | Often hints at a possible bottom reversal, like a subtle nudge from the market | A lone small candle sporting a notably long lower wick |
| Morning Star | 3 | Starts with a bearish candle, followed by a tiny indecisive one, then a bullish candle steps in | Usually points to a strong reversal bouncing back from a downtrend | Clear shift in candle sizes and colors stretching across three candles |
| Piercing Pattern | 2 | A bullish candle that opens below yesterday’s close but generously closes above the midpoint of the previous body | Typically signals a moderate bullish turnaround, showing some market optimism | The second bullish candle overlaps the initial bearish one, giving a glance of the bulls taking charge |
| Bullish Engulfing | 2 | The second candle’s body completely wraps around the first bearish candle, like a big bear hug | Generally marks a solid bullish reversal, making the bulls feel confident | One large bullish candle fully covering the bearish candle’s body |
Recognizing the bullish engulfing candle calls for a bit of patience and a keen eye to avoid falling into common traps.
Make sure the market is already leaning bearish, giving you a clear sign of a downtrend in motion.
Check that the initial candle is unmistakably bearish, sporting a small to medium-sized body that shows sellers are definitely making their presence felt.
See that the second candle fully engulfs the first candle’s body from open to close like it’s swallowing it whole.
Keep an eye out for a boost in volume, which usually backs up the strength of that bullish move captured in the second candle.
Hold your horses and wait for more signals such as a string of bullish closes before diving into a trade.
People often get their wires crossed between the candle bodies. Also, if you zoom in on this pattern without stepping back to see the bigger market picture or keeping an eye on volume you might end up chasing a wild goose.
Traders often lean on bullish engulfing patterns by nailing their entry timing and smartly setting stop-loss levels while keeping an eye out for confirmation signals.
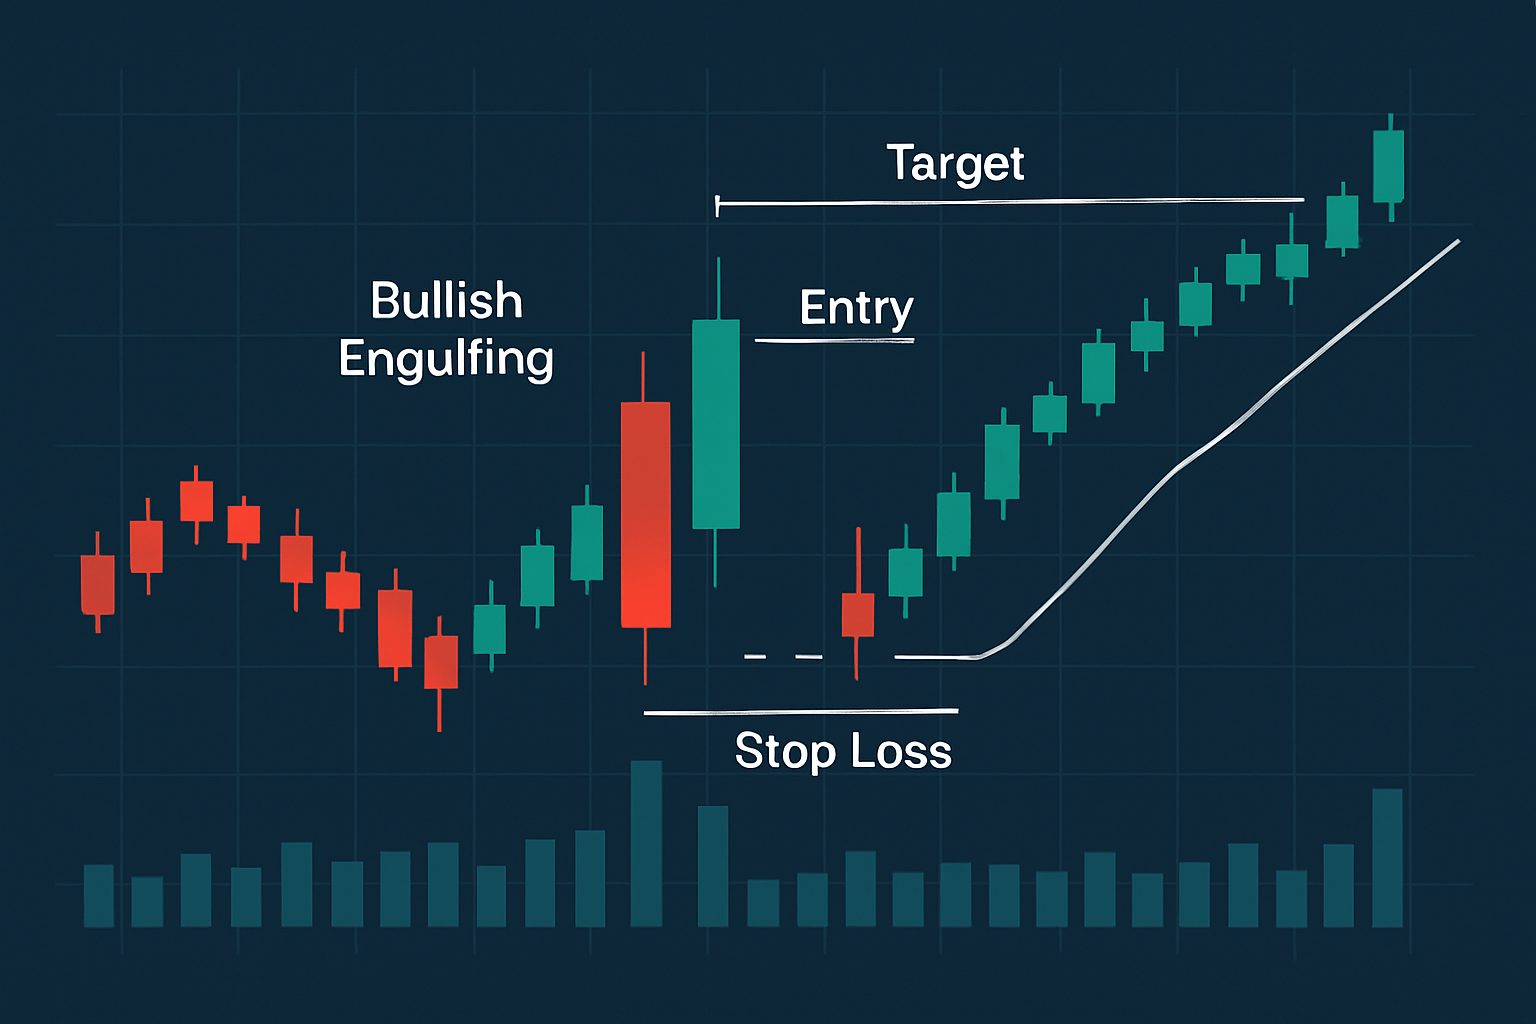
Trading setup example showing entry, stop loss, and target levels using the bullish engulfing candle pattern.
Picture this: a daily chart lights up with a bullish engulfing candle near a trusty well-established support level. A savvy trader might decide to jump in the next day and place a stop loss just below the low of that engulfed candle—playing it safe as we all should. When you spot higher volume and a bouncing-back RSI, it usually boosts your confidence.
The bullish engulfing candle pattern is a pretty powerful signal but it's not always foolproof. It can throw out false alarms, especially when the market is just drifting sideways or the volume's on the low side.

Are you tired of juggling multiple tools for your trading needs? TradingView is the all-in-one platform that streamlines your analysis and decision-making.
With its powerful charting capabilities, real-time data, and vibrant community, TradingView empowers traders like you to stay ahead of the market. Join thousands who trust TradingView for their trading success.

16 posts written
Discover the doji candlestick—a powerful price action signal revealing market indecision. This begin...

Discover the bullish harami candlestick pattern—a key technical signal that can hint at trend revers...

Unlock the power of the head and shoulders pattern with this complete guide. Learn to spot, trade, a...

Unlock the power of the bear flag pattern with our practical, step-by-step guide. Understand market...