


Technical Analysis
How to Spot a Hammer Candlestick in Trading Charts
Master the hammer candlestick pattern—a key indicator for market reversals. This beginner-friendly g...

The bearish engulfing candle is a key candlestick pattern that often signals a shift from an uptrend to a downtrend.
Get comfortable with candlestick charts as they’re a go-to tool in the trading world. Each candlestick paints a picture of price action over a specific time frame and offers traders a handy snapshot to catch momentum shifts or spot trends and potential reversals.
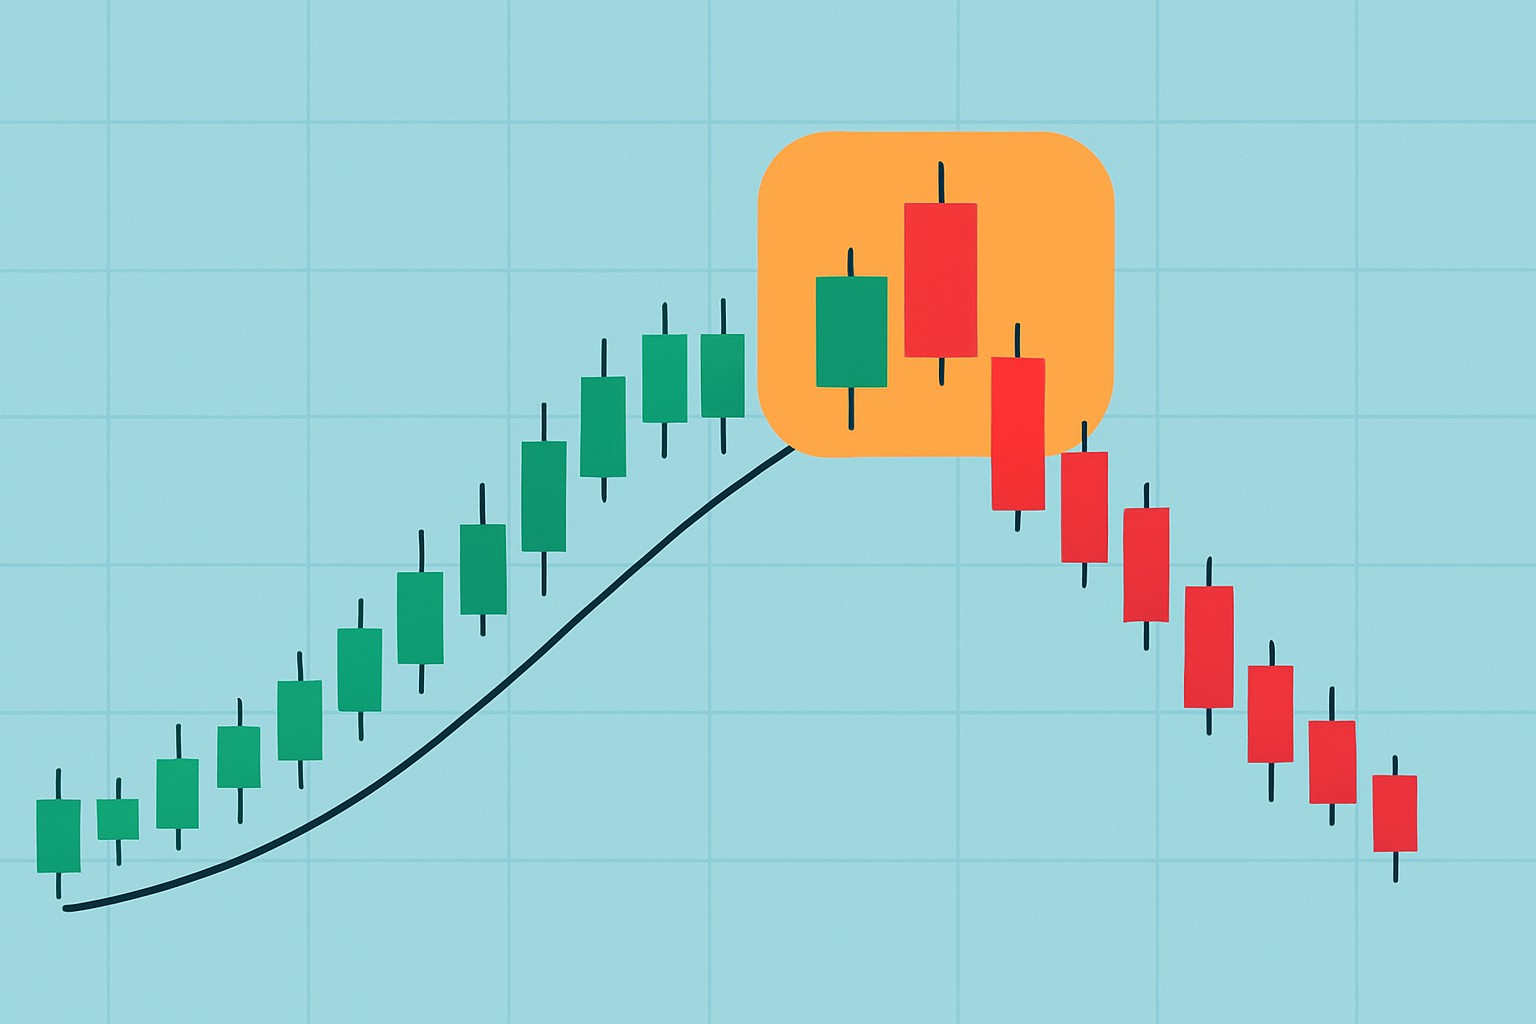
A bearish engulfing candle is made up of two candles, with a big bearish one completely swallowing up the smaller bullish candle that came before it.
Example of a bearish engulfing candle pattern absorbing the previous bullish candle on a candlestick chart.
This part of the chart reveals a bearish engulfing candle pattern where a big bold red candle completely swallows the smaller green one right before it.
The bearish engulfing candle paints a pretty clear picture of shifting market sentiment. That second candle’s strong selling pressure swallows up the earlier buying enthusiasm, suggesting sellers are now calling the shots.
"The bearish engulfing pattern often plays out like a showdown where sellers come out swinging hard, overpowering the buyers and waving a pretty clear red flag that prices might be headed south."
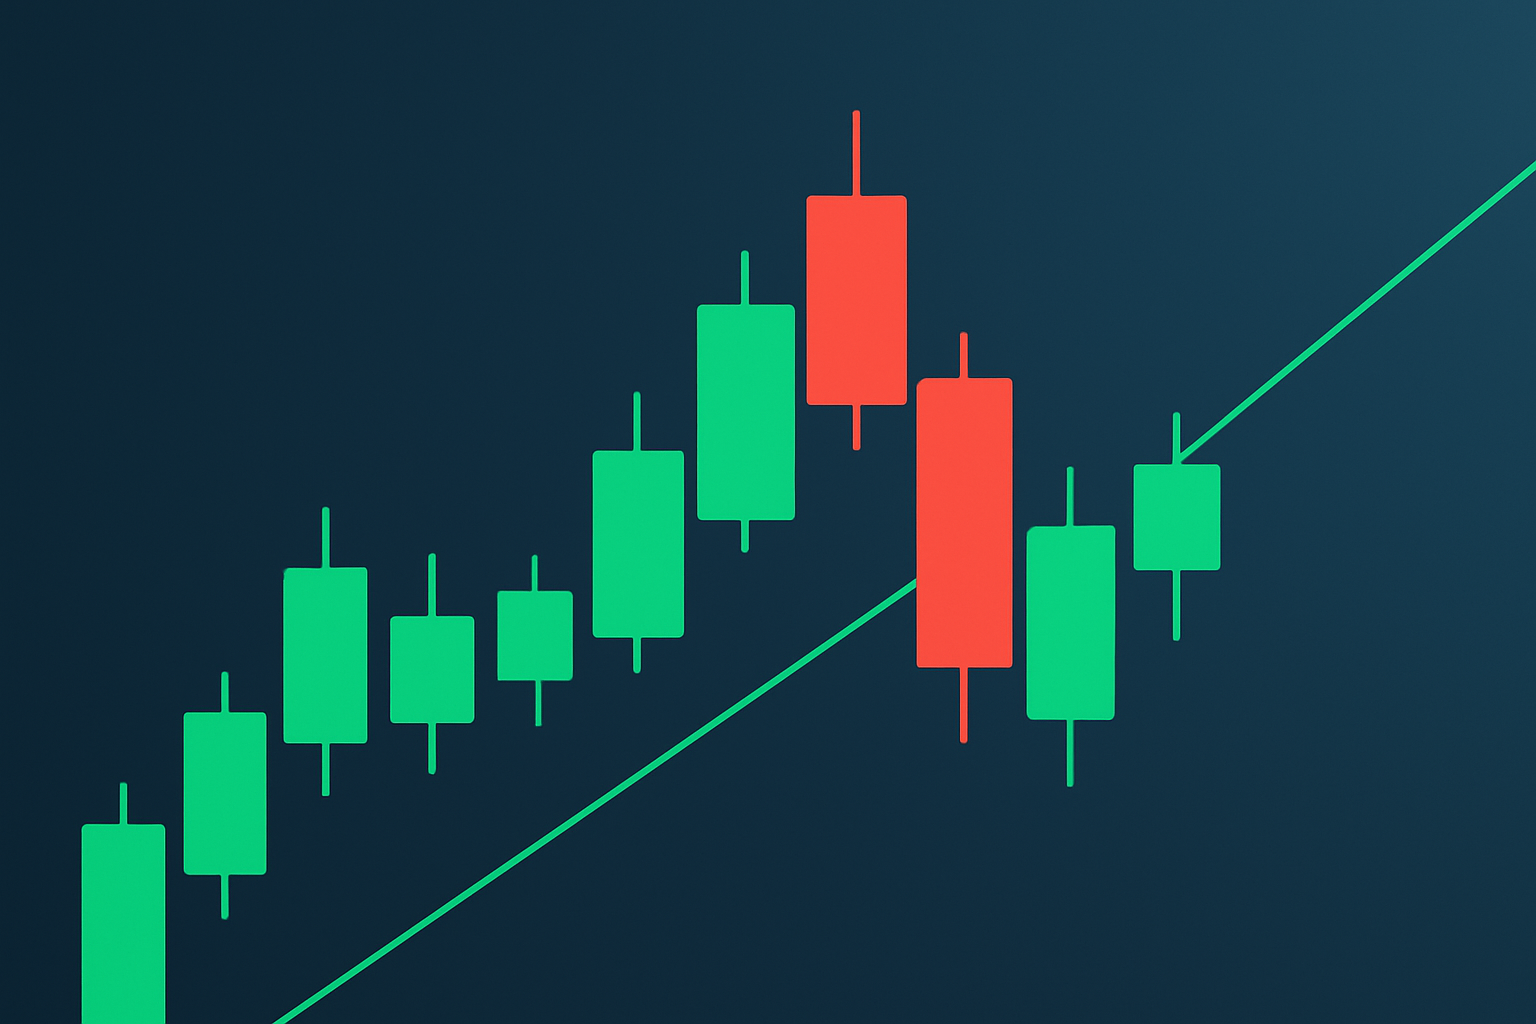
Spotting a valid bearish engulfing candle takes a bit more than just eyeballing candle shapes. Traders typically want to see this pattern pop up after a clear uptrend, with the second candle fully swallowing the first one whole.
Make sure the market has been trending upward or experiencing a bullish phase before this pattern appears. Think of it as setting the stage for a possible change in the trend.
Carefully examine the second candle’s body. It should fully cover the first candle’s body, including both the open and close prices. This kind of sweep usually indicates strong bearish momentum.
Watch for a clear spike in selling volume on the second candle. This acts as a confirmation of the move’s real strength.
Pay attention to where this pattern appears on the larger chart. Avoid being misled by false signals during sideways or choppy market phases, so context matters a lot here.
Common mistakes tend to crop up when individuals mix up similar yet less trustworthy patterns for bearish engulfing candles or simply overlook the bigger market picture, which can definitely lead you down the wrong path.
Traders often weave the bearish engulfing candle into their bigger trading strategies by cross-checking its signals with other technical indicators and setting stop-loss orders carefully. They also target reasonable price support levels.
When a trader spots a bearish engulfing candle on the daily chart they might decide to jump into a short position the very next day and carefully place a stop-loss just above that candle’s high. Targets usually get pegged near previous support levels to strike a smart balance between potential reward and risk.
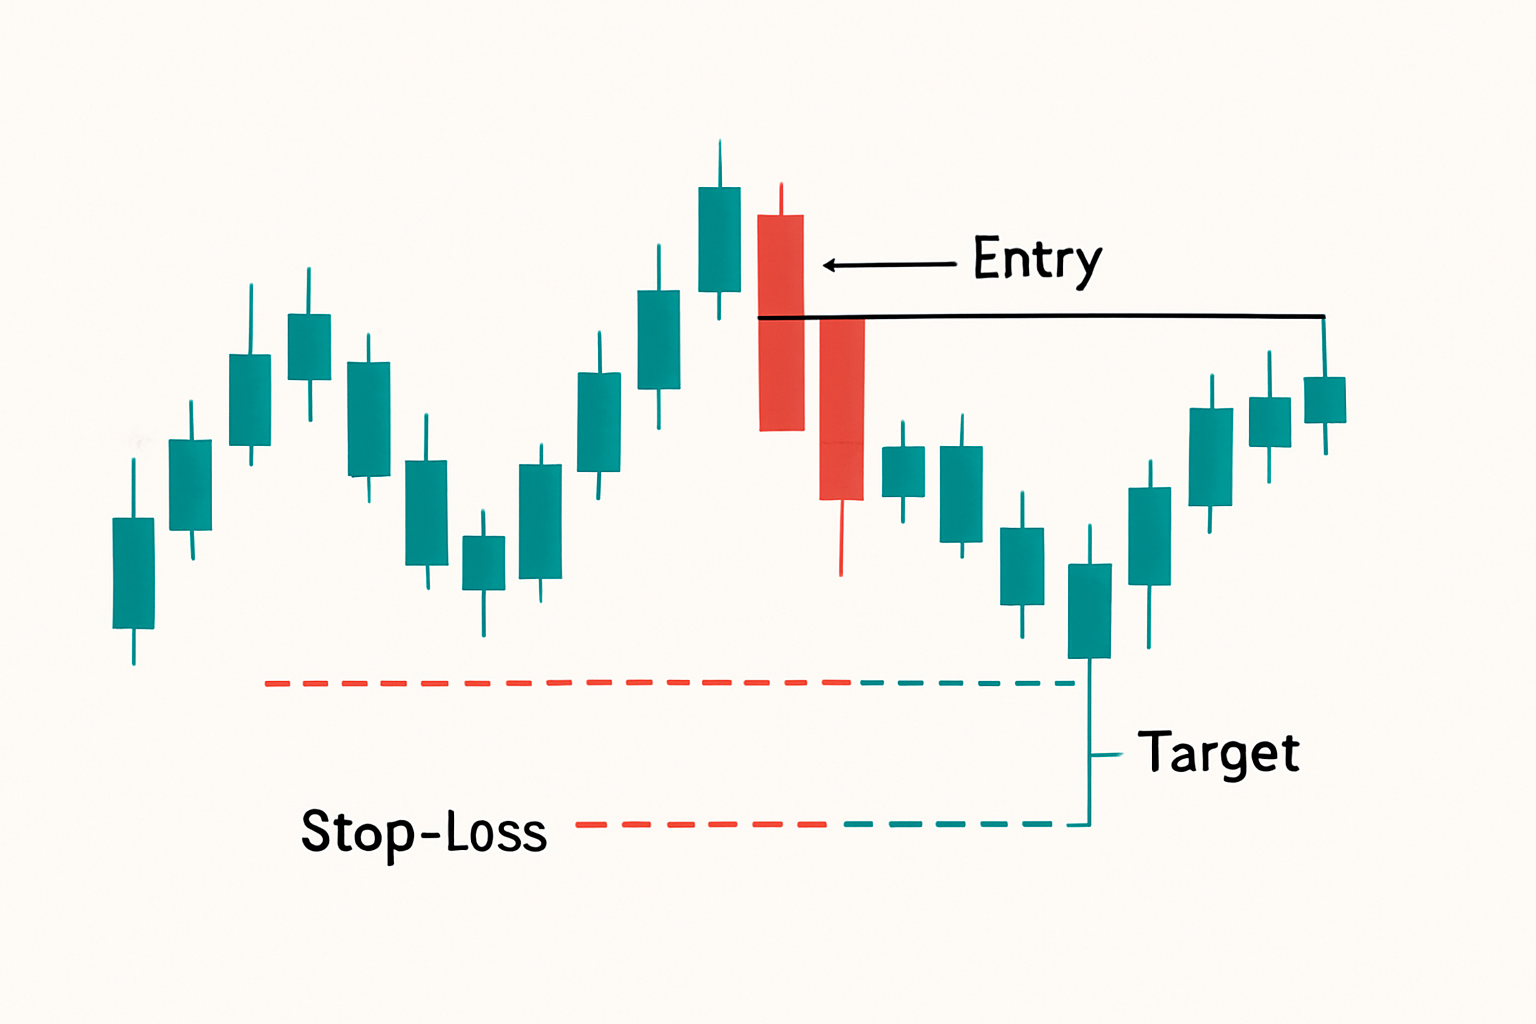
Illustration of a trade setup using the bearish engulfing candle pattern, including hypothetical entry, stop-loss placement, and profit targets.
The bearish engulfing candle is a pretty strong indicator but it’s not foolproof. Sometimes it throws out false alarms, especially when trading volumes are on the light side or prices are just meandering sideways.
It is easy to jump to the conclusion that any engulfing candle screams bearishness, without pausing to see if it is showing up during a downtrend or near those vital support levels where the price might just surprise you and bounce back.
Recognizing the bearish engulfing candle as part of a broader technical analysis toolkit helps traders spot potential reversals with more confidence. When you combine this pattern with volume data and trend analysis it often paves the way for smarter entry and exit decisions that can genuinely boost trading outcomes.

Tired of missing opportunities and making suboptimal trading decisions? TrendSpider's cutting-edge platform automates complex technical analysis, saving you time and reducing human error.
With multi-timeframe analysis, dynamic alerts, backtesting, and customizable charting, you'll gain a competitive edge in identifying trends and making informed trades across global markets.

19 posts written
Master the hammer candlestick pattern—a key indicator for market reversals. This beginner-friendly g...

Discover the bullish harami candlestick pattern—a key technical signal that can hint at trend revers...

Unlock the power of the head and shoulders pattern with this complete guide. Learn to spot, trade, a...

Unlock the power of candle patterns to decode market psychology and improve your trading precision....