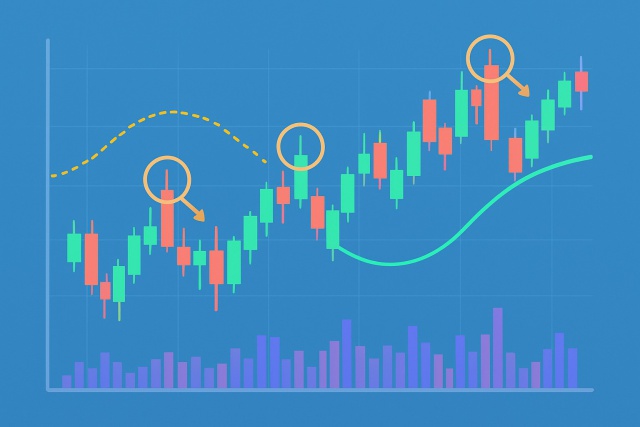
What the Doji Candlestick Means in Price Action
Discover the doji candlestick—a powerful price action signal revealing market indecision. This begin...
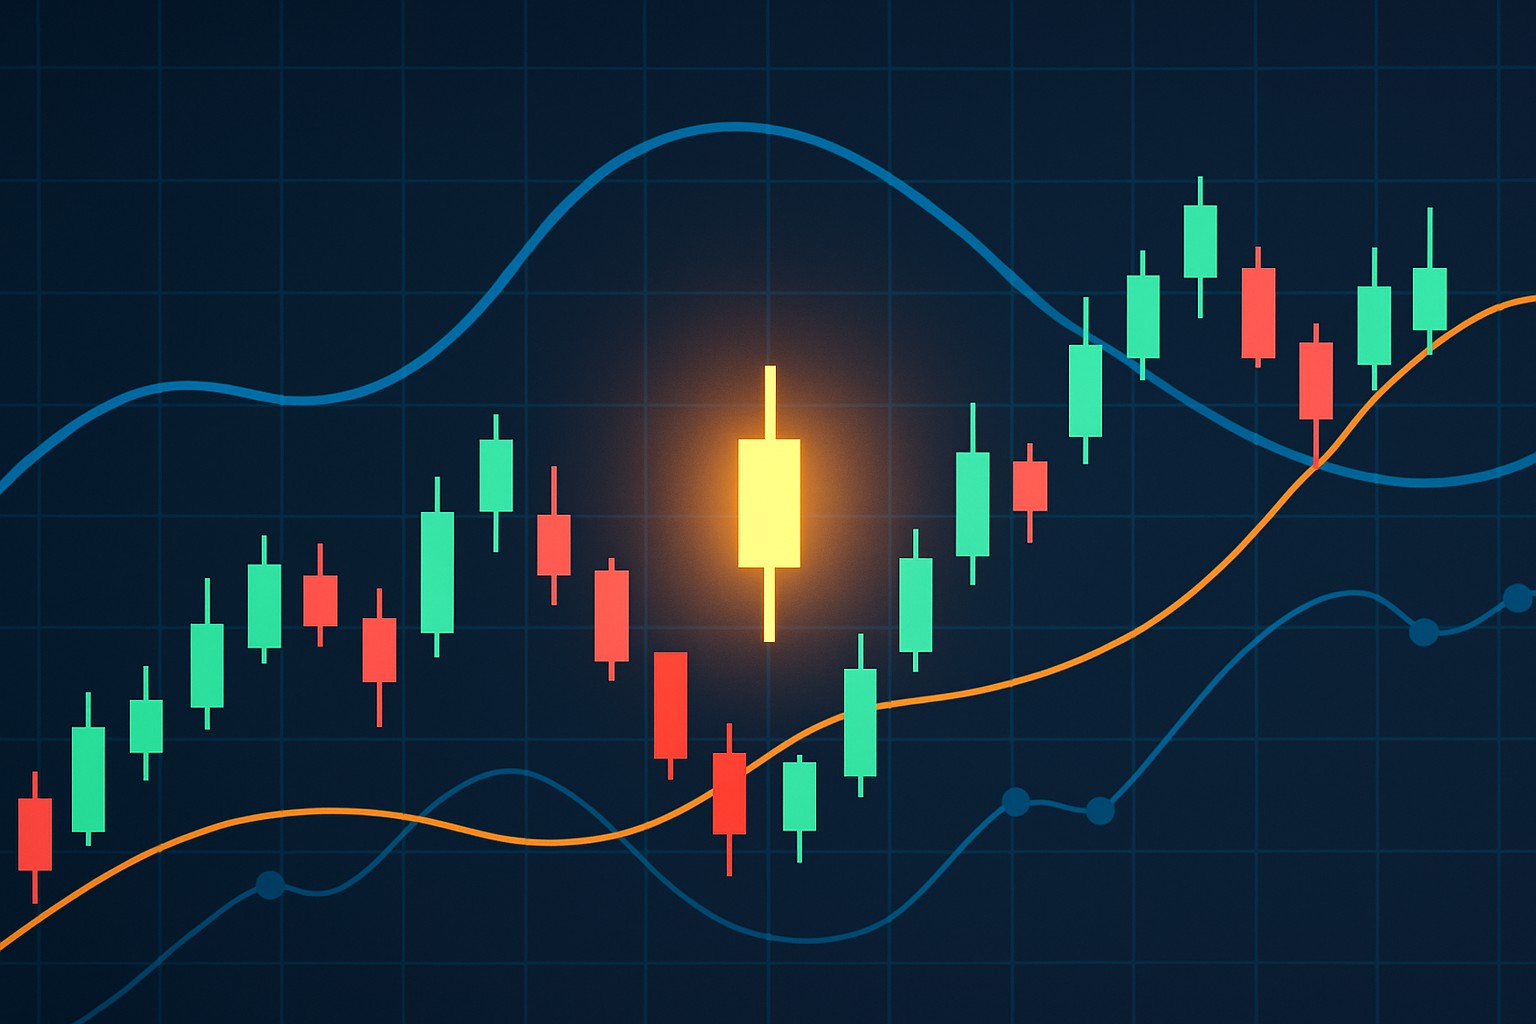
The doji candle is a staple pattern in candlestick charting that often trips up beginners. Simply put it appears when a security's opening and closing prices are nearly identical and creates that unmistakable cross or plus sign on the chart. This pattern captures a tug-of-war between buyers and sellers and shows a moment when the market is in a standstill uncertain which way to turn.
A doji candle pops up when an asset’s opening and closing prices are practically neck and neck, creating a candlestick with an almost invisible body and pretty distinct upper and lower shadows.
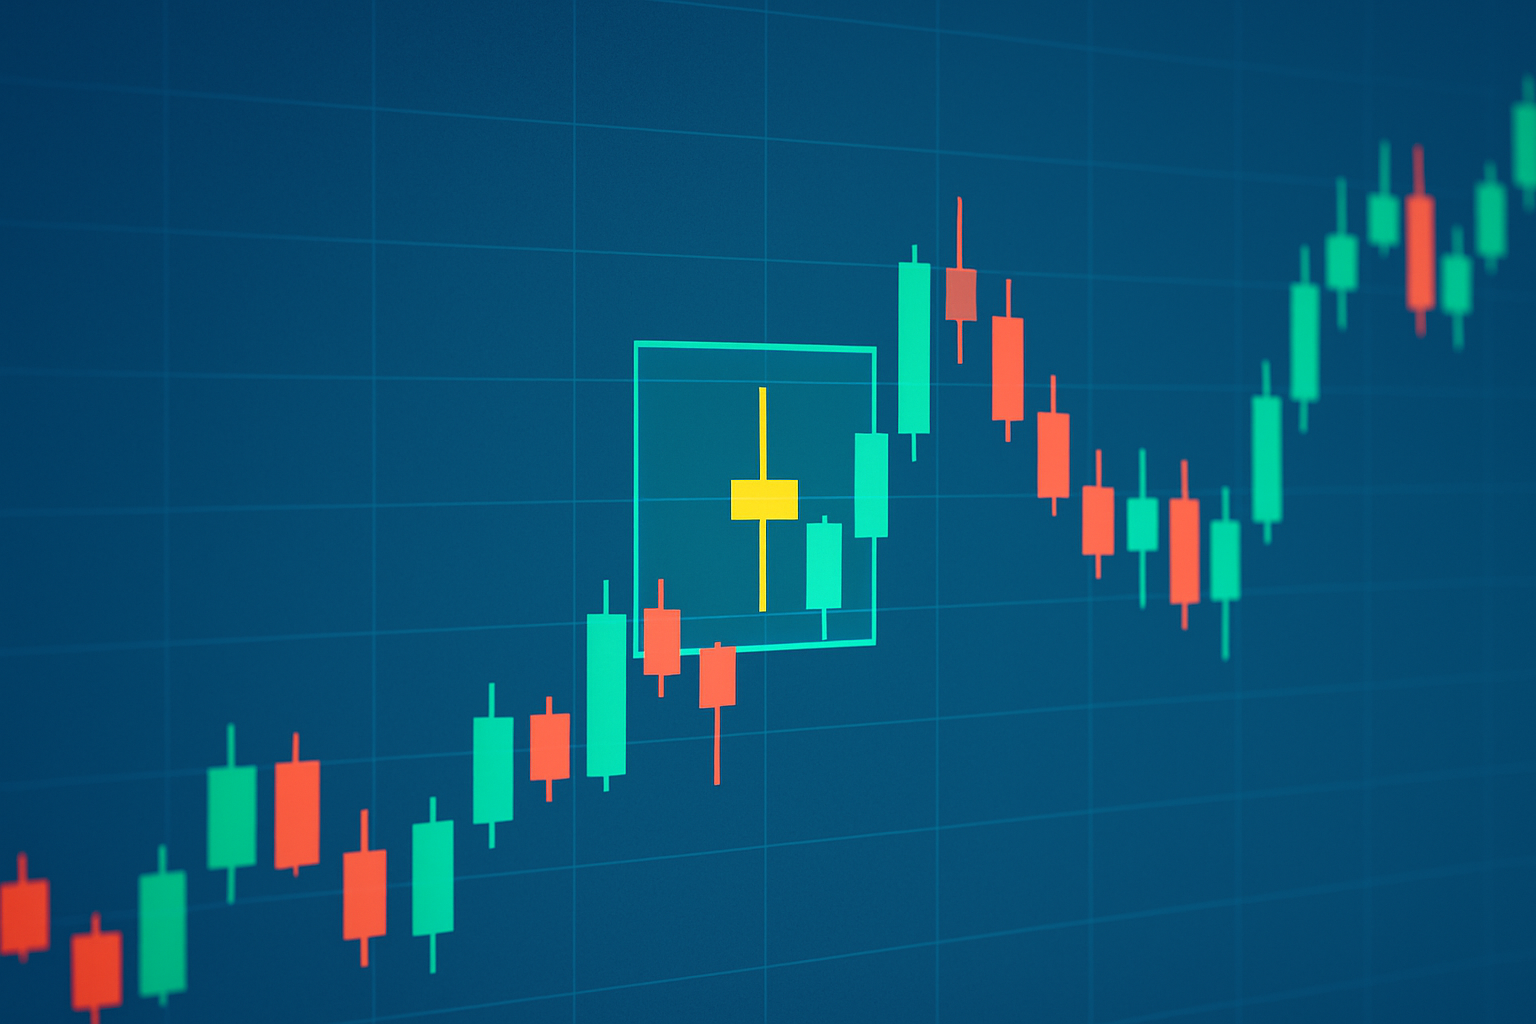
Example of a typical doji candle on a candlestick chart, highlighting the small body and long wicks.
Doji candles come in a handful of varieties mostly distinguished by the length of their shadows and where those shadows show up. You’ve got the usual suspects: the standard doji, dragonfly doji, gravestone doji and long-legged doji.
| Doji Type | Visual Description | Typical Market Meaning | Example Scenario |
|---|---|---|---|
| Standard Doji | A tiny cross-shaped body with shadows neatly balanced on both sides | Usually points to indecision, hinting the market might take a breather or even flip direction | Often pops up after a strong uptrend, showing that traders aren’t quite sure which way to jump next |
| Dragonfly Doji | A small body perched at the top with a long lower shadow hanging down | Typically suggests bullish vibes and a clear rejection of those lower prices | Shows up after a downtrend, like buyers stepping back into the ring ready to push prices up |
| Gravestone Doji | A small body sitting near the bottom with a long upper shadow looming above | Generally signals bearish potential and a firm no-go on higher prices | Seen near resistance areas, quietly hinting that sellers might be tightening their grip |
| Long-legged Doji | A tiny body with dramatically long shadows stretching high and low | Captures high volatility and real market hesitation, like everyone’s unsure where to head next | Makes an appearance during consolidation, painting a picture of unclear market direction |
Sometimes overlooked but always telling, Doji candles are like the quiet observers in the bustling world of trading charts. They might not shout loud, but when they show up, it is usually worth paying attention. These little markers can hint at indecision in the market, a pause before the next big move, or sometimes just a subtle nudge suggesting the trend might be about to change. Traders who keep an eye on Doji patterns often say they make richer their decision-making, almost like getting a whisper in a noisy room. So, whether you’re a rookie or a seasoned pro, spotting a Doji candle could be that subtle sign you didn’t know you were waiting for.
The doji candle holds an important spot by signaling moments when buyers and sellers are on the fence. These often pop up right before notable price changes. Traders usually take these candles as a nudge to hit the brakes, reconsider their moves and keep a sharp eye on what the price does next.
"A doji candle perfectly captures that classic tug-of-war between buyers and sellers, shining a spotlight on a important moment of uncertainty. It’s a gentle nudge for traders to hold their horses and wait for confirmation before jumping in, reminding us all how patience and good judgment really pay off in the end."
Spot a doji candle by zooming in on the price action during a specific timeframe and carefully comparing the opening and closing prices. It’s a bit like telling apart siblings who all look alike. Pay close attention to the length of the shadows and the broader market context.
When using doji candles in trading plans it pays off to look past the candle itself and wait for solid confirmation signals like follow-up price movements or sudden spikes in volume. Managing risk by placing stop-loss orders close to key support or resistance levels is key. Also, relying solely on doji patterns is like putting all your eggs in one basket.
Hold off for a confirming candle right after the doji, something like a strong bullish or bearish candle before diving into a trade.
Keep an eye on the volume together with the doji to get a sense of how powerful the move might be. Usually, a higher volume adds more weight and credibility to the signal.
Think about where the doji pops up in the bigger trend. It might be hinting at a reversal or suggesting you should expect a continuation.
Don’t forget to use stop-loss orders placed just beyond nearby support or resistance levels. They act as your safety net and help keep potential losses in check.
Don’t put all your faith in doji patterns alone. It’s always smarter to combine them with other forms of analysis like technical indicators or classic pattern recognition to get the full picture.
A bullish reversal usually shows up when a dragonfly doji appears after a downtrend and then a strong green candle on higher volume backs it up. On the flip side, a gravestone doji near resistance followed by a bearish candle often hints at a possible pullback, like a warning flag waving. When the market is in one of those slow indecisive consolidation phases, long-legged dojis signal hesitation and nudge traders to proceed with caution and wait for clearer calls.
Many traders tend to jump to the conclusion that a doji candle automatically signals a market reversal, or that you can rely on it all by itself without any backup from other indicators. Some individuals even assume every doji candle is cut from the same cloth, or that its importance stays constant no matter the timeframe you are looking at.
The doji candle often offers a helpful peek into market sentiment, though leaning on it too heavily can be a bit of a gamble because of its naturally ambiguous character. On its own, a doji might throw out false alarms or overlook some pretty important price moves.
Common tools that traders often lean on include moving averages to track the trend’s direction and the Relative Strength Index (RSI) to gauge momentum. They also use support and resistance levels to spot key price zones. Platforms like TrendSpider improve this with advanced pattern recognition and customizable alerts that make it easy to include doji candles in a solid trading strategy.
Are you tired of juggling multiple tools for your trading needs? TradingView is the all-in-one platform that streamlines your analysis and decision-making.
With its powerful charting capabilities, real-time data, and vibrant community, TradingView empowers traders like you to stay ahead of the market. Join thousands who trust TradingView for their trading success.
As a trader seeking opportunities in the dynamic crypto market, you need a reliable and secure platform to execute your strategies. Coinbase, the leading cryptocurrency exchange, offers a seamless trading experience tailored to your needs, empowering you to navigate the market with confidence.
11 posts written
With over a decade of experience navigating the intricate world of trading, Quentin Merriweather's expertise lies in developing innovative strategies that harness the power of cutting-edge technologies.
Read Articles
Discover the doji candlestick—a powerful price action signal revealing market indecision. This begin...
Master the hammer candlestick pattern—a key indicator for market reversals. This beginner-friendly g...

Discover what IOUs mean in finance, their role as informal debt acknowledgments, and how understandi...
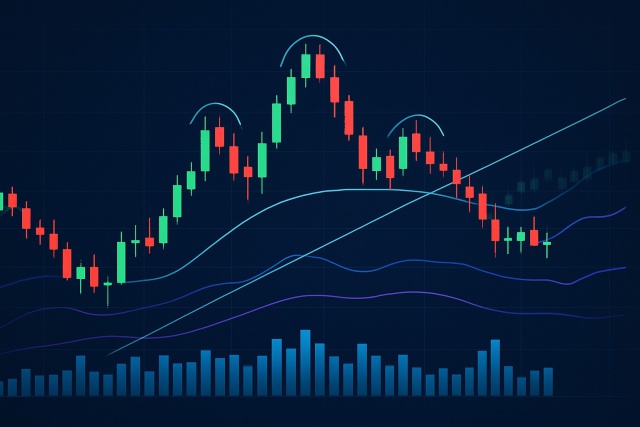
Unlock the power of the head and shoulders pattern with this complete guide. Learn to spot, trade, a...
