


Technical Analysis
How to Spot a Hammer Candlestick in Trading Charts
Master the hammer candlestick pattern—a key indicator for market reversals. This beginner-friendly g...

Getting a solid grasp on bearish trends and bullish engulfing patterns is absolutely important for success.
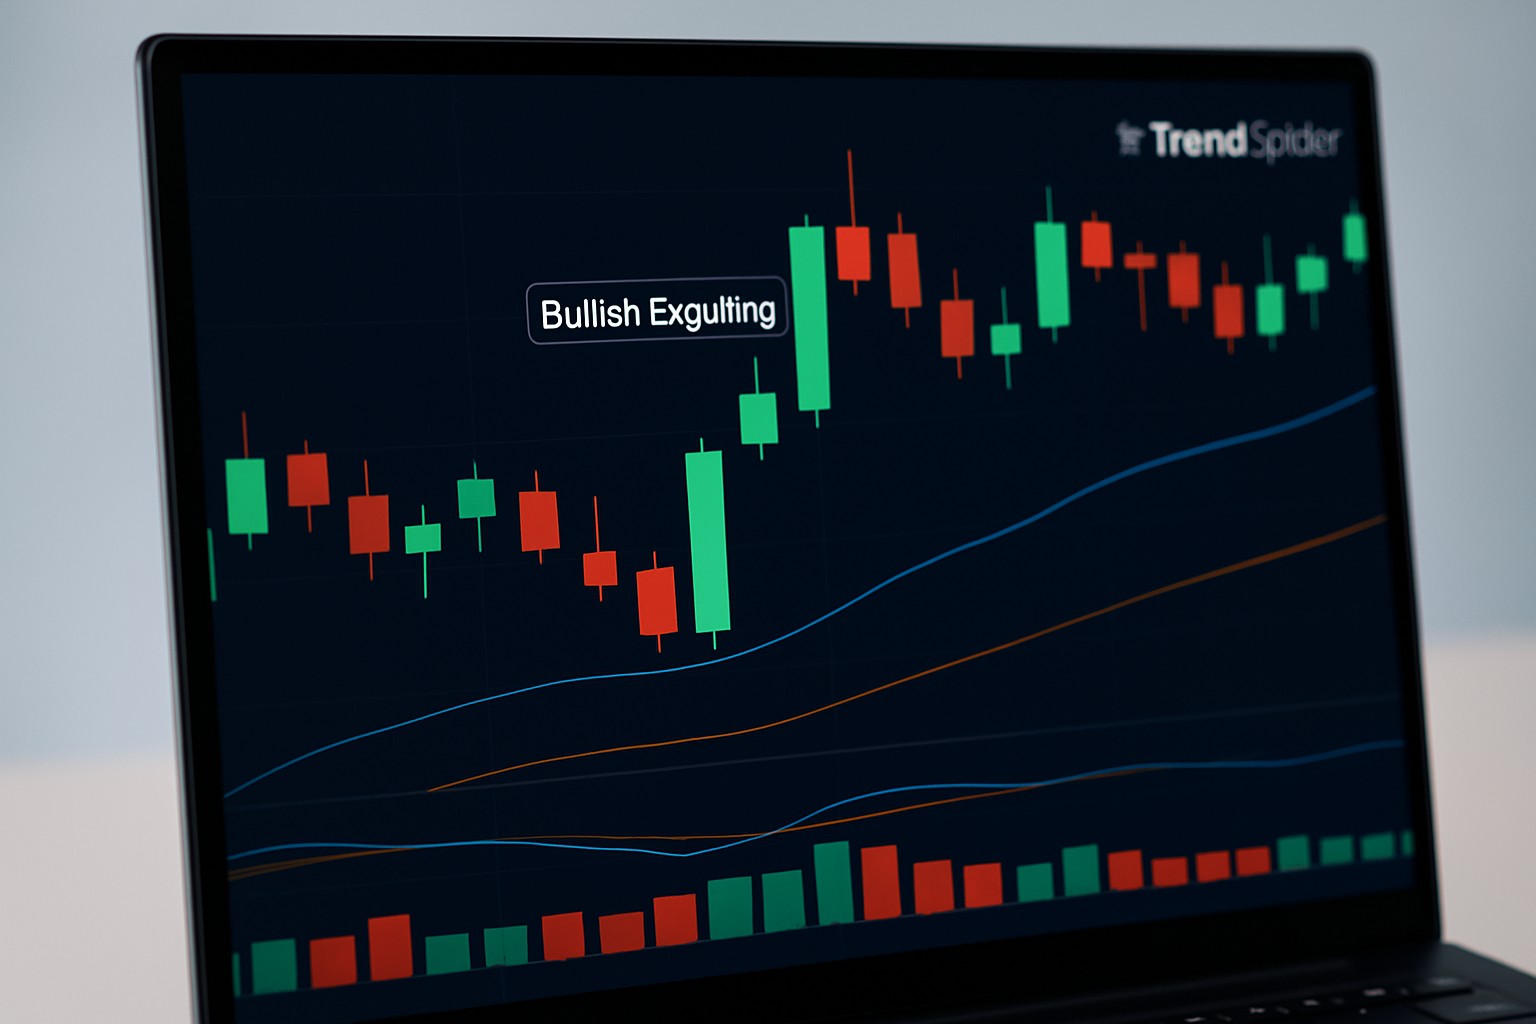
The bullish engulfing pattern is one of those trusty candlestick signals that often flags a potential trend reversal, catching plenty of traders’ attention. A lot of people swear by it, and handy tools like TrendSpider step in to do the heavy lifting with automated detection and alerts.
A bullish engulfing pattern is a candlestick formation that signals a change from a downward slump to an upward upswing. It occurs when a modest bearish candle is quickly followed by a much larger bullish candle that completely covers or 'engulfs' the one before it.
This pattern signals a shift in market sentiment, where sellers seem to be slowly loosening their grip and buyers are stepping up to the plate.
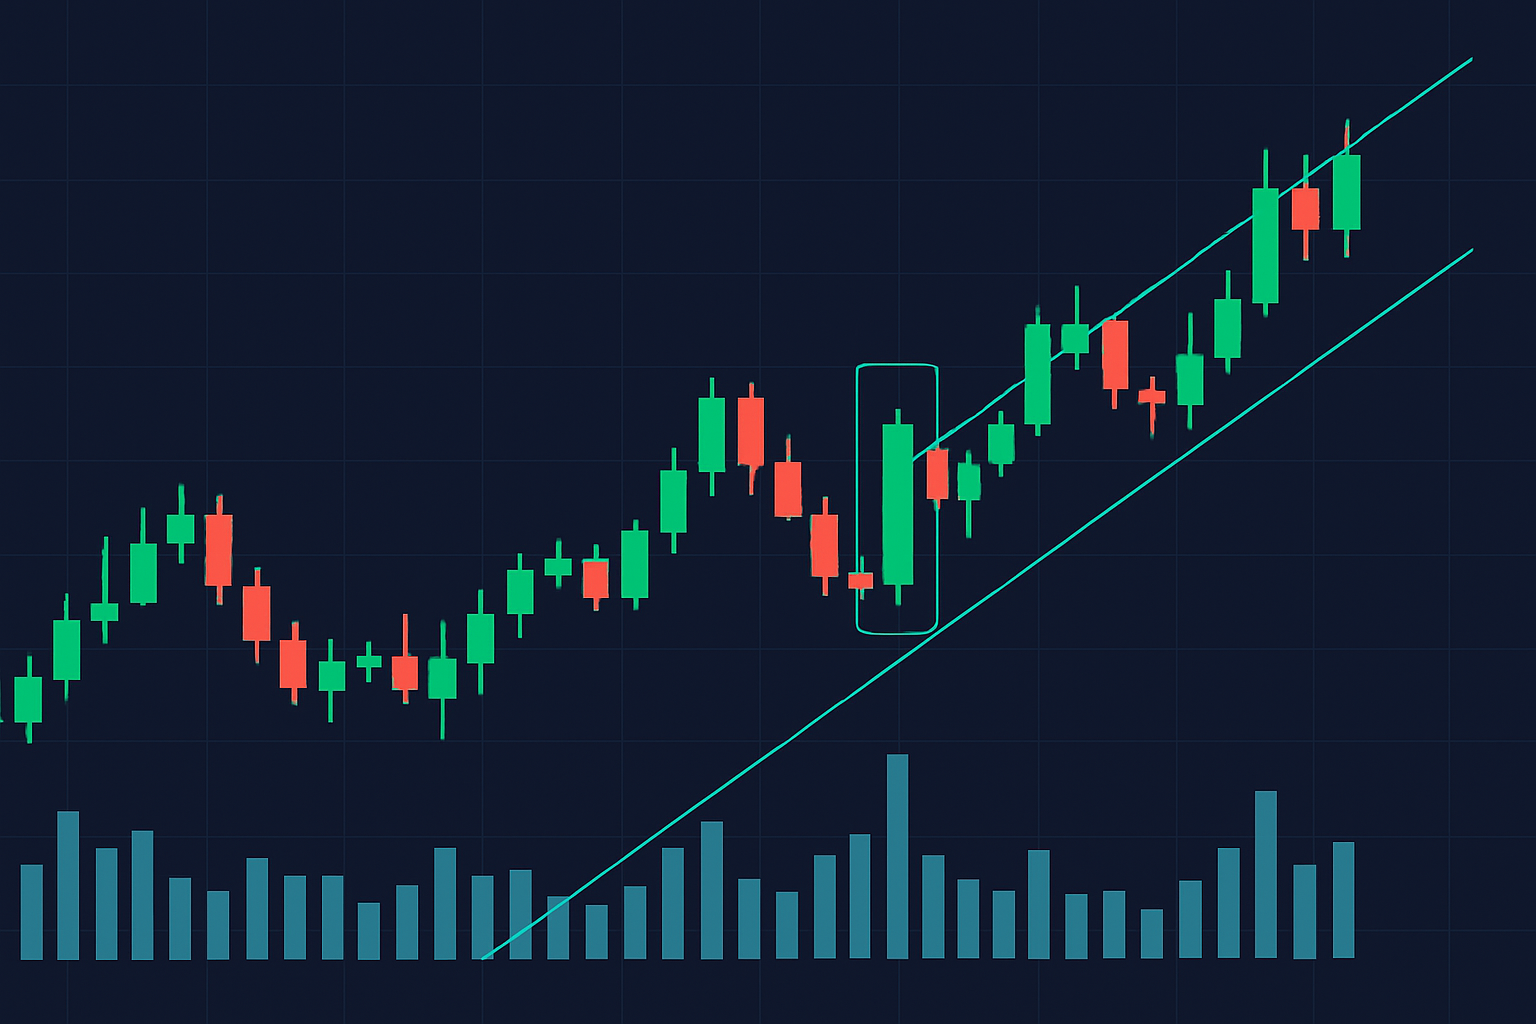
Visual example of a bullish engulfing candlestick pattern appearing after a downtrend with volume confirmation.
Bullish engulfing patterns are a classic sign of a trend flip, showing a pretty clear handover from sellers to buyers. After a downtrend, this sudden burst of buying activity usually hints that the selling pressure has finally taken a breather.
A bullish engulfing pattern marks that important moment when buyers step up and pretty much wrestle control away from sellers. It’s often one of those trusty signs traders lean on when hunting for possible market reversals. Throw in volume and a few other indicators, and suddenly the signal comes through a lot clearer, like a light bulb switching on in a dim room.
TrendSpider makes it a breeze to spot bullish engulfing patterns, thanks to its slick charting and savvy pattern recognition tools. Users kick things off by picking candlestick charts for a crystal-clear look at price action, then layer on handy built-in indicators that do a lot of the heavy lifting when it comes to spotting those patterns more reliably.
Fire up TrendSpider and select the trading instrument and timeframe that catch your eye.
Switch over to the candlestick chart style for a crystal-clear snapshot of price movements.
Don’t forget to toggle on the AI-driven pattern recognition feature in the chart settings—it’s like having a smart assistant keeping an eye out.
Keep an eye on those automatic alerts that spotlight bullish engulfing patterns—they tend to pop up right when you need them.
Weigh the pattern alongside volume data and trendlines that the platform throws your way to get the full picture.
TrendSpider’s automated pattern recognition takes a big load off your shoulders by slashing the need for manual chart scanning. Its AI doesn’t just sit around—it catches bullish engulfing patterns the moment they pop up and shoots out instant alerts to traders. This clever tool not only saves you precious time but also boosts accuracy by cutting down on those pesky human errors.
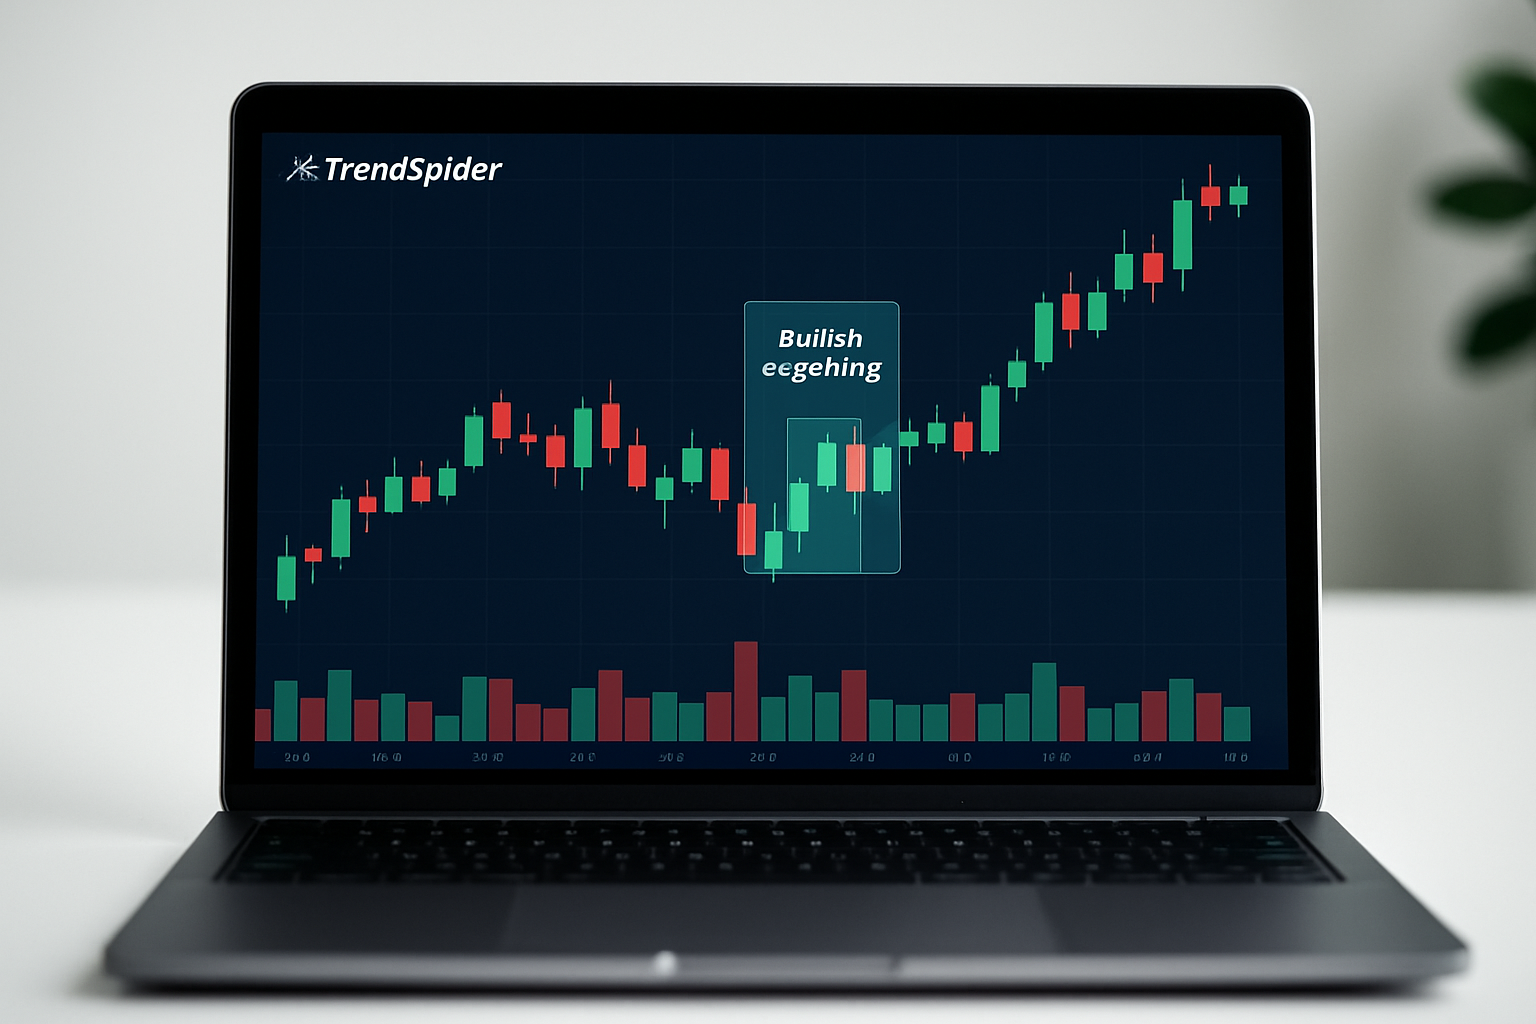
Screenshot of TrendSpider’s interface showcasing automated detection of a bullish engulfing candlestick pattern on a trading chart.
Trading bullish engulfing patterns usually plays out better when you double-check signals using TrendSpider’s handy tools.
Risk management takes center stage when trading reversals mainly because false signals sneak in. To keep losses from piling up it’s smart to hold your horses and wait for extra confirmation. Maybe a sudden spike in volume, a clean break of a trendline or some backup from other indicators.
Patience and discipline while waiting for confirmation often transform a promising trade setup into a winning one. Bullish engulfing patterns can pack quite a punch, but in my experience, they shine brightest when wrapped up in a well-thought-out strategy backed by solid data and some good old careful analysis.
Traders often stumble over bullish engulfing signals, especially when they lose sight of the bigger picture or lean too heavily on the pattern alone. I have seen plenty of people misjudge candle sizes or completely overlook volume and the broader trend.
Many individuals jump to the conclusion that a bullish engulfing pattern is a sure-fire sign of an immediate turnaround no matter what else might be brewing in the market. But here’s the kicker: if you don’t take a moment to check for confirming momentum, volume and the bigger trend picture, leaning solely on this pattern can quickly steer you into making costly mistakes
Snag more reliable trading signals by combining bullish engulfing patterns with trusted indicators like RSI and MACD or moving averages in TrendSpider.
TrendSpider users can effortlessly tweak their charts to include these handy indicators and automatic pattern recognition. When traders blend RSI, MACD and moving averages with bullish engulfing alerts, they create a well-rounded setup that often makes decision-making and timing smoother. Setting up alerts for indicator crossovers or pattern appearances keeps notifications coming right when you need them.
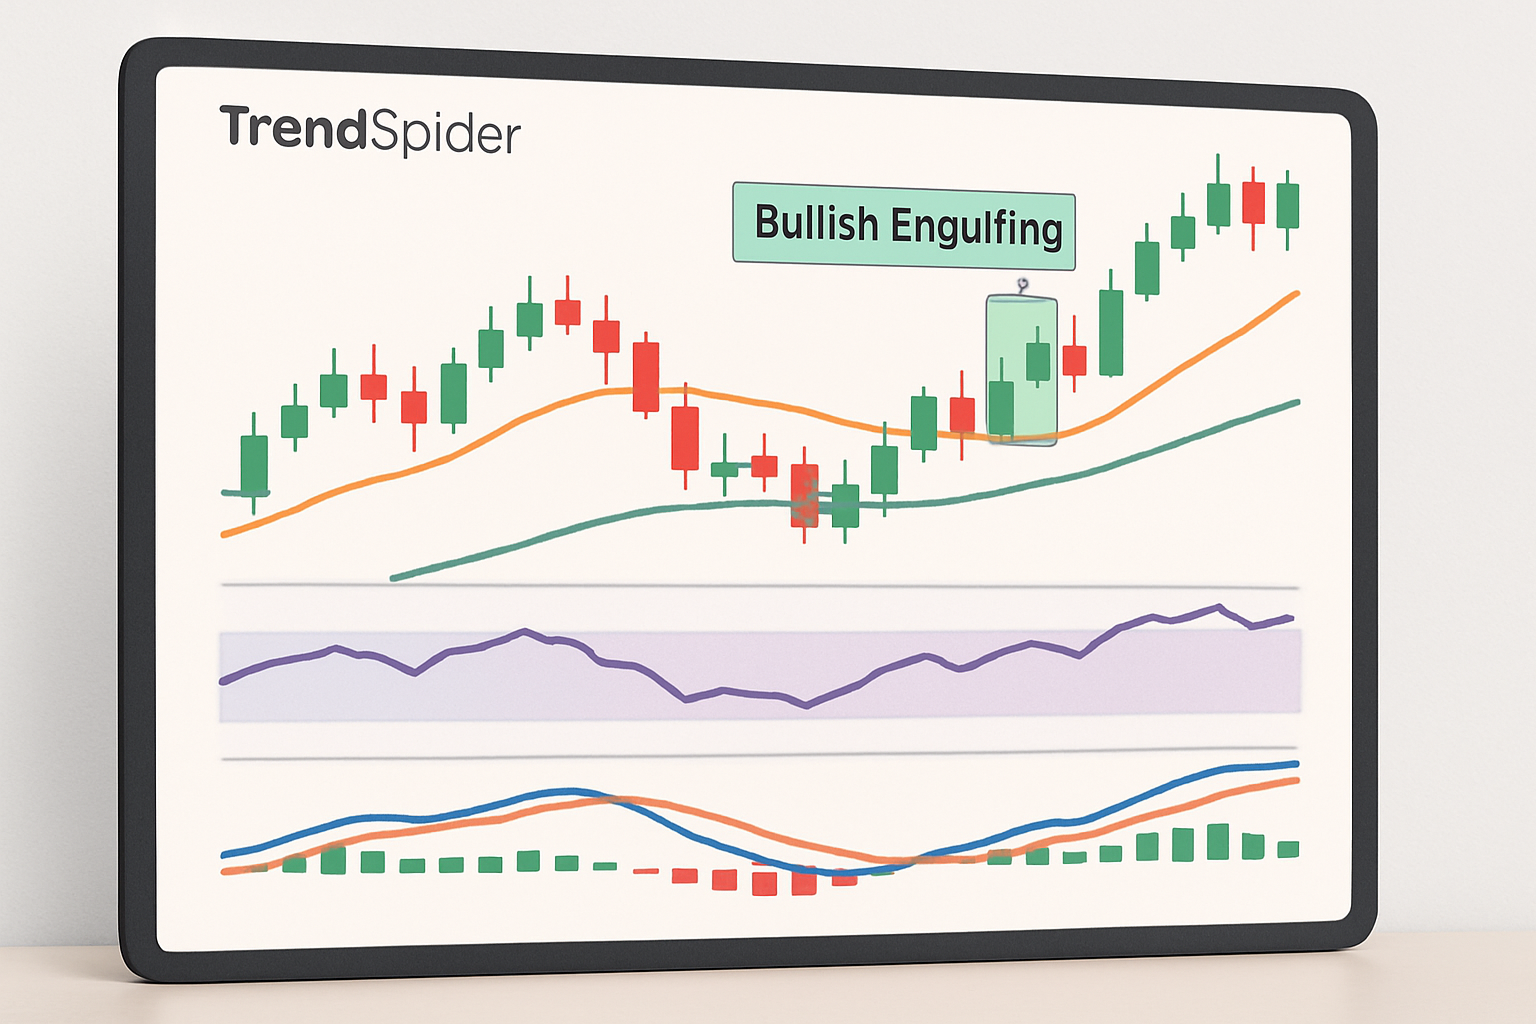
Example of TrendSpider technical indicators combined with bullish engulfing pattern for advanced trade analysis.

Tired of missing opportunities and making suboptimal trading decisions? TrendSpider's cutting-edge platform automates complex technical analysis, saving you time and reducing human error.
With multi-timeframe analysis, dynamic alerts, backtesting, and customizable charting, you'll gain a competitive edge in identifying trends and making informed trades across global markets.

11 posts written
Master the hammer candlestick pattern—a key indicator for market reversals. This beginner-friendly g...

Discover the bullish harami candlestick pattern—a key technical signal that can hint at trend revers...

Discover the doji candlestick—a powerful price action signal revealing market indecision. This begin...

Unlock the power of the head and shoulders pattern with this complete guide. Learn to spot, trade, a...