


Technical Analysis
IOU Meaning in Finance
Discover what IOUs mean in finance, their role as informal debt acknowledgments, and how understandi...

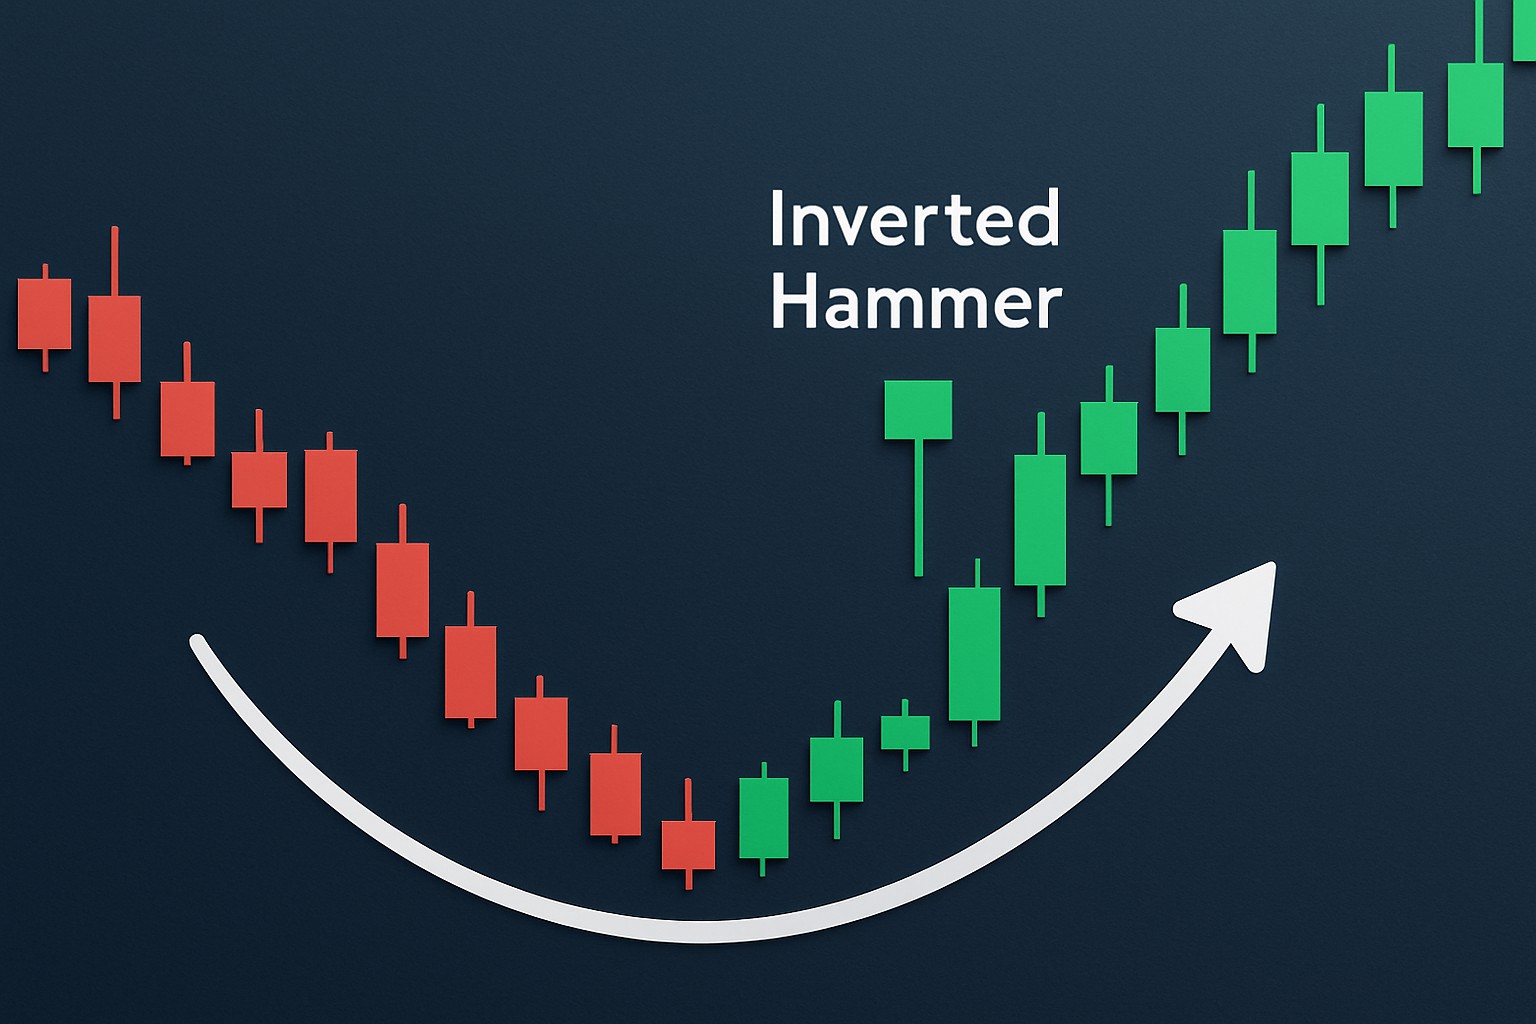
The inverted hammer is a pretty distinctive candlestick pattern in technical analysis, often waving a little flag that market sentiment might be shifting—especially after prices have taken a tumble.
An inverted hammer is a candlestick pattern you’ll spot on price charts. It has a small body near the lower end of the trading range, a long upper shadow, and little to no lower shadow.
The inverted hammer’s shape might strike you as a little quirky, but it actually tells a pretty interesting story about what’s going on in traders’ minds during a sell-off. That long upper shadow? It’s like buyers waving their hands, trying to grab the reins.
To truly wrap your head around why the inverted hammer packs a punch, it helps to understand what each part of this candlestick stands for and how it reflects those subtle shifts in market mood
The small real body shows the price barely budged between the open and close hinting at hesitation or a breather in the current trend.
The long upper shadow is like buyers waving their flag and pushing prices higher during the session. They try to wrestle with resistance and maybe flip the downtrend on its head.
When the lower shadow is tiny or missing, it means sellers couldn’t drag prices down further which usually points to selling pressure losing steam.
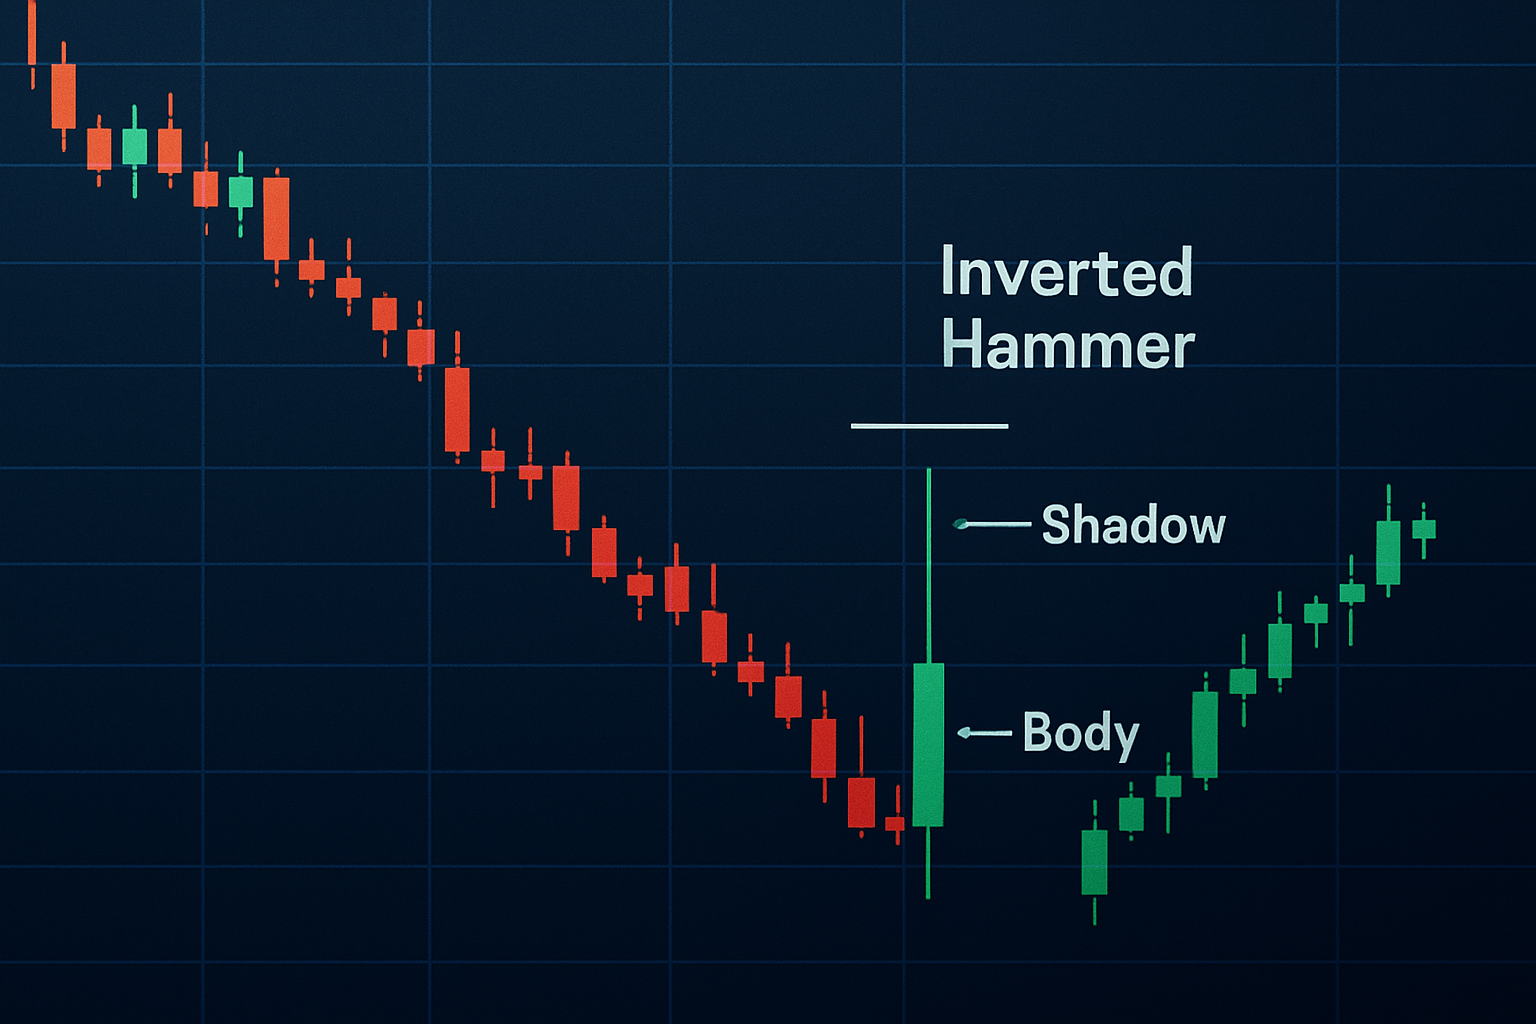
Illustration of an inverted hammer candlestick, showing its small body, long upper shadow, and minimal lower shadow after a downtrend.
An inverted hammer might easily be mistaken for a shooting star, but here’s the kicker—their meanings shift quite a bit depending on where they pop up on the chart.
Knowing these key differences can really help traders avoid the usual pitfalls and get a clearer read on candlestick charts. Mixing up an inverted hammer with a shooting star—it’s a classic recipe for off-base market predictions. Pairing candlestick patterns with other tools like volume analysis or technical indicators often works wonders, boosting both accuracy and overall trading results.
The inverted hammer signals a potential shift away from bearish control and whispers of budding bullish interest.
The inverted hammer signals buyers stepping up to the plate, nudging prices higher throughout the session.
The inverted hammer hints that buyers are starting to flex their muscles, even if they haven’t fully grabbed the reins just yet.
This back-and-forth dance between buyers and sellers suggests the market could be gearing up for a shift.
An inverted hammer on its own doesn’t exactly scream "time to jump in," since it often points to a bit of wobbly market behavior.
Keep a sharp eye out for a bullish candle appearing right after the inverted hammer, especially if it closes above that candle’s real body. This usually indicates that buyers are beginning to take control.
Pay attention to whether trading volume increases during the inverted hammer or on the very next candle. A rise here often suggests stronger buyer enthusiasm.
Don’t forget to check technical indicators like the Relative Strength Index (RSI) to identify oversold conditions or bullish divergences that might support a reversal. These tools can be very helpful in critical moments.
Watch how prices behave around trendlines or moving averages. If the price holds above recent resistance levels, it often provides a solid sign that the trend is shifting.
The inverted hammer really starts to stand out as a clearer sign that market sentiment is shifting.
It can be a handy little signal, but the inverted hammer often gets a bad rap and is widely misunderstood.
Clearing up these misconceptions really helps traders fold the inverted hammer into their technical toolkit more smoothly, steering clear of unrealistic expectations or jumping the gun with too much trading.
To really squeeze the most out of the inverted hammer pattern in your trading toolbox, here are some down-to-earth tips that can help ramp up its reliability.
Following these guidelines makes it a lot easier to spot genuine shifts in market sentiment, trimming out the noise from false signals and giving you a better shot at catching those trend reversals right when they happen.
To get a clearer picture of how an inverted hammer works, let us dive into a few real-life examples where this pattern appeared, how traders interpreted it and what happened afterward.
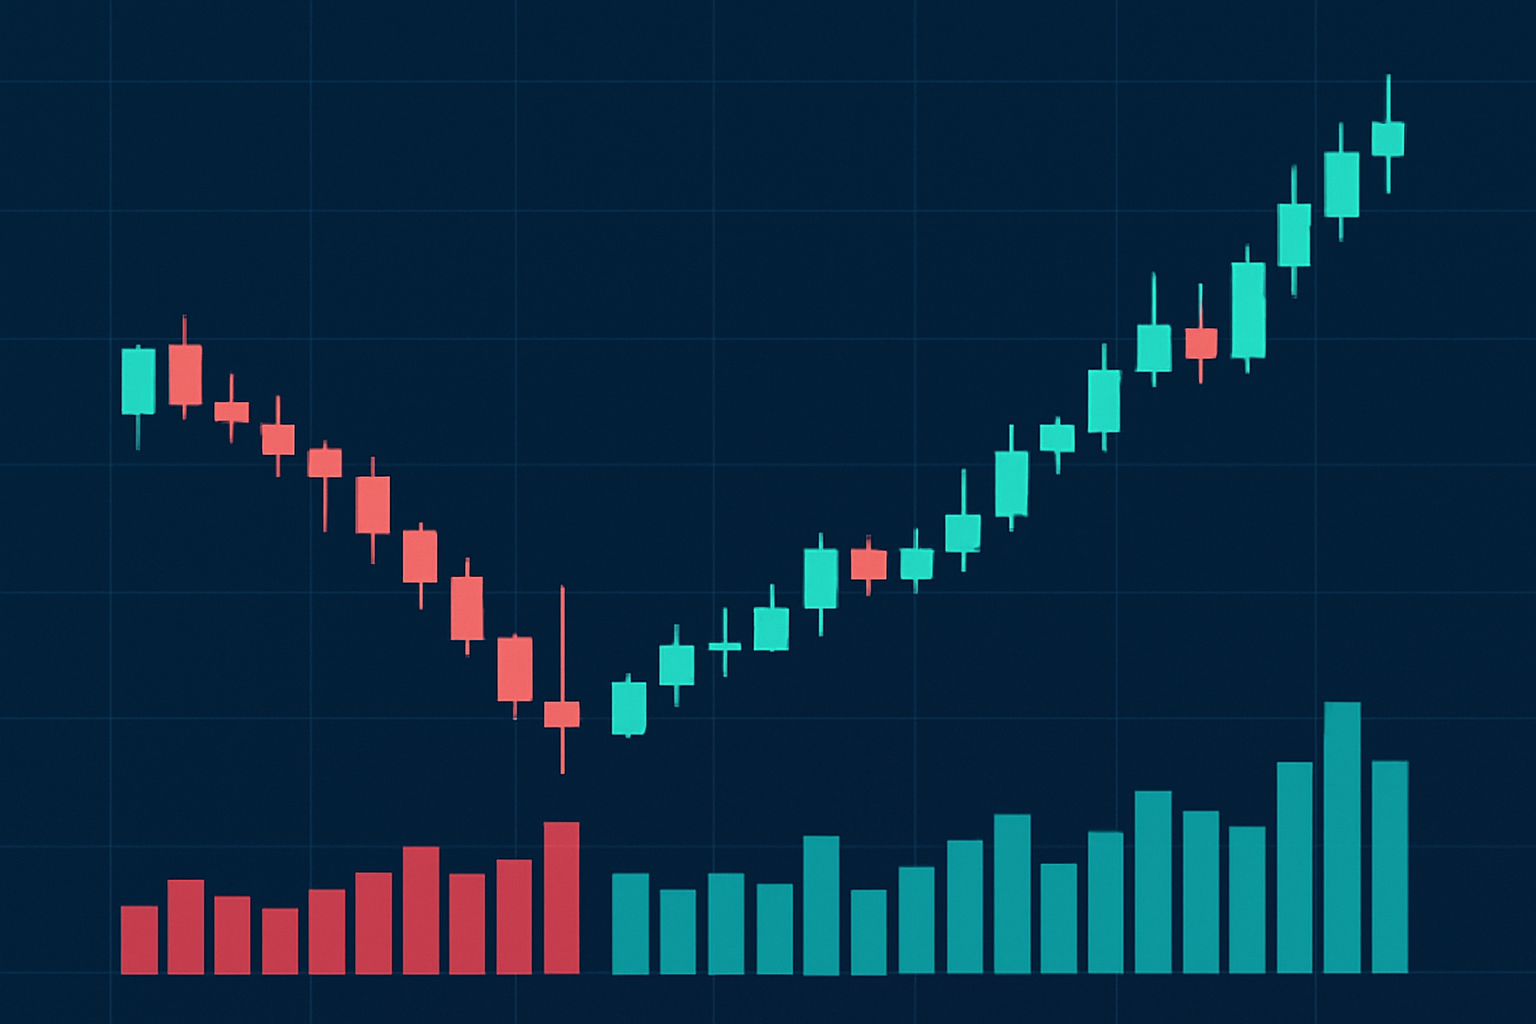
Chart example illustrating an inverted hammer pattern followed by confirmation with bullish price action and increased volume.
The inverted hammer popped up after several days of falling prices. Traders on platforms like TradingView quickly picked up on the pattern displayed on their charts. Sure enough, the next day brought a strong bullish candle backed by higher volume. This neat confirmation nudged many to jump into long positions and seize the opportunity presented by the bullish reversal that followed.
The inverted hammer often signals a potential shift from selling pressure to buying interest after a decline. Buyers are tentatively dipping their toes into the water, testing the market’s temperature. You’ll usually want to see some solid backup—think volume spikes and price action—to really believe in a genuine reversal.

Are you tired of juggling multiple tools for your trading needs? TradingView is the all-in-one platform that streamlines your analysis and decision-making.
With its powerful charting capabilities, real-time data, and vibrant community, TradingView empowers traders like you to stay ahead of the market. Join thousands who trust TradingView for their trading success.

23 posts written
Discover what IOUs mean in finance, their role as informal debt acknowledgments, and how understandi...

Discover the bullish harami candlestick pattern—a key technical signal that can hint at trend revers...

Unlock the power of candle patterns to decode market psychology and improve your trading precision....

Learn how the harami candlestick pattern signals potential market reversals. This guide breaks down...