


Technical Analysis
Profiting from Head and Shoulders Patterns in Any Market
Unlock the power of the head and shoulders pattern with this complete guide. Learn to spot, trade, a...

Bearish divergence is a key concept in technical analysis that often gives traders a gentle nudge when a bullish trend looks like it’s running out of steam and might soon flip bearish. It happens when momentum indicators start throwing up lower highs, a clear red flag that the upward push is losing its punch. This kind of mismatch can serve as an early warning system, helping traders catch potential market reversals before they actually unfold.
Bearish divergence crops up when an asset’s price hits higher highs, but a momentum indicator like the RSI or MACD stubbornly records lower highs. This little disconnect is a hint—despite the prices climbing steadily, the buying pressure is quietly running out of steam.
Imagine the price as a runner picking up speed, pushing toward new highs. The momentum indicator is the runner’s burst of energy. If the price keeps climbing but momentum starts to fade, it’s like the runner’s running out of steam.
Spotting bearish divergence usually comes down to keeping a close eye on momentum indicators that reveal the strength behind price moves. Traders often lean on the Relative Strength Index (RSI), Moving Average Convergence Divergence (MACD) and Stochastic Oscillator to get the full picture. Each of these tools brings its own way of tracking momentum shifts. RSI zeroes in on overbought or oversold conditions. MACD tracks how moving averages move together to reveal trend muscle, and the Stochastic Oscillator measures closing prices against recent ranges like a detective piecing together clues.
| Indicator Name | Basic Function | How It Shows Bearish Divergence | Typical Signal Strength |
|---|---|---|---|
| RSI (Relative Strength Index) | Measures momentum by comparing average gains and losses over a set period | Price hits higher highs while RSI peaks quietly drop lower, hinting that the momentum's starting to lose steam | Moderate to Strong |
| MACD (Moving Average Convergence Divergence) | Indicates momentum by comparing short-term and long-term moving averages | MACD line or histogram fails to keep up with price’s climb, making lower highs that whisper caution | Strong |
| Stochastic Oscillator | Compares the closing price to the overall price range over time | Stochastic peaks shrink even as price marches upwards, a subtle nudge that buying pressure is fading | Moderate |
Each momentum indicator shines a light on a different corner of market strength so divergences often throw up signals you really don’t want to ignore. RSI steps in to flag when a market could be tipping into overbought territory. MACD catches those subtle shifts in trend that might otherwise slip by and Stochastics keep tabs on momentum relative to price ranges.
Traders aiming to spot bearish divergence often take a cautious route, keeping a close eye on both price action and momentum indicators simultaneously. This double-checking approach usually bumps up accuracy and provides more solid confirmation before pulling the trigger on trades.
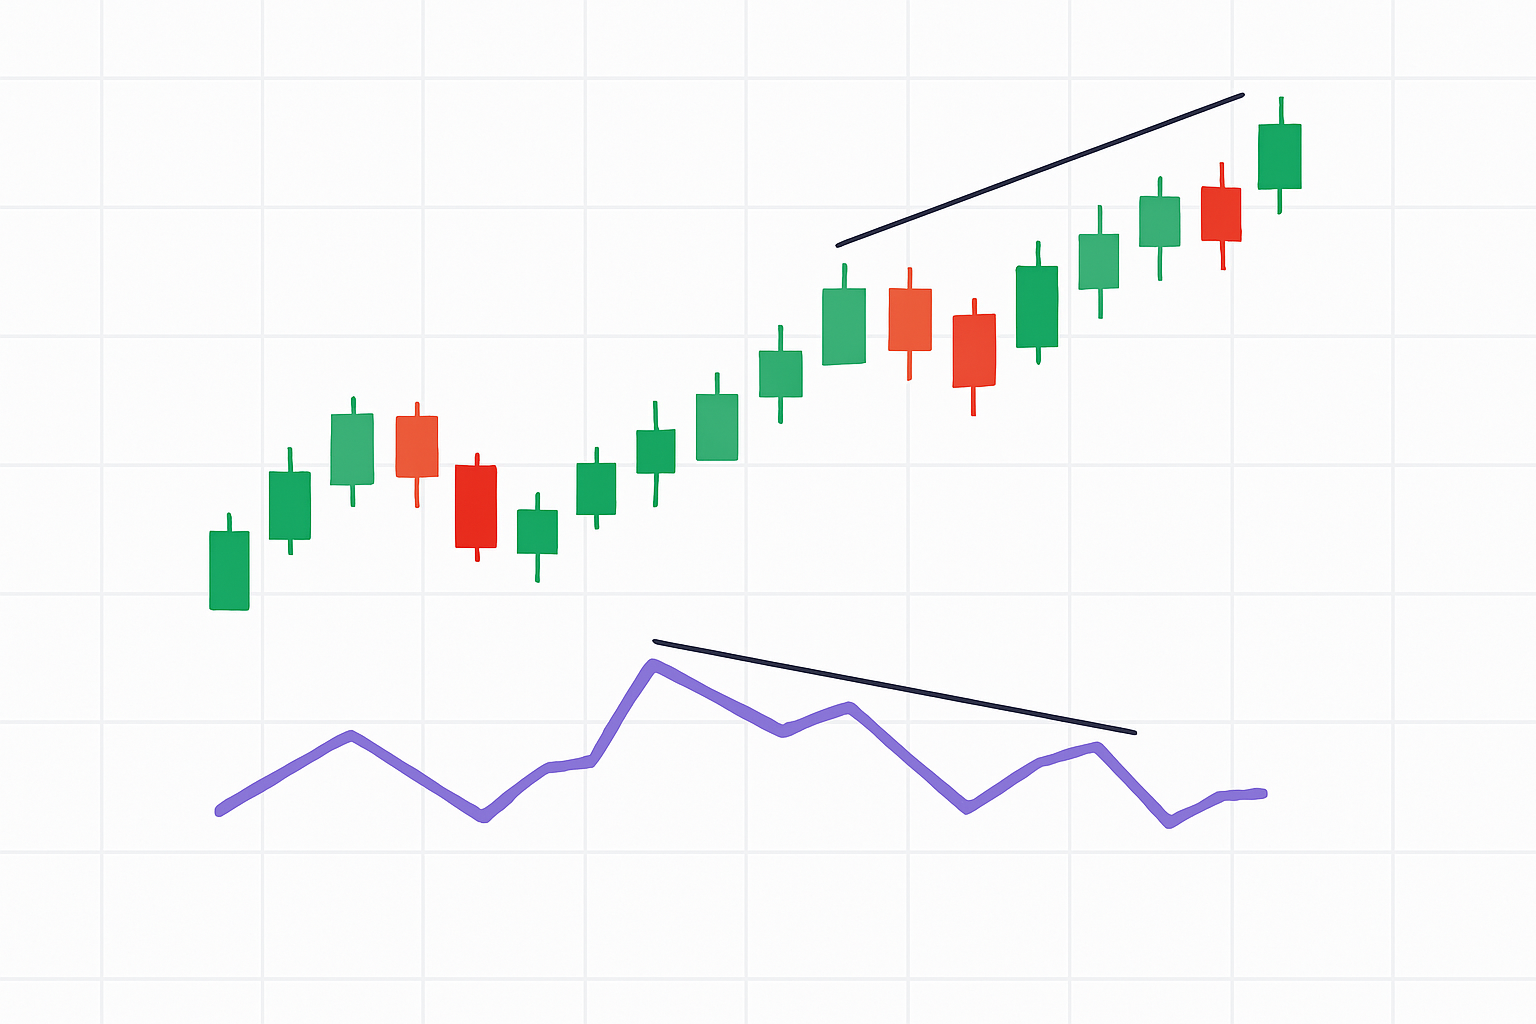
Start by spotting recent higher highs on the price chart and mark those key peaks carefully.
Next, take a peek at your momentum indicator chart to find highs that match those price peaks—it's like matching puzzle pieces.
Make sure the indicator forms lower highs while the price pushes to higher highs.
Don’t stop there—look for extra confirmation by checking volume analysis or watch for chart patterns, especially bearish candlestick formations that often give you a heads-up.
Finally, map out your entry or exit plan. Lean on these confirmation signals and stick to solid risk management before you pull the trigger on the trade.
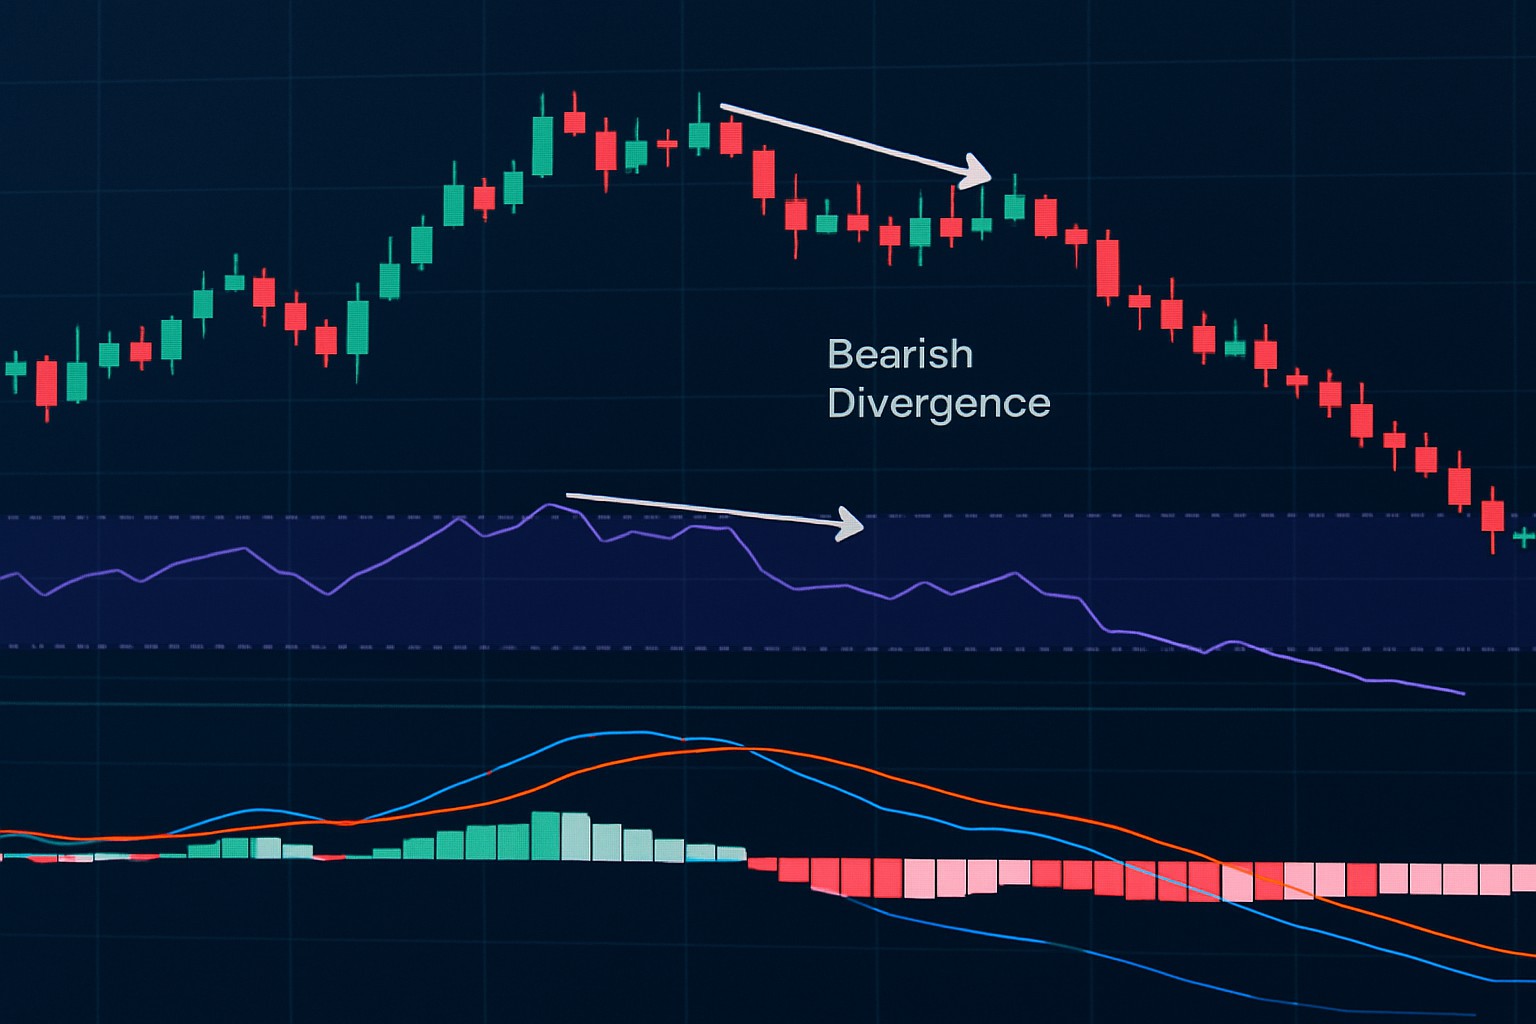
Example candlestick chart displays price reaching higher highs while RSI momentum indicator forms lower highs, clearly illustrating bearish divergence in a real trading scenario.
The chart clearly shows a noticeable divergence: prices are hitting higher highs, while the RSI indicator's peaks are quietly creeping lower. This little disconnect often hints at weakening buying momentum—kind of a red flag waving before prices decide to take a tumble.
Bearish divergence signals a vital moment when momentum starts to slip away, even though prices are still making their way up. It often acts as an early warning that the current trend might be ready to take a turn. This pattern really shines a light on shifts in trader sentiment and psychology while prices keep climbing, the energy and conviction behind those gains begin to fade.
Bearish divergence acts like an early warning signal—think of it as that annoying dashboard light flickering on before your engine starts making weird noises. It doesn’t guarantee something’s about to blow up, but it definitely nudges you to pay closer attention and maybe brace yourself for a bumpy ride ahead.
Bearish divergence can be a powerful technical indicator but it does not work like clockwork every time. Traders should keep its limitations in mind and avoid assuming divergence always means a trend reversal or ignoring the bigger market context. Sometimes these signals throw false alarms, especially when markets have strong trends and momentum swings are part of the daily grind.
Dodge the usual pitfalls by considering bearish divergence with volume analysis, trendlines and key support and resistance levels while keeping an eye on the bigger market picture. Make sure to double-check your signals with different indicators and use stop-loss orders to keep risk firmly in check.
Effectively using bearish divergence is about combining it with other technical analysis tools and solid risk management techniques. I have found that watching volume patterns helps confirm when a trend is losing its punch. Pairing divergence signals with clear support and resistance levels makes trade setups more reliable like having a seasoned co-pilot on board. Using multiple momentum indicators and carefully placing stop-loss orders helps keep risk under control.
Keep an eye out for bearish divergence especially when volume patterns suggest that buying pressure might be fading.
Combine those divergence signals with key support or resistance levels because this really sharpens the quality of your trade entries.
Use a mix of momentum indicators like RSI and MACD together for strong confirmation of those divergence signals.
Set your stop-loss orders just a little beyond recent support points as a smart way to control potential losses.
Adjust your trade size based on your confidence in the divergence signal and the current market mood.
Taking a stroll down memory lane with historical market data often reveals handy clues about bearish divergence and its knack for signaling early reversals. Take the 2021 cryptocurrency boom for instance: Bitcoin's price was hitting fresh all-time highs but the RSI indicator didn’t keep pace like before. That little mismatch—bearish divergence—came just before a meaningful correction and gave sharp-eyed traders a valuable heads-up to shuffle their positions. On a similar note, major stock market indices showed divergence signals on the MACD ahead of the hefty pullbacks in 2022.
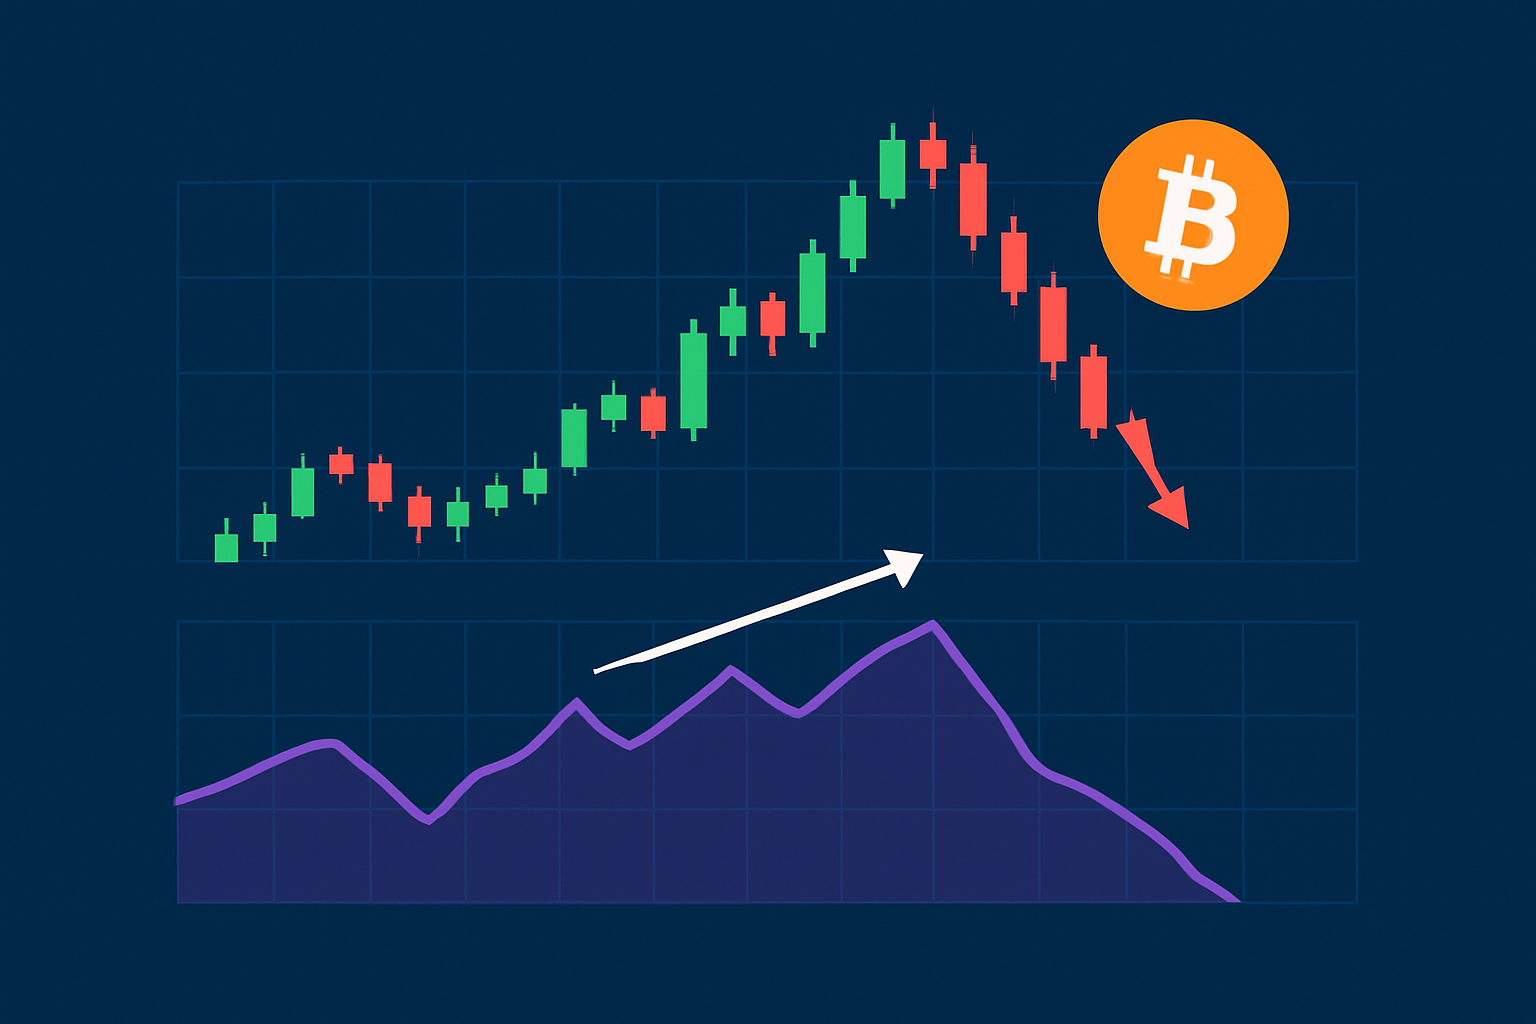
A historical Bitcoin price chart highlighting bearish divergence where RSI fails to reach new highs while price makes higher peaks, preceding a market correction.
The example chart paints a clear picture of Bitcoin’s price hitting fresh highs while the RSI stubbornly forms lower peaks, signaling a classic bearish divergence. Once this little red flag popped up, the price took a sharp nosedive.

Tired of missing opportunities and making suboptimal trading decisions? TrendSpider's cutting-edge platform automates complex technical analysis, saving you time and reducing human error.
With multi-timeframe analysis, dynamic alerts, backtesting, and customizable charting, you'll gain a competitive edge in identifying trends and making informed trades across global markets.

23 posts written
Unlock the power of the head and shoulders pattern with this complete guide. Learn to spot, trade, a...

Discover what IOUs mean in finance, their role as informal debt acknowledgments, and how understandi...

Learn how the harami candlestick pattern signals potential market reversals. This guide breaks down...

Discover the doji candlestick—a powerful price action signal revealing market indecision. This begin...