


Technical Analysis
IOU Meaning in Finance
Discover what IOUs mean in finance, their role as informal debt acknowledgments, and how understandi...

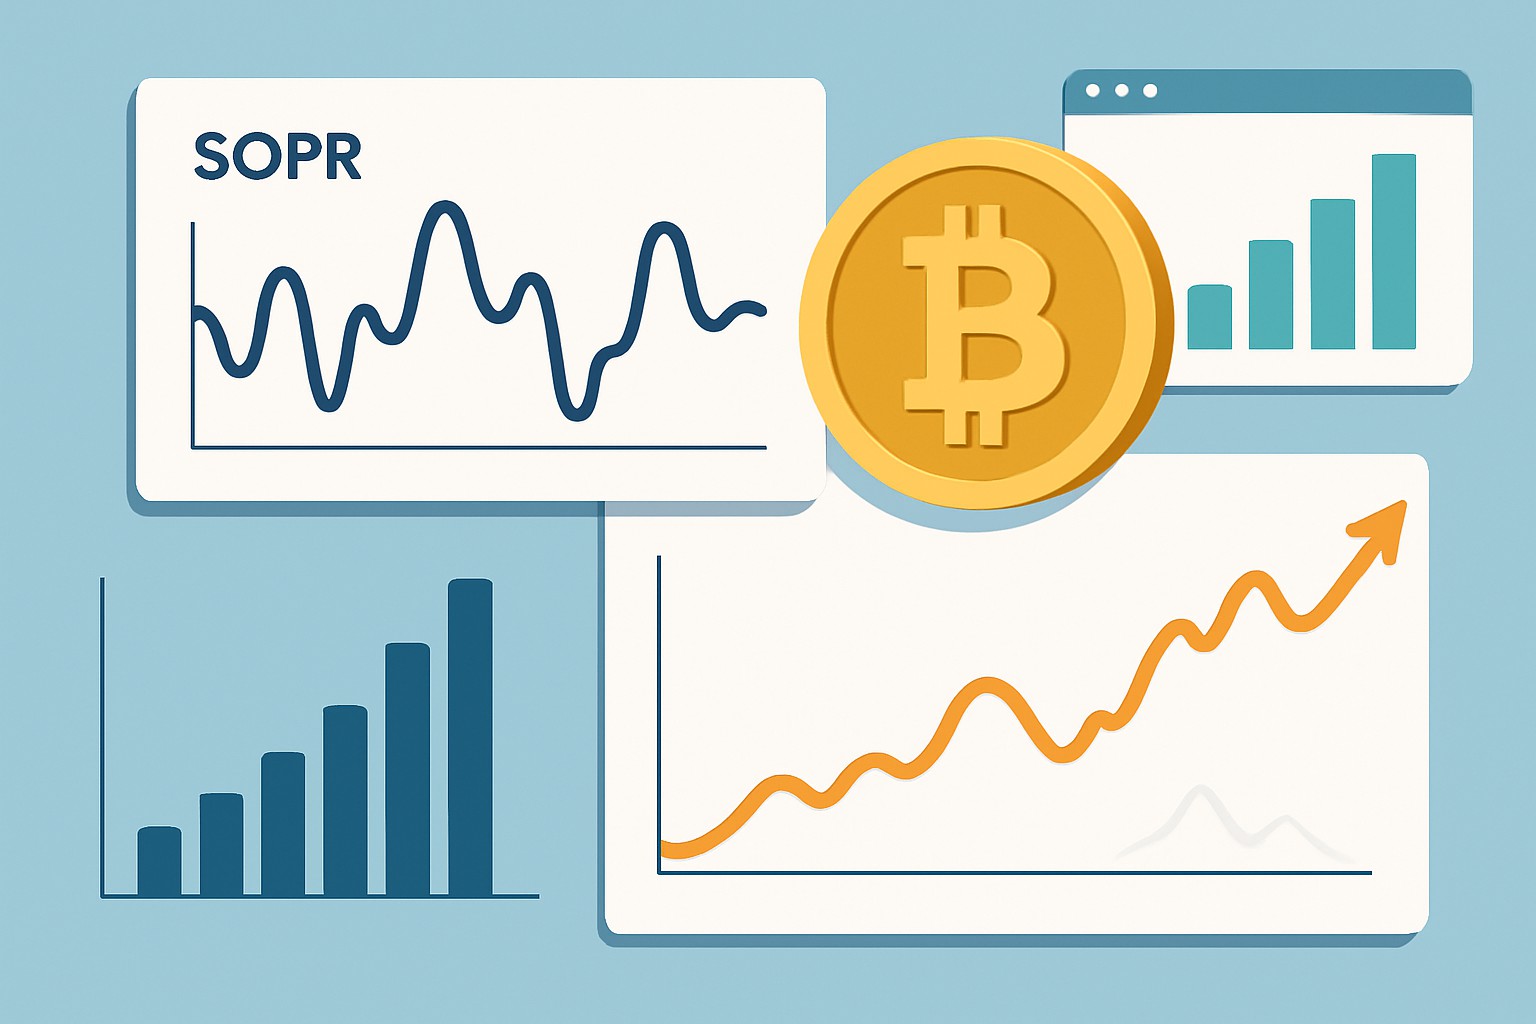
The SOPR (Spent Output Profit Ratio) metric is a well-known technical indicator in Bitcoin and cryptocurrency investing that tracks the profit made or loss taken whenever coins change hands on the blockchain. While it packs some pretty valuable insights, SOPR can feel a bit like decoding a secret language to beginners.
SOPR stands for Spent Output Profit Ratio. It’s a nifty little metric that tells you whether people are making a profit or a loss when they move or spend coins on the blockchain, by comparing the price they’re selling at to what they originally paid.
SOPR acts like a trusty thermometer gauging the market's overall vibe when it comes to profits. When SOPR is above 1 it suggests coins are generally being sold for a gain—nice little wins all around. On the flip side when it dips below 1 holders often face losses which isn’t exactly a walk in the park.
The SOPR formula is straightforward enough but it really hinges on grasping its individual parts. You figure it out by dividing the price of coins at the moment they’re spent by the price those same coins were bought at in the first place.
| Term | Description | Example Value |
|---|---|---|
| Spent Output Price | The value at which the coins were spent or sold, basically what they fetched in the market | $50,000 |
| Coin Purchase Price | The price at which the coins were originally bought, the amount that first changed hands | $40,000 |
| Computed SOPR | The ratio of Spent Output Price to Purchase Price, giving a quick snapshot of profit or loss — here it’s 50,000 / 40,000, which comes out to 1.25 |
This calculation captures the general hustle and bustle of coins changing hands at any moment. When many holders sell above their purchase price, SOPR usually climbs above 1 signaling profits are being pocketed. Conversely, if coins trade below their original cost, SOPR dips below 1 which is a clear sign that losses are hitting the books.
SOPR comes in a few different flavors each tailored to suit various analytical needs. The raw SOPR gives you a quick snapshot but can be a bit noisy—like tuning into a radio station with static. The 7-day moving average SOPR smooths out wild fluctuations and makes the underlying trends easier to spot. Then there is the adjusted SOPR which filters out short-term holders who moved coins within the last hour and highlights the actions of longer-term investors.
Understanding these differences can really help investors and analysts pick the SOPR type that best suits their trading style. For example, a day trader usually leans toward the raw SOPR for quicker signals while a long-term investor tends to stick with the adjusted or 7-day average SOPR to avoid getting spooked by short-term noise.
SOPR is a pretty important metric because it gives us a clear window into market psychology, revealing whether investors are busy locking in profits or cutting their losses. This insight can hint at whether the market is flirting with a peak—think lots of profit-taking—or stumbling towards a bottom where losses start to sink in. It also helps shed light on just how strong a bull or bear market really is by tracking how profit-taking matches up with price swings.
SOPR acts as a handy, broad-brush signal of profit-taking in the market, giving investors a clearer sense of when greed is calling the shots versus when fear has taken the wheel. It transforms on-chain data into insights that don’t just sit there—they actually help you make sense of the noise.
To really squeeze the most insight out of SOPR investors should pair its signals with other indicators like volume and price trends—kind of like having a trusted crew rather than sailing solo. Keeping an eye on SOPR as it crosses key thresholds especially the vital 1 mark can sharpen your sense of the right moments to buy or sell.
Keep an eye on the SOPR value as it crosses above or dips below
This often signals a shift in market profit sentiment and feels like a subtle mood swing in the market’s behavior.
Pair SOPR trends with price movements and trading volume to create a clearer, more complete picture of where the market might be headed. Think of it as connecting the dots instead of relying on a single clue.
When SOPR stays below 1 for a long time, it usually hints at a possible market bottom. This often means traders are giving up, which is a classic sign of capitulation.
Don’t rely on SOPR alone; it works best when combined with other momentum or trend indicators. It’s like a trusty sidekick helping the hero shine brighter.
Using adjusted or moving average versions of SOPR helps filter out short-term noise and makes your signals more reliable and your life a bit easier.
When SOPR dips below 1 and lingers there as prices take a nosedive many investors interpret this as a classic capitulation sign—kind of like the market throwing in the towel—that could hint at a potential bottom forming. Conversely if SOPR suddenly shoots above 1 during a rally it is often a cue for profit-taking which may lead to a breather or slight pullback.
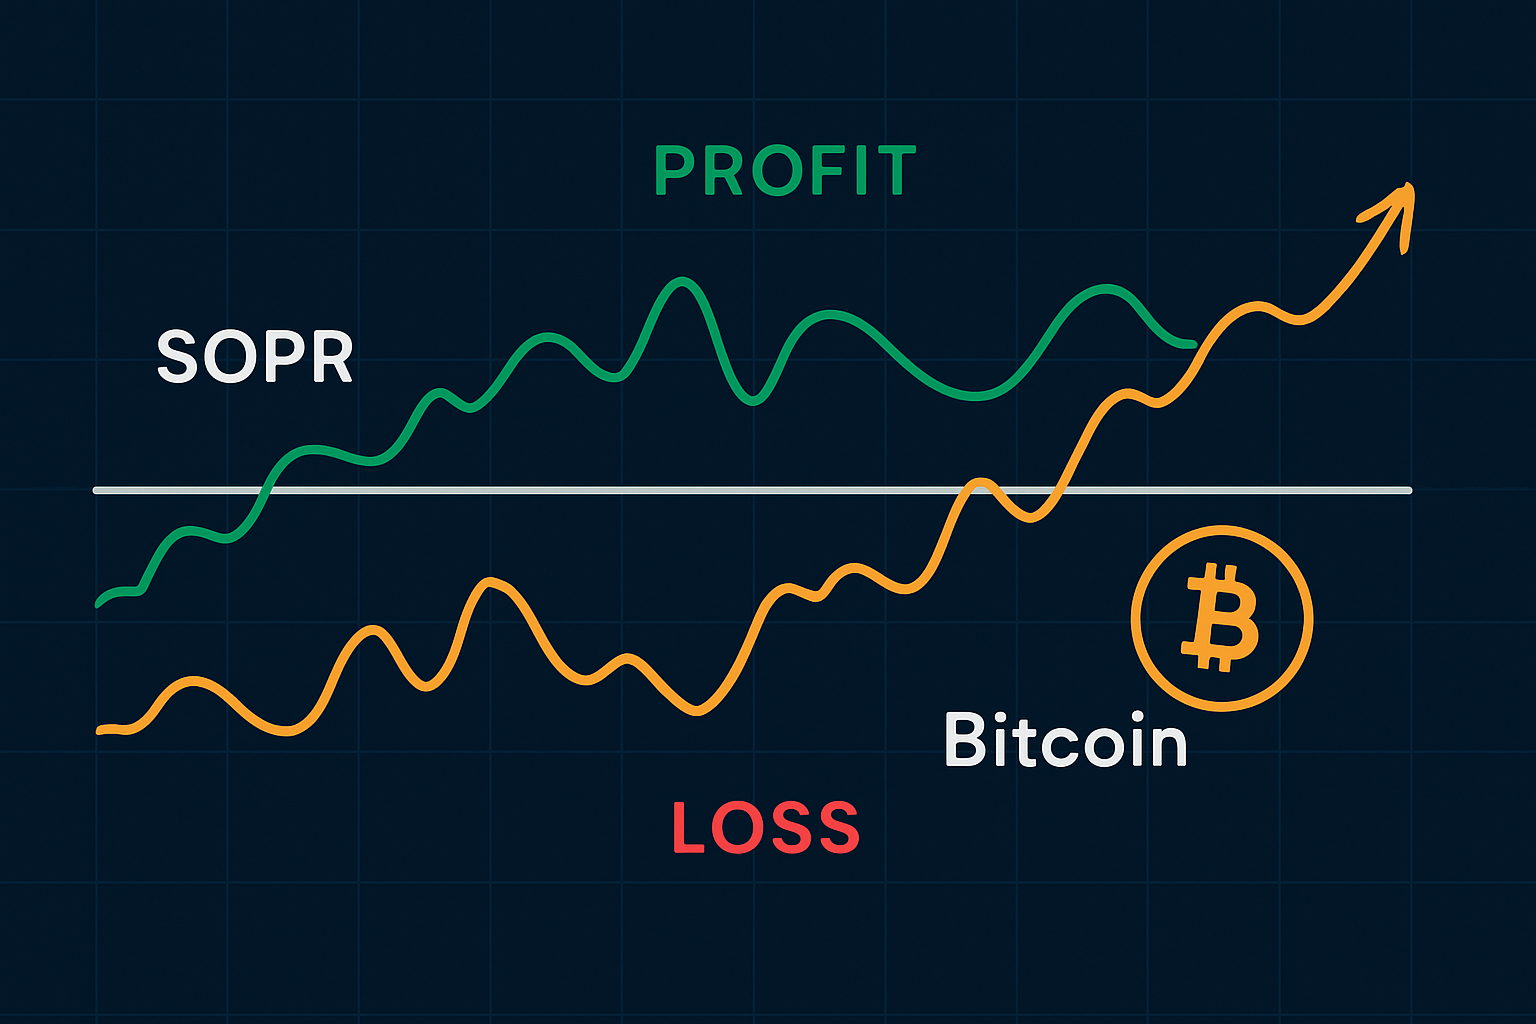
Visual chart illustrating the relationship between SOPR values and Bitcoin price fluctuations over time
SOPR is definitely a handy metric to have in your toolkit, but I’ve noticed there’s quite a bit of confusion surrounding it. Some individuals tend to think SOPR alone can magically pinpoint price reversals to the exact moment, or that any reading dipping below 1 is an automatic green light to buy. What often slips under the radar is how market cycles and different time frames can really change the way you should read it.
When you think of SOPR as just one piece in the bigger, more intricate puzzle of market analysis it really helps investors dodge those all-too-common slip-ups. Getting a grip on its nuances alongside the broader market vibes is key if you want to squeeze the most value out of it
On-chain metrics like SOPR have been evolving quickly thanks to improved access to blockchain data and impressive analytics techniques. These days artificial intelligence and machine learning are stepping up their game and giving these metrics a sharper edge and a bit of a crystal-ball vibe for predictions.
Future updates will likely roll out dynamic tweaks tuned to market conditions, alongside cross-chain sopr calculations to provide more comprehensive insights.

Are you tired of juggling multiple tools for your trading needs? TradingView is the all-in-one platform that streamlines your analysis and decision-making.
With its powerful charting capabilities, real-time data, and vibrant community, TradingView empowers traders like you to stay ahead of the market. Join thousands who trust TradingView for their trading success.

19 posts written
Discover what IOUs mean in finance, their role as informal debt acknowledgments, and how understandi...

Unlock the power of the bear flag pattern with our practical, step-by-step guide. Understand market...

Master the hammer candlestick pattern—a key indicator for market reversals. This beginner-friendly g...

Discover the doji candlestick—a powerful price action signal revealing market indecision. This begin...