


Technical Analysis
Most Important Candle Patterns Every Trader Should Know
Unlock the power of candle patterns to decode market psychology and improve your trading precision....

Discover the value of candlestick patterns with this handy candlestick patterns cheat sheet designed to sharpen your technical analysis skills. You’ll soon find yourself spotting key formations that often hint at market reversals or continuations and important entry and exit points with surprising ease. This guide spills insider tips and practical tricks that go beyond the basics to help you make smarter and more confident decisions and boost your trading accuracy.
Candlestick patterns paint a vivid picture of price movements on a chart, capturing the constant tug-of-war between buyers and sellers. They offer valuable clues into market sentiment and momentum, giving traders a bit of an edge when it comes to anticipating future price swings and spotting those all-important turning points
Certain candlestick patterns have earned a reputation for being pretty reliable and popping up frequently, which makes them essential tools in solid technical analysis. Getting the hang of spotting these fundamental patterns on the fly can really give you a leg up in reading market moves early and making smarter trading decisions.
Jumping into trades based solely on candlestick patterns can often trip you up. Savvy traders tend to wait for a little backup like volume spikes, key price levels or other indicators to stack the odds more in their favor. This kind of confirmation is like having a trusty sidekick because it helps cut through the market noise and reduces those pesky false signals.
Check if the pattern pops up near key support or resistance levels since that often gives it a bit more muscle in terms of reliability.
Look for a nice bump in volume to confirm the pattern you want to see some real market interest backing the move.
Use trend strength indicators like ADX or RSI to double-check that they’re actually lining up with your trade idea.
Hold tight and wait for the next candle to confirm the pattern’s direction before jumping into a trade it’s usually worth the patience.
Combine those pattern signals with moving averages which can be pretty handy to filter out the pesky false breakouts.
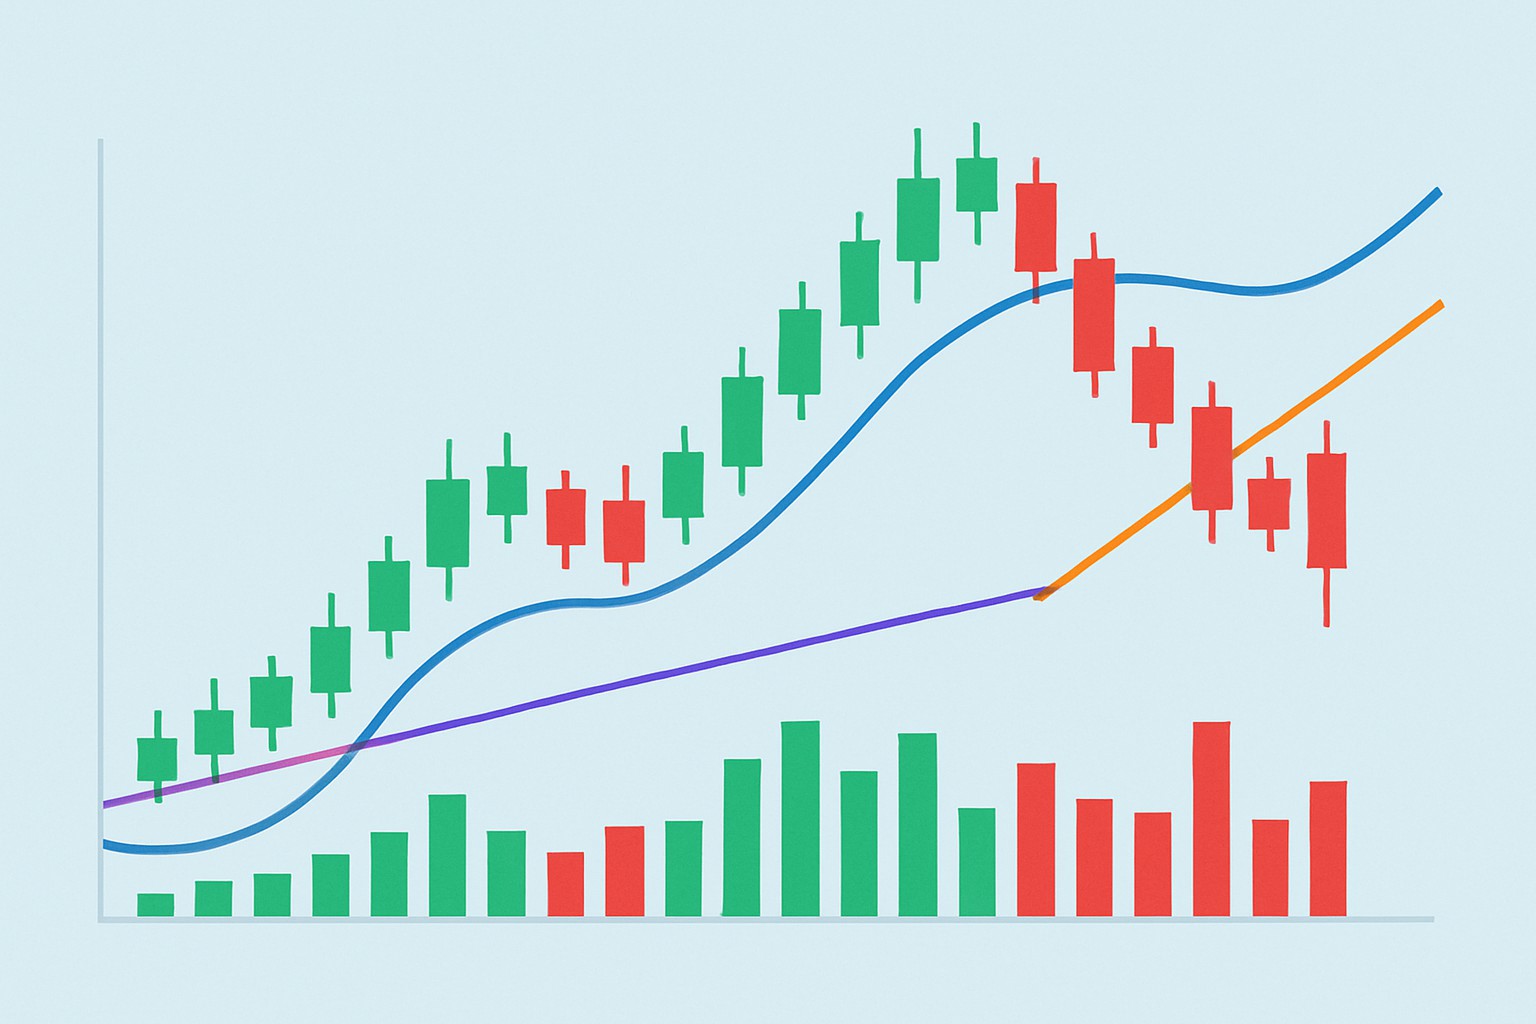
A detailed candlestick chart showcasing common patterns, volume spikes, and moving averages to illustrate pattern confirmation strategies.
Seasoned traders don’t just stop at spotting obvious patterns. They weigh candles by body size and hunt for clusters of patterns. They also keep a sharp eye on subtle hints hidden in shadow lengths to find better entry points and avoid traps. Use Fibonacci retracement levels and consider volume divergences alongside patterns for a sharper edge in precision and timing.
Building a personalized cheat sheet can truly speed up your learning curve and smooth how you analyze the market. It’s best to focus on patterns that matter to your specific markets and trading style. Use clear visuals whenever possible. Jot down the key conditions and outcomes for each pattern and keep that sheet fresh by updating it as your understanding deepens.
Collect a list of your go-to candlestick patterns that click with your trading style.
Toss in clear eye-catching examples of each pattern paired with brief easy-to-grasp descriptions for quick reference.
Break down the typical market vibes and possible outcomes you might see when one of these patterns pops up.
Shine a spotlight on important context like the current trend, shifts in volume and support or resistance zones.
Keep your cheat sheet fresh by adding new patterns or nuggets of wisdom you pick up along the way during your trades.
| Pattern Name | Type | Typical Location | Confirmation Tips | Reliability Rating |
|---|---|---|---|---|
| Doji | Reversal | Tops & Bottoms | Keep an eye out for a volume spike and a candle that backs it up—these usually tell the real story | Medium |
| Hammer | Reversal | Bottoms | Often pops up near support levels, especially when volume shows a nice little uptick | High |
| Shooting Star | Reversal | Tops | Best to wait for a test of resistance to really trust this one | High |
| Engulfing (Bullish/Bearish) | Reversal | Tops & Bottoms | A solid, strong volume on the engulfing candle is the secret sauce here | High |
| Morning Star | Reversal | Bottoms | The candle following it should give you that confirming nod to the trend change | High |
| Evening Star | Reversal | Tops | Patience pays off—wait for a confirming candle before calling it | High |
| Piercing Line | Reversal | Bottoms | Volume confirmation usually lends a helpful hand here | Medium-High |
| Dark Cloud Cover | Reversal | Tops | Look for price rejection as your green light for confirmation | Medium-High |
| Tweezer Tops/Bottoms | Reversal | Tops or Bottoms | When volume teams up with nearby support or resistance, that’s your confirmation duo | Medium |
| Doji Continuation | Continuation | Mid-trend | Usually, trend indicators need to chime in to seal the deal | Medium |
| Three White Soldiers | Continuation | Uptrend | Strong volume and momentum make this pattern sing | High |
| Three Black Crows | Continuation | Downtrend | Check volume and RSI signals like oversold or overbought to back up this bearish call | High |
Even seasoned traders can sometimes trip up on candlestick patterns when they lose sight of the bigger picture or lean too heavily on a single setup without proper confirmation. Misreading these signals tends to lead straight into a pit of losses and frustration—believe me, it is happened to the best of us.
Getting to know candlestick patterns involves wrapping your head around a few essential terms from a candlestick patterns cheat sheet. The body represents the distance between the open and close prices. The wick or shadow shows the highest and lowest prices reached during the day beyond that body. A bullish candle closes higher than it opened and signals buyers had the upper hand. A bearish candle closes lower showing sellers took control.

Tired of missing opportunities and making suboptimal trading decisions? TrendSpider's cutting-edge platform automates complex technical analysis, saving you time and reducing human error.
With multi-timeframe analysis, dynamic alerts, backtesting, and customizable charting, you'll gain a competitive edge in identifying trends and making informed trades across global markets.

14 posts written
Unlock the power of candle patterns to decode market psychology and improve your trading precision....

Master the hammer candlestick pattern—a key indicator for market reversals. This beginner-friendly g...

Discover the doji candlestick—a powerful price action signal revealing market indecision. This begin...

Discover the bullish harami candlestick pattern—a key technical signal that can hint at trend revers...