


Technical Analysis
How to Spot a Hammer Candlestick in Trading Charts
Master the hammer candlestick pattern—a key indicator for market reversals. This beginner-friendly g...

The descending wedge pattern often takes center stage in technical analysis when you are on the hunt for potential bullish reversals. It shows up quite a bit, yet it can be a bit of a slippery fish for beginners since its price movements and the way you read them are pretty subtle.
A descending wedge is a distinct chart pattern that forms when two trendlines slope downwards and squeeze the price action in between. Unlike typical bearish setups, this pattern often hints that selling pressure might be losing steam and points to a potential bullish turnaround just around the corner.
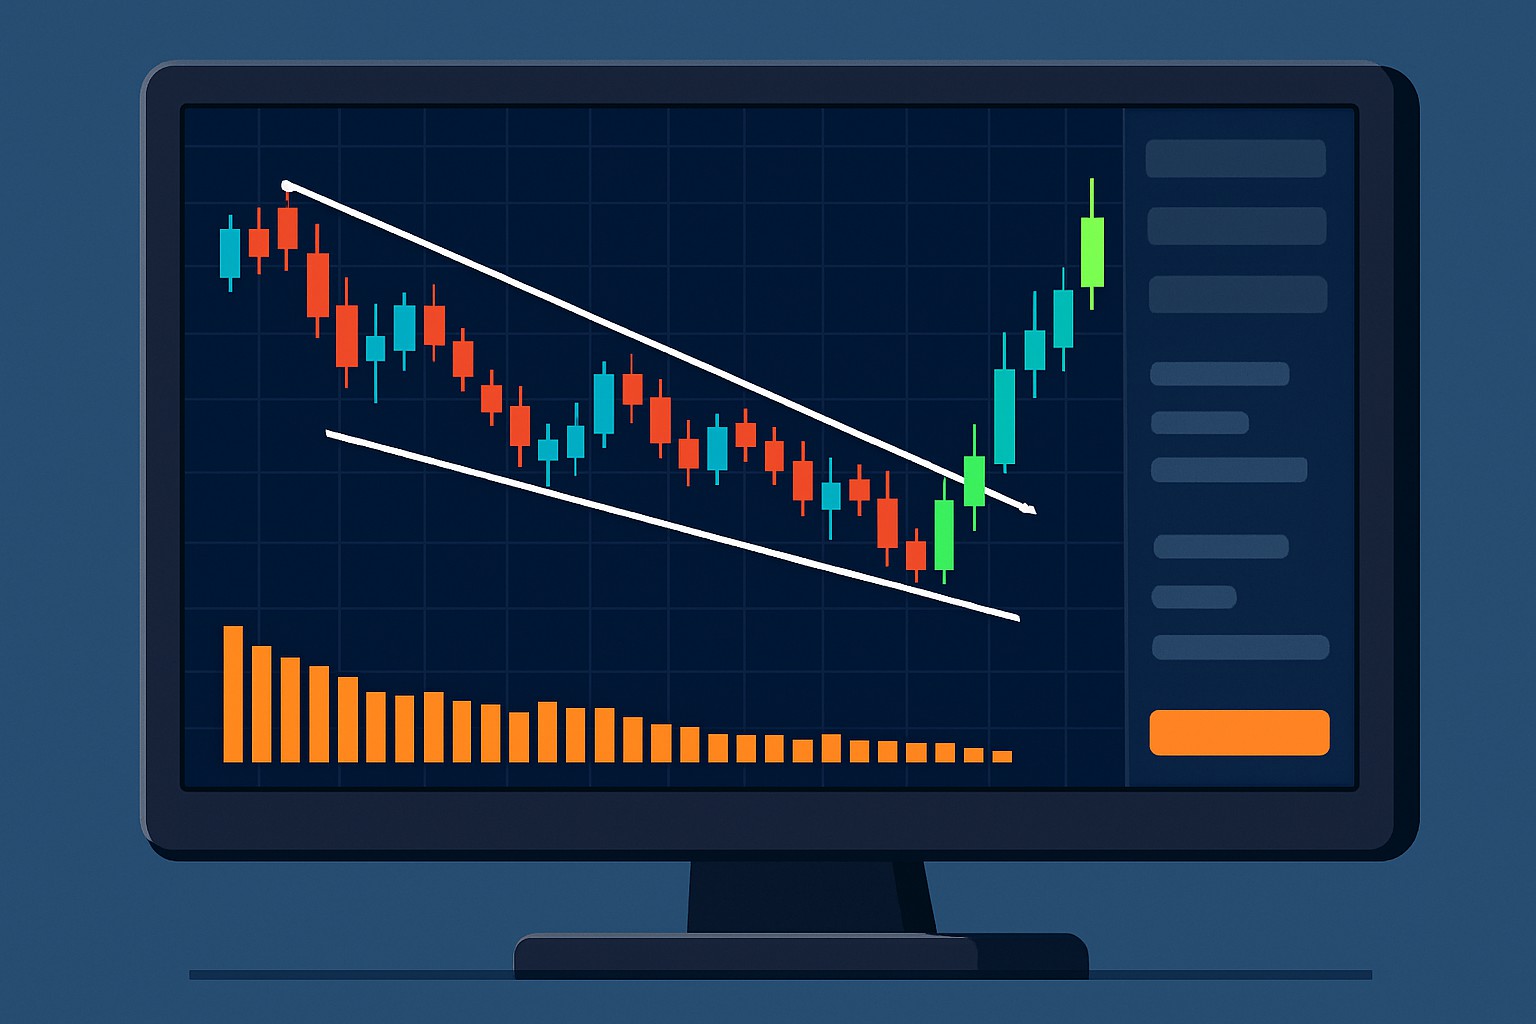
Seeing a descending wedge on a price chart really brings the concept to life. Two downward-sloping trendlines inch closer gradually forming that distinctive wedge shape. Inside this wedge the highs and lows start to squeeze tighter almost like they’re getting cozy. Meanwhile volume usually takes a breather and drops off hinting that the selling pressure is losing steam. More often than not the breakout bursts upward with a noticeable spike in volume, kind of like buyers finally deciding it’s their turn to jump in.
Descending wedge pattern shown on a stock price chart with converging trendlines and volume behavior
Let’s dive into the nuts and bolts of the descending wedge—an intriguing pattern that often catches traders’ eyes. This formation usually signals a shift, where price action gradually squeezes tighter, and initially, it might feel like you’re watching paint dry. Yet, once it plays out, it has a sneaky way of leading to a breakout that can really shake things up. Keep your wits about you, because despite looking bearish at first glance, this pattern can actually hint at a bullish turnaround.
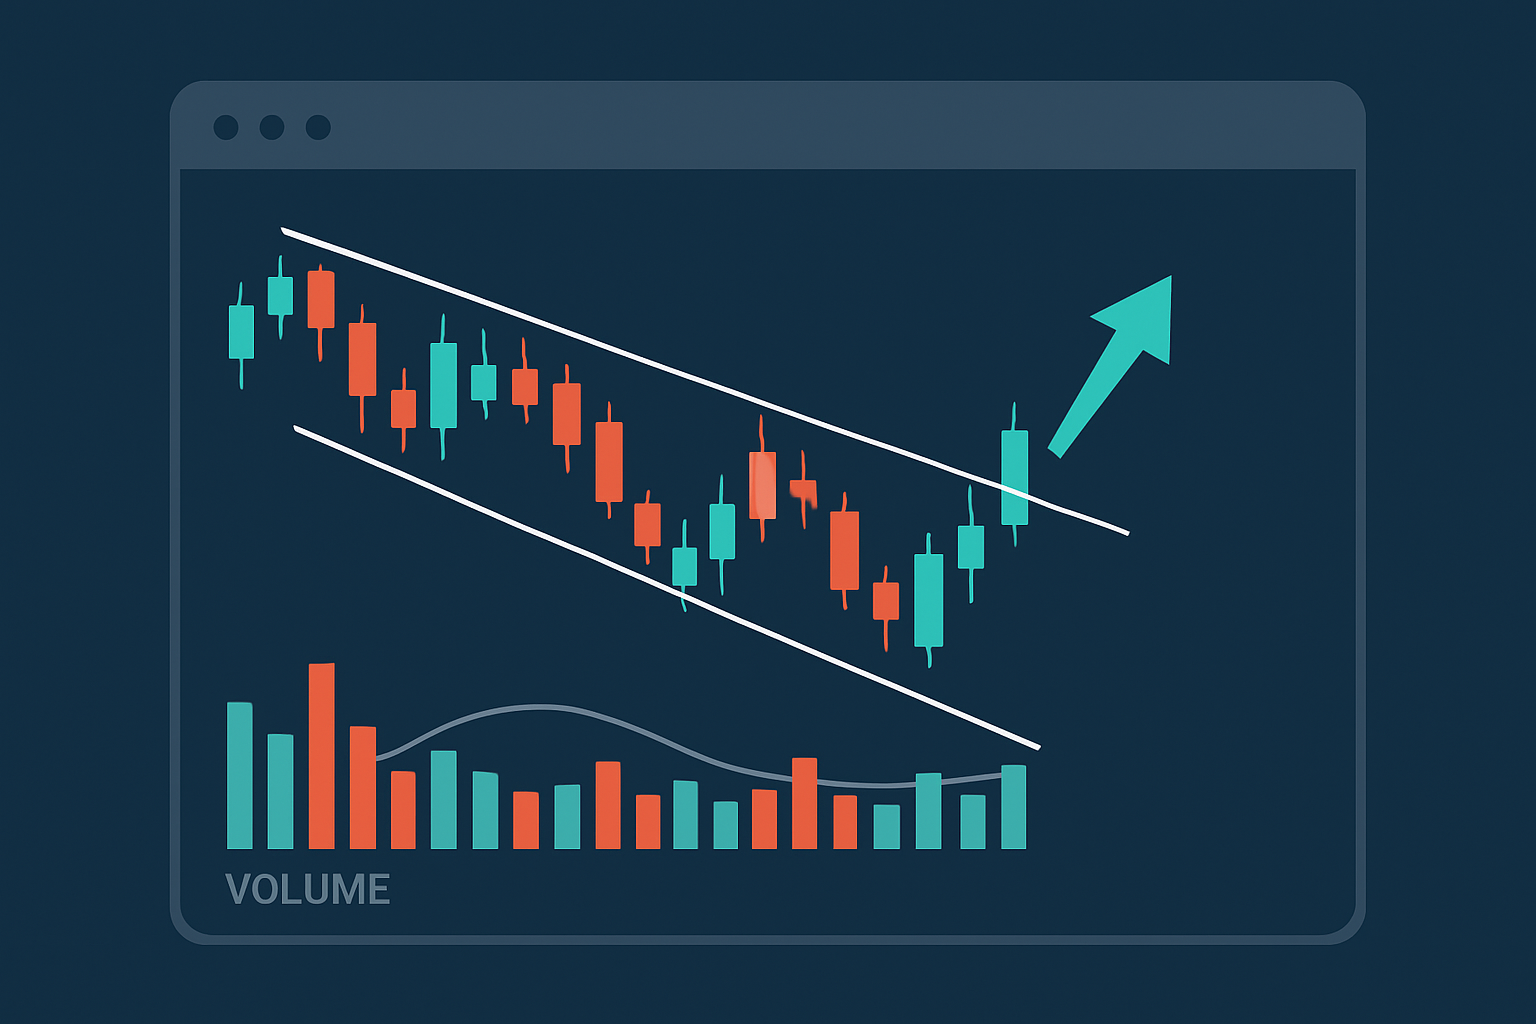
The descending wedge paints an interesting picture of market sentiment where the selling pressure is gradually losing steam. Prices are making lower highs and lows on shrinking volume like a reluctant dance where sellers are starting to loosen their grip. Meanwhile, buyers appear to be gearing up and ready to jump in and take the reins. They often pave the way for an upward breakout.
A descending wedge often signals that the bearish momentum is losing steam, creating the perfect backdrop for buyers to jump in and gently nudge the trend upward.
Spotting a descending wedge demands a keen eye and some careful chart analysis. Keeping an eye on price movements across various timeframes usually gives you a more reliable read, in my experience. Throwing volume and momentum indicators into the mix to confirm the pattern is a great way to cut down on those pesky false signals.
Spot two downward sloping trendlines that gradually converge as the price carves out lower highs and lower lows, kind of like a narrowing funnel.
Check that the price action is squeezing tighter and tighter within these shrinking boundaries, almost as if it’s holding its breath.
Watch for a drop in volume while the wedge forms because this often hints that selling pressure might be taking a breather.
Keep a sharp eye on a breakout above the upper trendline since this move can be the first wink at a bullish reversal.
Make sure to back up that breakout with a surge in volume to confirm that the buyers are stepping in with some real gusto.
Traders often stumble over the usual pitfalls when trying to spot descending wedges. It’s easy to get tripped up by misjudging the angles of those trendlines or missing key volume signals that can throw off their entire read. Sometimes they even confuse this pattern with similar ones like descending triangles. That is a surefire way to let good opportunities slip through the cracks.
Traders often spot descending wedge patterns as handy signals to kick off bullish trades. Nailing the best entry points, setting stop losses wisely to keep risk in check and aiming for realistic targets that match the pattern's size can really tilt the odds in your favor.
Wait for the price to clearly break above the upper trendline with a strong close.
Jump into a long position once the breakout candle wraps up.
Place stop losses just below the recent swing low or a smidge beneath the wedge's lower trendline.
Aim for profit targets near previous resistance levels or by measuring the widest part of the wedge and projecting that upward.
Keep a sharp eye on volume and momentum indicators to get a feel for how strong your trade really is, and to decide the right moment for a graceful exit.
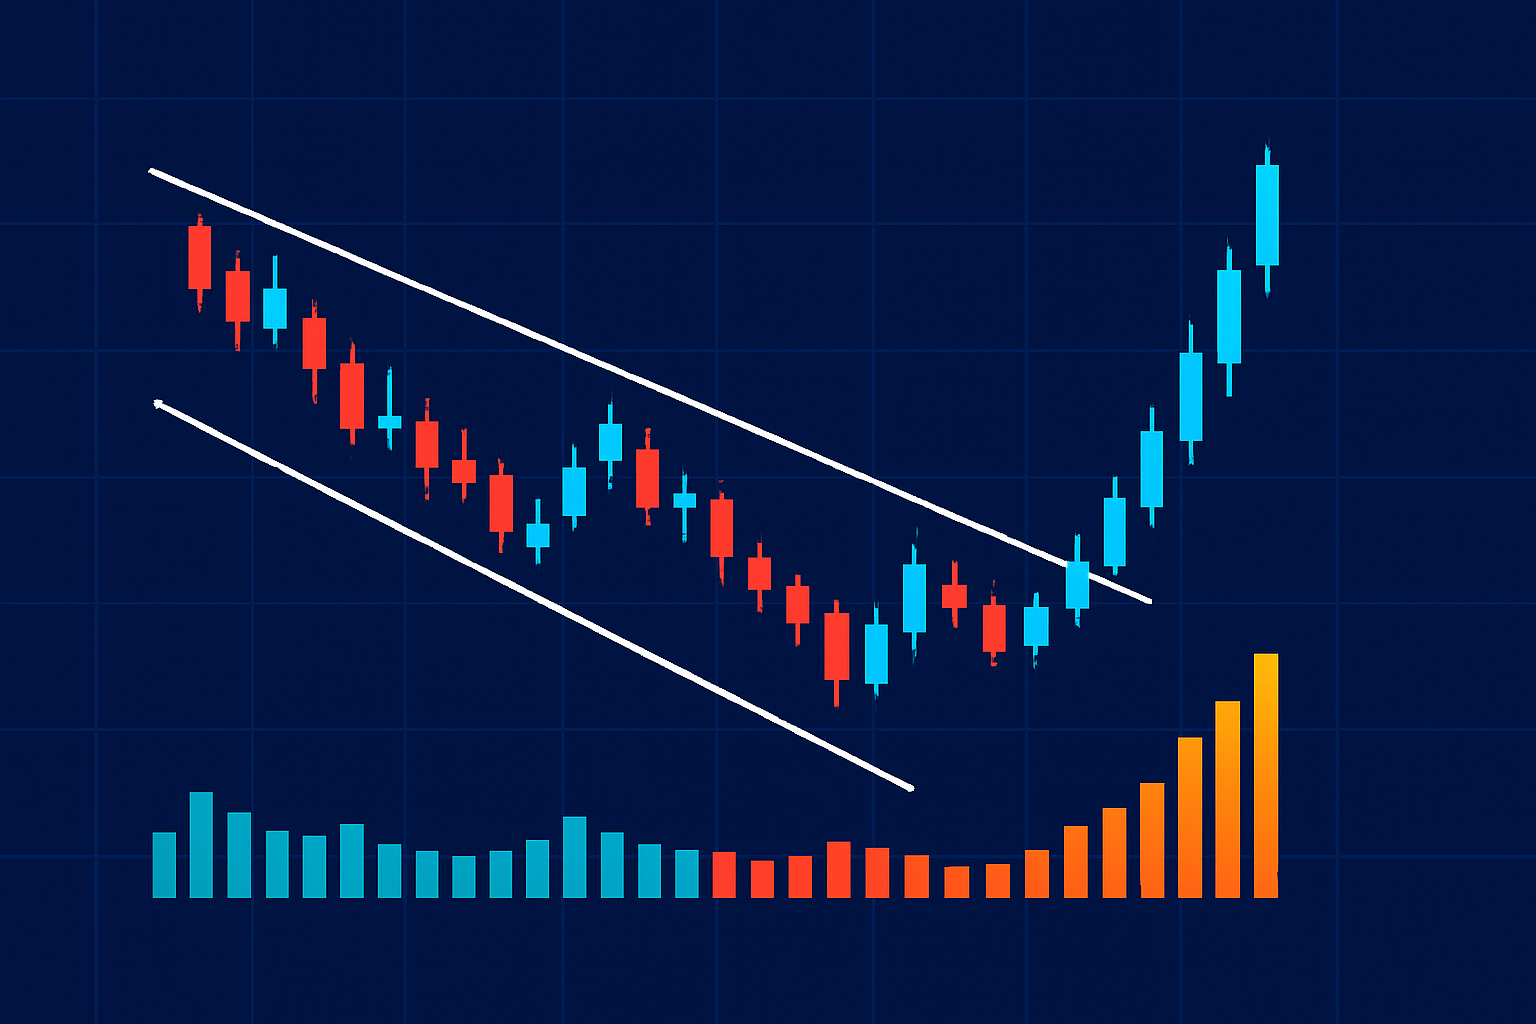
Picture a tech stock that formed a descending wedge over a few weeks with prices squeezing tighter between trendlines inching closer while volume gently tapered off. Then the stock bursts above the upper trendline with a solid surge in volume and promptly rockets up 15% in just a few days.
Annotated chart examples of descending wedge patterns leading to bullish breakouts
The descending wedge can be a handy signal but it’s far from foolproof. Traders can occasionally get caught out by false breakouts or those pesky whipsaws that sneak in unexpectedly. Its reliability really depends on the market and timeframe, so I’ve found it’s best to pair it with other indicators and take a careful look before making any moves.

Are you tired of juggling multiple tools for your trading needs? TradingView is the all-in-one platform that streamlines your analysis and decision-making.
With its powerful charting capabilities, real-time data, and vibrant community, TradingView empowers traders like you to stay ahead of the market. Join thousands who trust TradingView for their trading success.

23 posts written
Master the hammer candlestick pattern—a key indicator for market reversals. This beginner-friendly g...

Discover the doji candlestick—a powerful price action signal revealing market indecision. This begin...

Discover the bullish harami candlestick pattern—a key technical signal that can hint at trend revers...

Unlock the power of candle patterns to decode market psychology and improve your trading precision....