


Technical Analysis
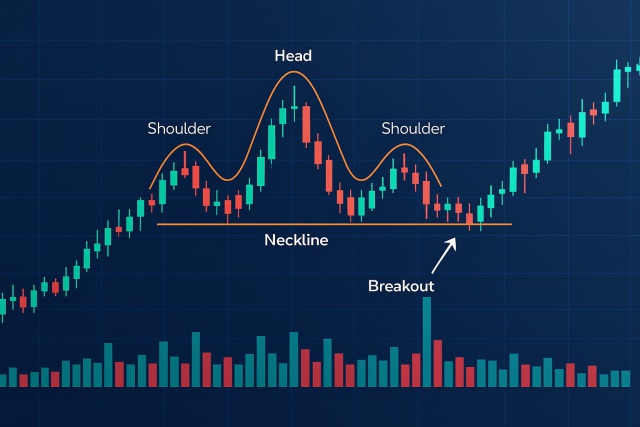
How to Spot the Head and Shoulders Chart Pattern
Discover how to confidently spot the head and shoulders chart pattern—a key indicator for trend reve...

An ascending triangle is a classic chart pattern in technical analysis that often signals a potential bullish breakout. Getting a good handle on how to trade this pattern can really help you nail your entry and exit points.
An ascending triangle shows up with a flat resistance line paired with a rising support line that eventually meet higher up. It’s often a sign that buying interest is heating up, nudging prices toward a breakout above resistance.
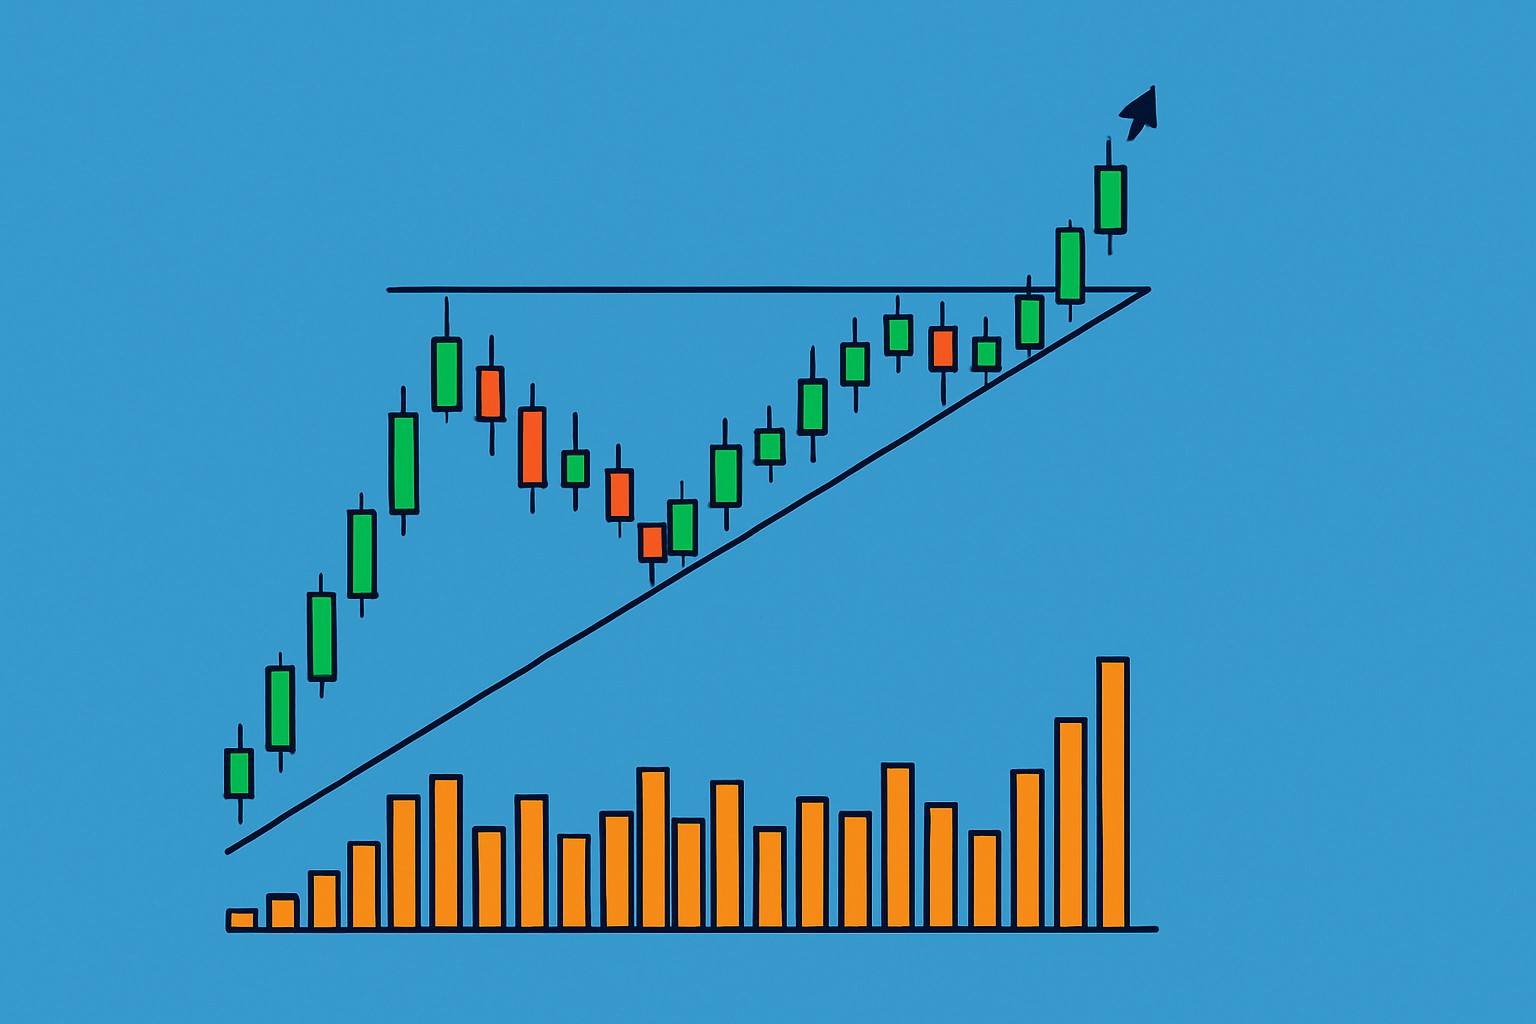
An ascending triangle appears when price action creates a flat resistance line on top and a rising support line forms underneath. This hints that buyers are steadily gaining ground. Typically volume takes a breather during this consolidation phase, signaling a short pause or a dash of indecision.
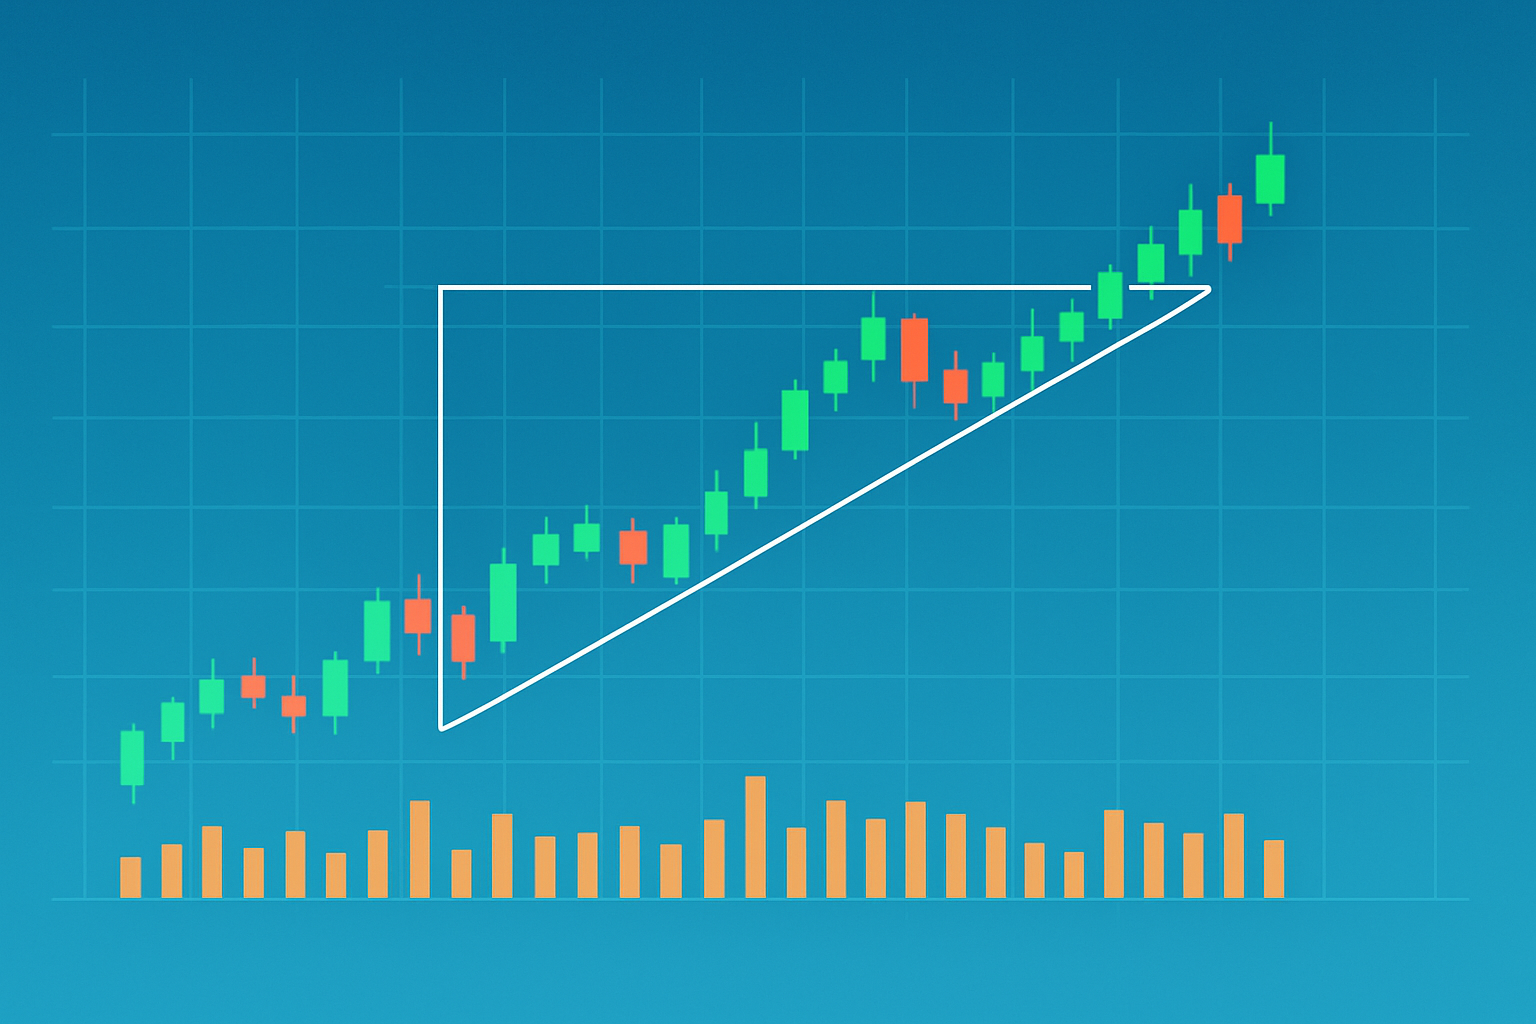
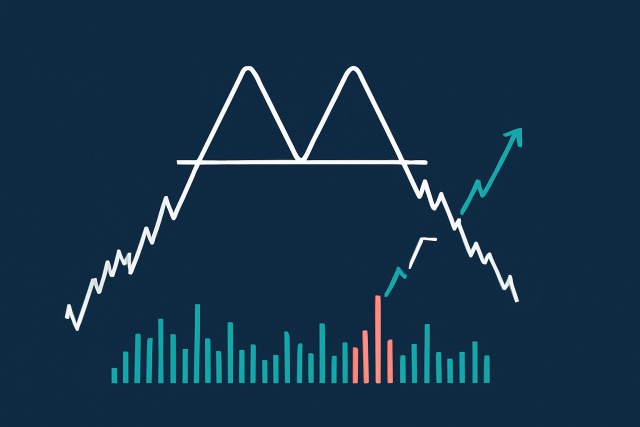
Illustration of an ascending triangle showing the flat resistance line, rising support line, and shrinking volume near the breakout point.
Traders often get tripped up by confusing ascending triangles with other patterns like symmetrical triangles or wedges, which can lead them to jump in at the wrong time. Unlike symmetrical triangles, ascending triangles tend to feature a flat resistance line rather than two trendlines inching closer together. Those pesky false breakouts—either sneaking just above resistance or slipping below support—can easily throw traders off their game. Make sure the volume actually supports the breakout and double-check the pattern across different timeframes.
Spot the ascending triangle by looking for a horizontal resistance line paired with a rising support line on your chart—think of it as a price slowly squeezing upward.
Double-check that the pattern holds water by confirming the price makes higher lows while the highs stay steady, and you’ll usually see volume tapering off during this quiet buildup.
Keep your radar tuned for a notable jump in volume as the price hugs that resistance line—this often hints there’s some real muscle behind an impending breakout.
Think about jumping in near the breakout point just above resistance, but only if it’s backed up by a close firmly above that level and rising volume—the market’s way of giving you a thumbs up.
Always play it safe with a stop-loss placed just below the last higher low, and set your profit targets by measuring the pattern’s height or using the trusty measured move technique.
Each step helps to double-check that the ascending triangle is coming together just as we’d hope, with the breakout showing some genuine punch behind it. Combining pattern recognition with volume analysis usually gives you a bit more confidence in your trading calls and can really help weed out those pesky false signals.
Managing risk is absolutely important when trading ascending triangles—it's your best defense against hefty losses. A tried-and-true approach usually involves setting stop-loss orders just below the rising support line. It also means tweaking your position sizes so they do not keep you up at night and steering clear of jumping in before the breakout is confirmed.
Staying disciplined while trading is your best friend when it comes to avoiding those pesky emotional decisions that often make you jump ship too soon or stubbornly cling to losing positions longer than you should. It’s really key to stick to your plan like glue and fight off the temptation to chase breakouts after they fizzle out.
Practical examples really help to bring theory down to earth. Take one successful ascending triangle trade for instance where a cryptocurrency bumped up against a clear resistance level at $50 while its lows steadily inched higher. The trader kept an eye on shrinking volume and waited patiently for a breakout backed by a surge in volume before jumping in. On the flip side, there was a trade that fizzled out when the breakout barely cleared resistance but lacked volume support. This led to a swift reversal and an ouch-worthy loss.
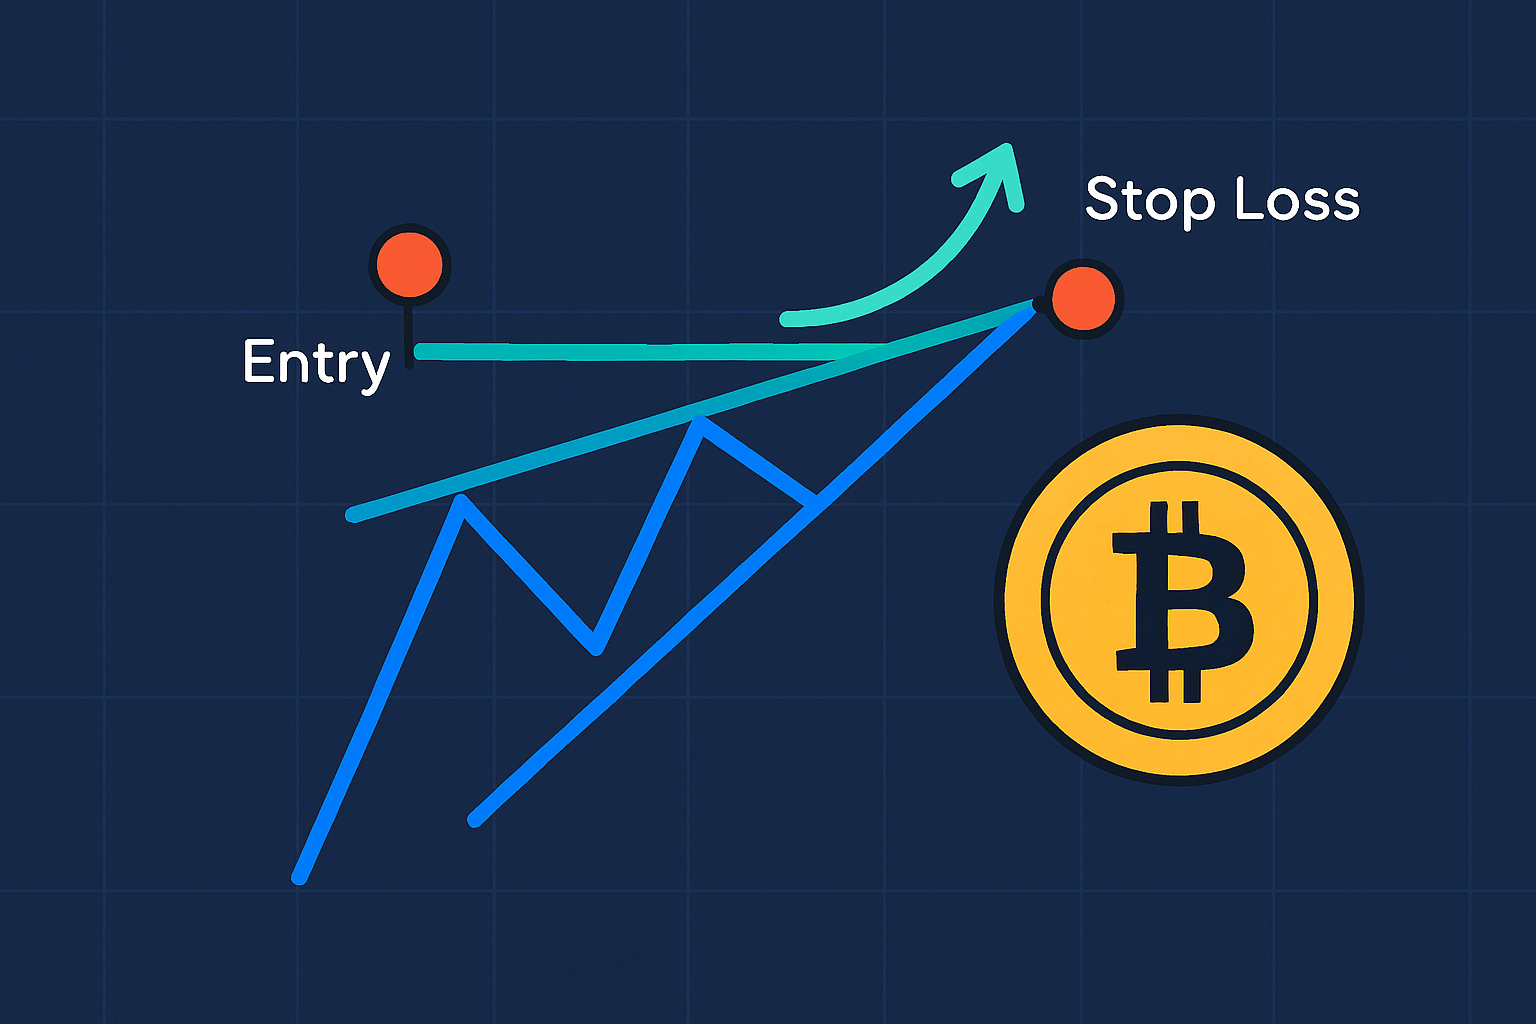
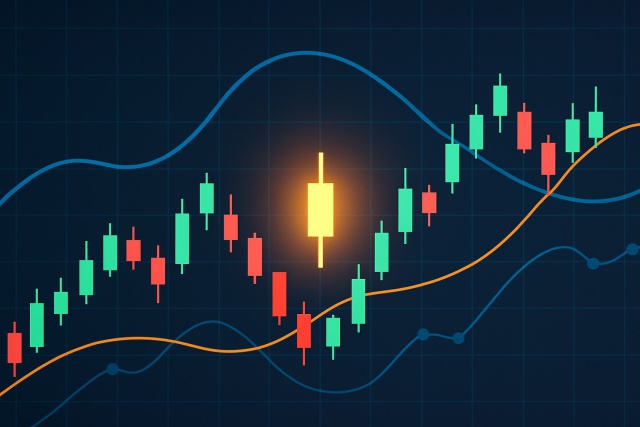
Chart showing an ascending triangle breakout trade on a cryptocurrency, highlighting entry, stop-loss, and target levels.
| Trade Date | Asset | Entry Price | Breakout Confirmation Method | Stop-Loss Level | Target Price | Outcome | Lessons Learned |
|---|---|---|---|---|---|---|---|
| 2023-03-15 | Bitcoin (BTC) | $45,000 | Close above resistance combined with a noticeable spike in volume | $43,500 | $50,000 | Profit | I have found that confirming breakouts with solid volume usually makes all the difference |
| 2023-04-10 | Ethereum (ETH) | $3,100 | Price broke out but didn’t quite get the volume confirmation it needed | $3,050 | $3,400 | Loss | It’s wise to steer clear when breakouts feel a bit shaky or underwhelming |
| 2023-05-22 | Litecoin (LTC) | $180 | Retested the breakout level and saw volume pick up nicely | $175 | $200 | Profit | Retests can be a nice, safer spot to jump in—patience pays off |
| 2023-06-05 | XRP | $0.60 | Breakout occurred though volume was disappointingly low | $0.58 | $0.70 | Loss | Waiting for that volume nod often sharpens your timing and keeps you out of trouble |
Taking a closer look at these trades reveals a pretty clear pattern: successful breakouts almost always come with solid volume support and well-thought-out stop-losses, while the ones that stumble often do so because they jumped the gun or ignored those important volume signals.
Advanced charting platforms like TradingView and TrendSpider truly take the headache out of spotting ascending triangles. They’re packed with detailed drawing tools and clever automatic pattern recognition. You also get technical indicators you can tweak to highlight vital support and resistance levels. Throw in volume indicators and scanners and you’ve got a toolkit that helps you zero in on promising breakout setups quickly.
If you are looking to keep tabs on those sneaky ascending triangle breakouts, setting up custom alerts on platforms like TradingView or TrendSpider is a solid move. These alerts’ll give you a nudge whenever the price inches close to or actually breaks through resistance levels—especially when volume conditions line up just right. I’ve found that creating watchlists focused on assets showing these ascending triangle patterns is a real lifesaver for staying organized and zeroing in on the best trading opportunities.

Are you tired of juggling multiple tools for your trading needs? TradingView is the all-in-one platform that streamlines your analysis and decision-making.
With its powerful charting capabilities, real-time data, and vibrant community, TradingView empowers traders like you to stay ahead of the market. Join thousands who trust TradingView for their trading success.

20 posts written
Discover how to confidently spot the head and shoulders chart pattern—a key indicator for trend reve...
Discover how to spot and leverage the hammer candlestick pattern in forex trading. This guide breaks...
Discover how the double top pattern signals potential trend reversals in trading. Learn to identify,...
Discover how the doji candlestick reveals moments of market indecision and learn to use these signal...