


Technical Analysis
What is a Harami Pattern? Breaking It Down
Learn how the harami candlestick pattern signals potential market reversals. This guide breaks down...

Heikin Ashi candles offer a sleeker and more refined alternative to your standard candlestick charts. They’re designed to cut through market noise and give you a smoother, easier view of price action. By tweaking the usual calculations slightly, these candles do a neat job of bringing trends into sharper focus.
Heikin Ashi candles don’t lay out open high low and close prices the way you might expect. Instead they rely on average price calculations to craft each candle and give the chart a smoother look. This approach tends to tone down sudden jarring spikes.
Heikin Ashi candles are handy for reducing pesky false signals caused by market volatility. By smoothing out price movements, these candles create patterns that feel more consistent. This makes it easier for traders to distinguish between genuine trend reversals and fleeting pullbacks.
"> "Using Heikin Ashi candles has genuinely shifted the way I tackle trading. They do a great job of cutting through the market noise, making those tricky reversals pop out much clearer. The result? Fewer false alarms and, honestly, smoother sailing with my trades overall." — Professional Technical Analyst"
Spotting particular Heikin Ashi candle patterns can give you a nifty early heads-up on a possible trend reversal. These formations tend to pop up during those moments of market uncertainty or shifts in momentum.
Doji-like candles with tiny or almost nonexistent bodies often whisper indecision and hint that the current trend might be losing its punch.
Candles sporting long upper wicks during an uptrend or long lower shadows in a downtrend usually suggest the market is politely or not so politely rejecting certain price levels.
When the colors flip from red to green or green to red after a steady march it’s often a cheeky nudge that a reversal could be on the horizon.
Patterns near well-established support or resistance lines tend to pack more punch when signaling trend reversals. I have found this quite handy in my experience.
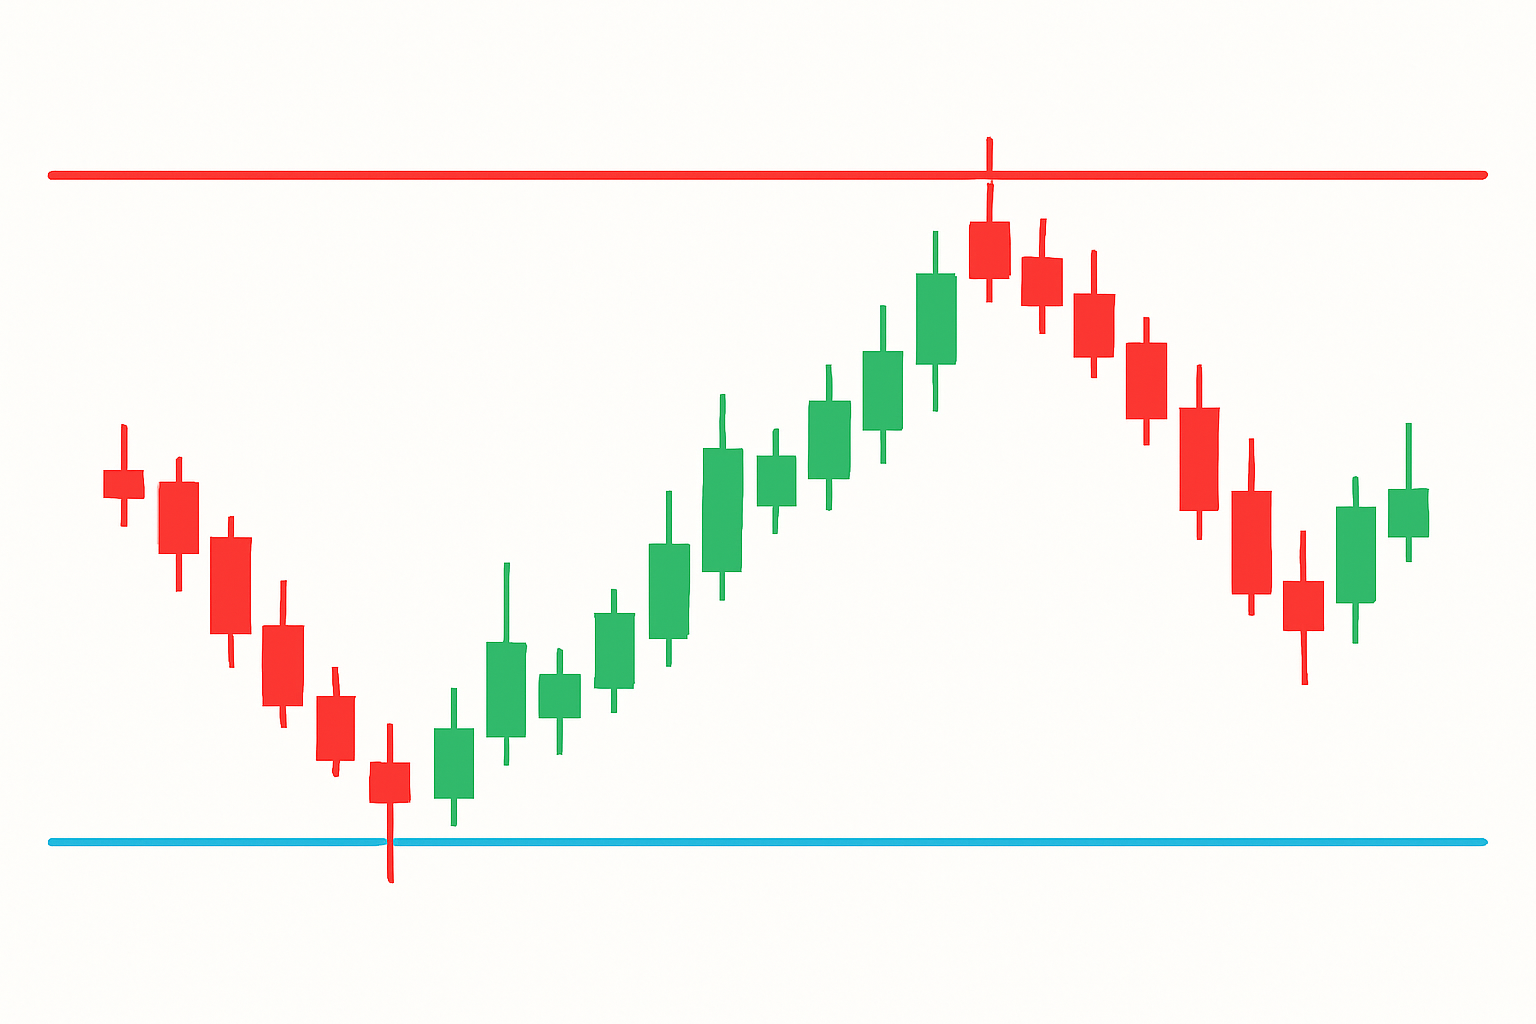
Visual examples of Heikin Ashi candle patterns signaling trend reversals in a price chart
Spotting better signals for trend reversals really pays off by mixing Heikin Ashi candles with other trusty technical indicators like moving averages and RSI and volume data. Putting these tools together usually amps up your confidence and cuts down on those pesky false reversals.
Spotting reversals with Heikin Ashi calls for a delicate touch. First, keep an eye on the big-picture trend. Then zero in on key candle signals and finally double-check your hunch with other indicators.
Keep an eye on the strength and consistency of the current trend by checking the candle colors and sizes over several periods. It’s like reading the mood of the market in real time.
Watch for shrinking candle bodies or Doji-like shapes because these are often the market’s way of saying "Hey, things might be slowing down."
Don’t rely on candles alone. Use RSI, moving averages or volume data to double-check reversal signals before jumping in.
Nail down clear entry and exit points by trusting confirmed reversal candle patterns only when they get a thumbs up from other indicators.
Please don’t forget to set strict stop-loss orders. It’s the best way to keep your capital safe and manage risk, especially when the market’s throwing a tantrum.
Heikin Ashi candles can be quite handy but I have noticed traders often stumble into a few classic pitfalls. Sometimes they get tunnel vision and miss the broader market context or lean too heavily on candle colors without double-checking other indicators.
Advanced traders usually squeeze the most juice from Heikin Ashi candle reversals by mixing in multi-timeframe analysis alongside candle settings that are fine-tuned to their specific markets. Pairing Heikin Ashi candles with volume profile data—or even automating signals through algorithmic tools—often sharpens timing.

Are you tired of juggling multiple tools for your trading needs? TradingView is the all-in-one platform that streamlines your analysis and decision-making.
With its powerful charting capabilities, real-time data, and vibrant community, TradingView empowers traders like you to stay ahead of the market. Join thousands who trust TradingView for their trading success.

23 posts written
Learn how the harami candlestick pattern signals potential market reversals. This guide breaks down...

Unlock the power of the head and shoulders pattern with this complete guide. Learn to spot, trade, a...

Discover the doji candlestick—a powerful price action signal revealing market indecision. This begin...

Unlock the power of the bear flag pattern with our practical, step-by-step guide. Understand market...