


Technical Analysis
Profiting from Head and Shoulders Patterns in Any Market
Unlock the power of the head and shoulders pattern with this complete guide. Learn to spot, trade, a...

Support and resistance trading is a real cornerstone in technical analysis and savvy traders often lean on it to spot signs of price reversals or breakouts. Think of support levels as the sturdy floor that keeps prices from tumbling down further. Buying interest usually kicks in there, acting like a safety net. On the flip side, resistance levels work like an invisible ceiling where selling pressure steps up and often puts the brakes on upward moves. As reliable as these levels seem, traders frequently find themselves caught off guard by false breakouts and the common subjective reading of charts. There is also the nagging uncertainty about whether a level will truly hold its ground or give way.
When traders combine technical indicators with support and resistance levels they’re double-checking their work and adding an extra layer of confirmation that makes signals more trustworthy. Indicators are great for measuring momentum and gauging trend strength as well as spotting possible reversals—all of which can guide you toward clearer and more confident decisions around key price points. Pairing these two methods usually cuts down on false signals and sharpens your timing for entries and exits while boosting your confidence.
Support and resistance are key price levels where an asset tends to pause and often change course. Support appears when demand outpaces supply and nudges prices back up. Resistance shows up when selling pressure beats buying interest and pushes prices down. To find these spots, you check past price action, watch for volume spikes, and focus on chart areas where prices get stuck or reverse repeatedly.
One common pitfall traders often fall into is drawing support and resistance lines without having quite enough data, which usually results in lines you can’t really trust. Another sneaky issue is ignoring the timeframe context, because those levels that scream importance on one timeframe might barely register on another.
Support and resistance levels highlight spots where prices might hit the brakes or suddenly take a U-turn. Indicators dig deeper to expose the market's momentum and the strength of its trend hidden beneath the surface. Relying on just one method is like trying to see the whole forest through a single tree because traders often miss the bigger picture that way. By combining indicators with support and resistance lines, you get a more complete snapshot that helps confirm whether a level truly counts or signals potential breakouts.
Moving Averages (MA) are great for picking out dynamic support and resistance levels and give a clear sense of which way the trend is leaning.
Relative Strength Index (RSI) signals when prices might be overbought or oversold and often gives early hints of reversals near those important support or resistance zones.
Moving Average Convergence Divergence (MACD) is your go-to for tracking momentum shifts and trend changes. It makes timing breakouts feel less like guesswork.
Stochastic Oscillator compares the closing price to its recent range to help spot potential price reversals at key levels where traders hold their breath.
Bollinger Bands highlight times of high or low volatility and offer a way to confirm if the price is bouncing off support and resistance or breaking through.
Each of these indicators throws out its own unique signal. Moving Averages keep an eye on trends while RSI flags those pesky momentum extremes. MACD is great at spotting shifts in trend momentum. Stochastic calls out short-term reversals and Bollinger Bands mark the boundaries of volatility.
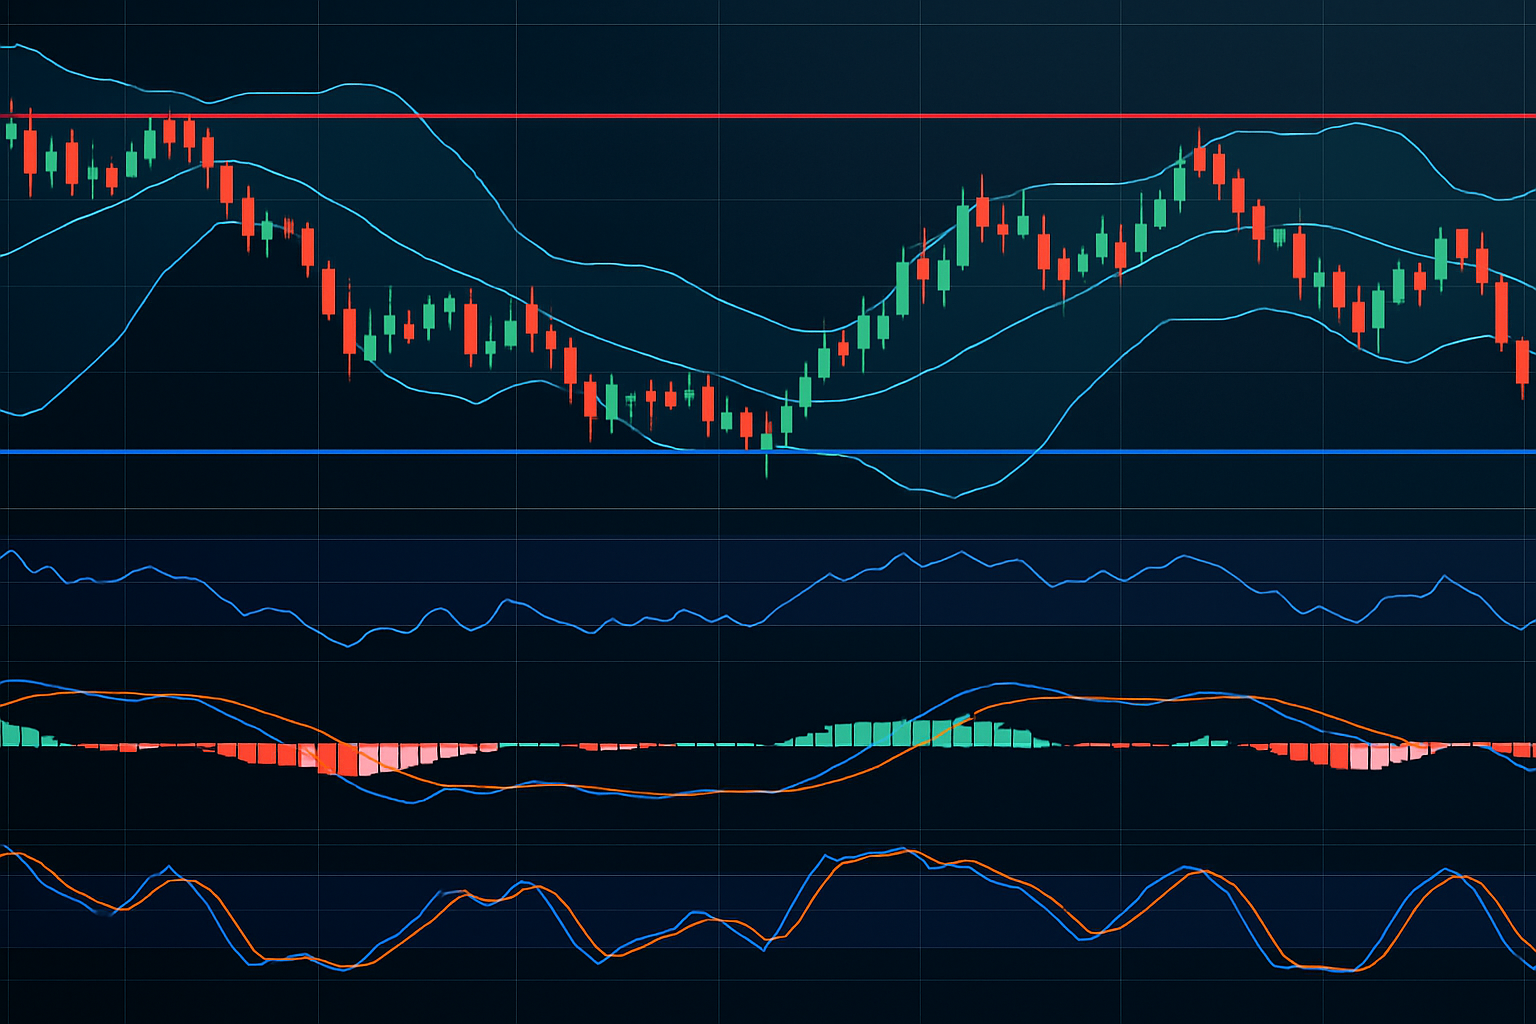
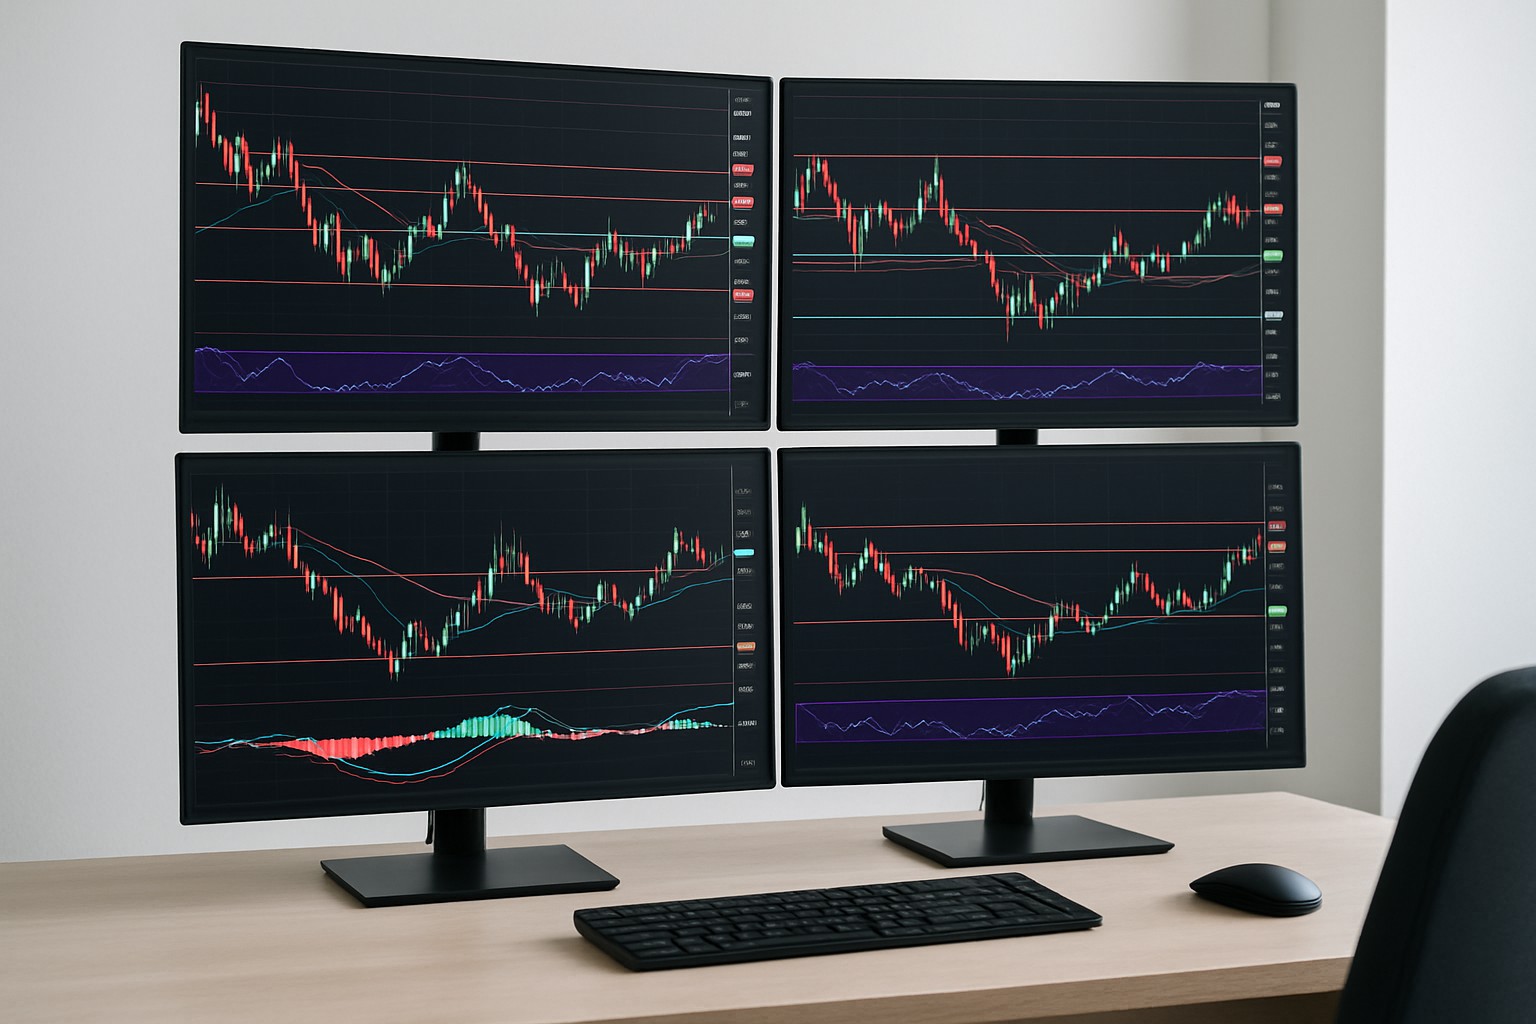
A detailed trading chart showing support and resistance levels combined with multiple technical indicators.
Zero in on those key support and resistance levels on your chart—look for spots where the price has bounced around a few times and shown clear reactions. These areas tend to tell a story worth listening to.
Pick technical indicators that truly jive with your trading style and the market you’re working in. For instance, momentum indicators can be your best friend when hunting for reversals while moving averages often do a solid job confirming trends.
Keep your eyes peeled for indicator signals that line up nicely with tests or breaks of support or resistance. Think RSI dropping into oversold territory near a support level or the MACD shifting gears to suggest a trend change—those little nudges can be real game changers.
Nail down your entry points by blending price action patterns like pin bars or engulfing candles with backing signals from your indicators. This combo ups your odds of a winning trade and gives you more confidence to pull the trigger.
When setting stops, tuck your stop-loss just beyond those key support or resistance levels and choose your take-profit targets based on a sensible risk-reward ratio and the next important levels on the chart. It’s the kind of cautious planning that keeps your skin in the game.
Stay vigilant—keep an eye on both your trade and your indicators. If the signals start sending mixed messages or the price breaks vital support or resistance, don’t hesitate to tighten your stops or take an early exit. Sometimes it’s better to cut losses or lock in gains than to cling too tightly.
Timing your entries and exits is more important than you might think. It’s usually a bad idea to jump headfirst into trades just because the price hits a support or resistance level unless your indicators are clearly signaling a shift in momentum. Treat your stop-losses as your trusty safety net and use them wisely to keep risk under control, especially near tricky key levels where false breakouts often confuse traders. Stay alert for divergences in indicators like RSI or MACD because these signals often suggest a trend is beginning to lose steam.
Imagine Bitcoin inching closer to a well-worn long-term support zone. Using TradingView's slick charting tools a savvy trader spots a bullish divergence on the RSI paired with a MACD crossover hinting at fresh momentum building up. Then as if on cue a price pin bar pops up right at that support—almost like the market’s giving a little wink. The trader pulls the trigger and jumps into a long position. Combining these signals usually packs more punch than leaning on support alone.
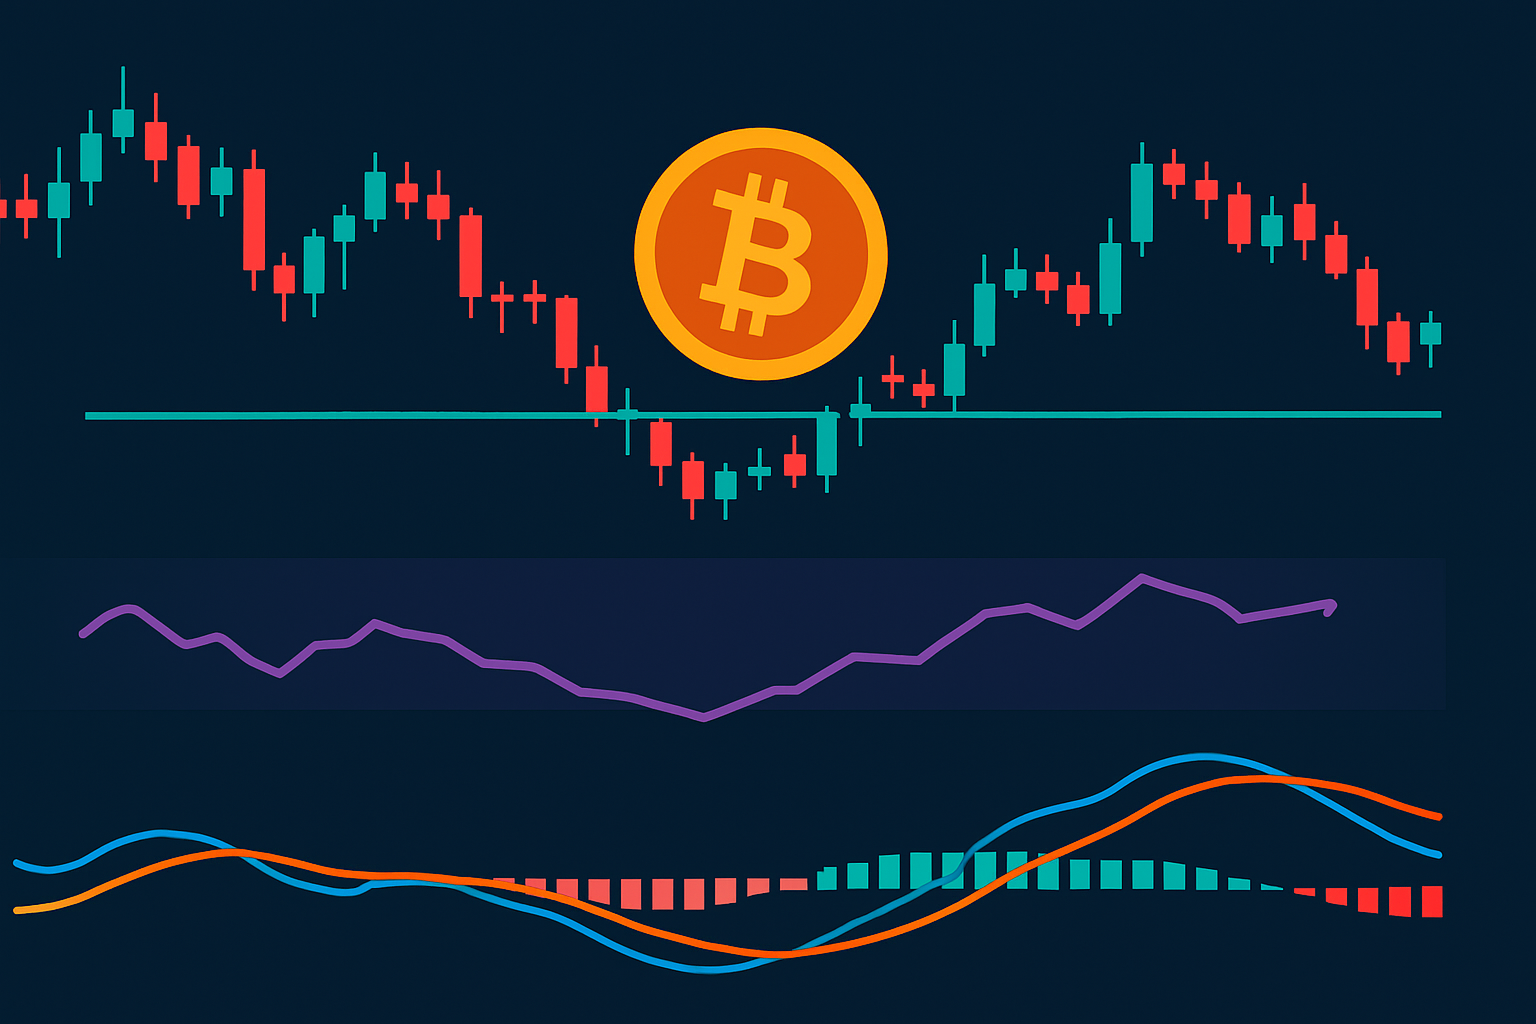
Example of Bitcoin price chart with support level tested and combined RSI and MACD signals.
| Trade Scenario | Entry Timing | Risk Level | Reward Potential | Outcome Summary |
|---|---|---|---|---|
| Support/Resistance Only | Entered right at the first touch of support, playing it cautiously | Moderate | Medium | Ran into a few pesky false breakouts that unfortunately ate into profits |
| Combined Indicators | Waited for the telltale RSI bullish divergence and MACD crossover right at support before jumping in | Lower | Higher | The trade got the green light and rode a nice upward wave, ending in profit |
| Support/Resistance Only | Took a short position right on the resistance touch, sticking to the basics | Moderate | Medium | Price flipped unexpectedly, hitting the stop loss faster than hoped |
| Combined Indicators | Opened a short after the Stochastic flagged overbought and price whipped up a rejection candle at resistance | Lower | Higher | Nabbed a quick reversal profit, a satisfying bit of timing if I say so myself |
This table lays out a side-by-side look at trades using just support/resistance levels versus those spiced up with key technical indicators. It clearly shows how mixing methods usually sharpens your entry timing, dials down risk, and often leads to sweeter results overall.
These examples highlight how blending technical indicators with support and resistance levels can seriously up your game when making trade decisions. This extra layer of confirmation usually weeds out false signals that can trip you up and lets traders step into positions with a steadier hand and often better profits.
Dealing with these challenges calls for discipline and a willingness to keep fine-tuning your strategy as you go. I’ve found that backtesting tools like TrendSpider offer automatic technical analysis and pattern recognition. They can be real lifesavers when it comes to seeing how different indicator combos and support or resistance levels hold up under various market moods.
Following these best practices lays a rock-solid foundation for steady trading results. When traders keep an eye on confirmation and handle risk with care, they can smartly use indicators along with support and resistance trading strategies to tilt the odds in their favor.

Struggling to improve your trading performance? Edgewonk's advanced analytics tools are designed to give you the edge you need.
With detailed trade journaling, robust strategy analysis, and psychological insights, you'll gain a comprehensive understanding of your strengths and weaknesses. Don't miss out on this game-changing opportunity.

23 posts written
Unlock the power of the head and shoulders pattern with this complete guide. Learn to spot, trade, a...

Unlock the power of the bear flag pattern with our practical, step-by-step guide. Understand market...

Discover the bullish harami candlestick pattern—a key technical signal that can hint at trend revers...

Master the hammer candlestick pattern—a key indicator for market reversals. This beginner-friendly g...