


Technical Analysis
What the Doji Candlestick Means in Price Action
Discover the doji candlestick—a powerful price action signal revealing market indecision. This begin...

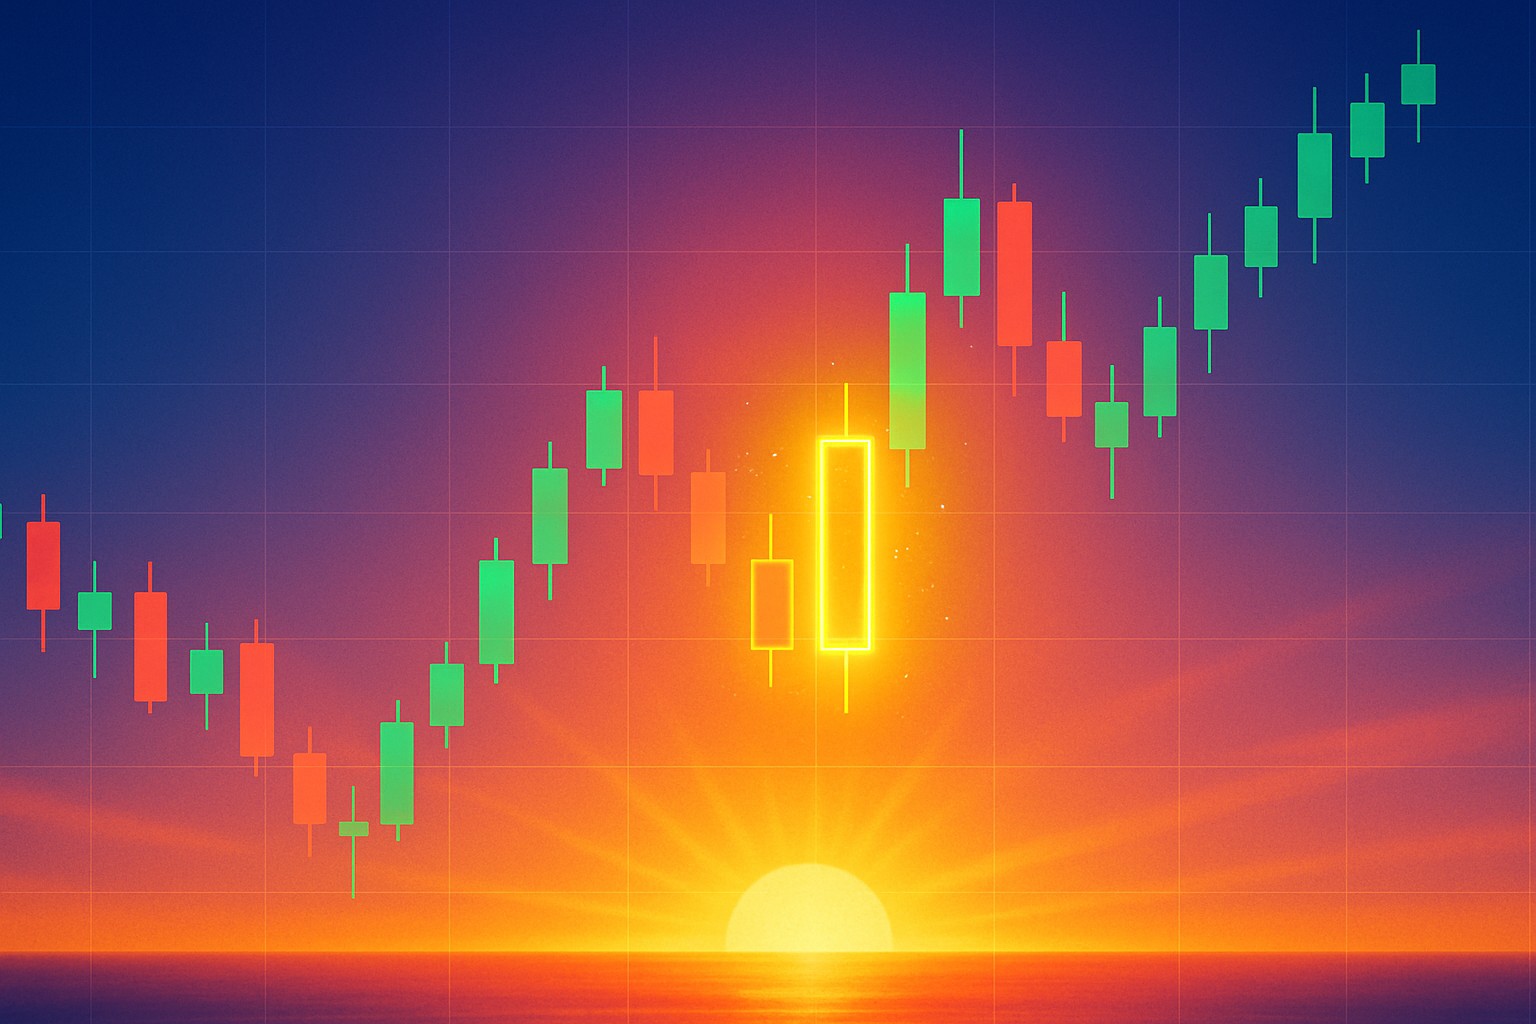
The morning star candlestick is a classic technical pattern that usually hints at a potential bullish reversal after a downtrend. Traders tend to like it because of its distinctive three-candle formation, which paints a pretty clear picture of a shift from selling pressure to increasing buying enthusiasm. We will delve into how the morning star takes shape and share some handy tips for spotting it in the wild.
The morning star pattern features three candles that hint at a potential turnaround from bearish to bullish territory. It kicks off with a long bearish candle, showing that sellers were really calling the shots. Next comes a small-bodied candle—usually a doji or spinning top—that captures a moment of hesitation, when no one seems quite sure which way to jump.
The morning star pattern is like the market's little wake-up call signaling a shift from gloomy bearish vibes to a more hopeful upbeat mood. The first candle tells the story of sellers holding the reins tight and driving prices sharply down. Then comes the second candle which shows buyers hesitating at these lower prices as if catching their breath and suggesting that selling pressure might be losing steam. Finally, the third candle bursts onto the scene bullish and confident as buyers take charge and nudge prices higher.
The morning star pattern often feels like that first gentle peek of dawn after a night that seemed endless. It’s a quiet nod to hope, renewal, and fresh starts—as if buyers are slowly stepping back into the market, their confidence quietly building one cautious step at a time.
Spotting a morning star calls for a keen eye on the size, position and timing of three candles during a downtrend. Typically, traders watch for a solid bearish candle to start, followed by a small indecision candle that gaps down. Then comes a strong bullish candle that closes well above the midpoint of the first. Check for higher volume on that bullish candle too, as it helps weed out false signals.
Keep an eye out for a solid bearish candle with a long body. This usually means the sellers have taken control.
Spot the second candle. It’s often a small body or a doji and ideally appears with a downward gap from the first candle, adding some drama.
The third candle should be a big bullish one that closes at least halfway into the first candle’s body. This shows the buyers stepping back in.
Check for higher volume on the third candle as well. This acts like the cherry on top, confirming the reversal might really be gaining momentum.
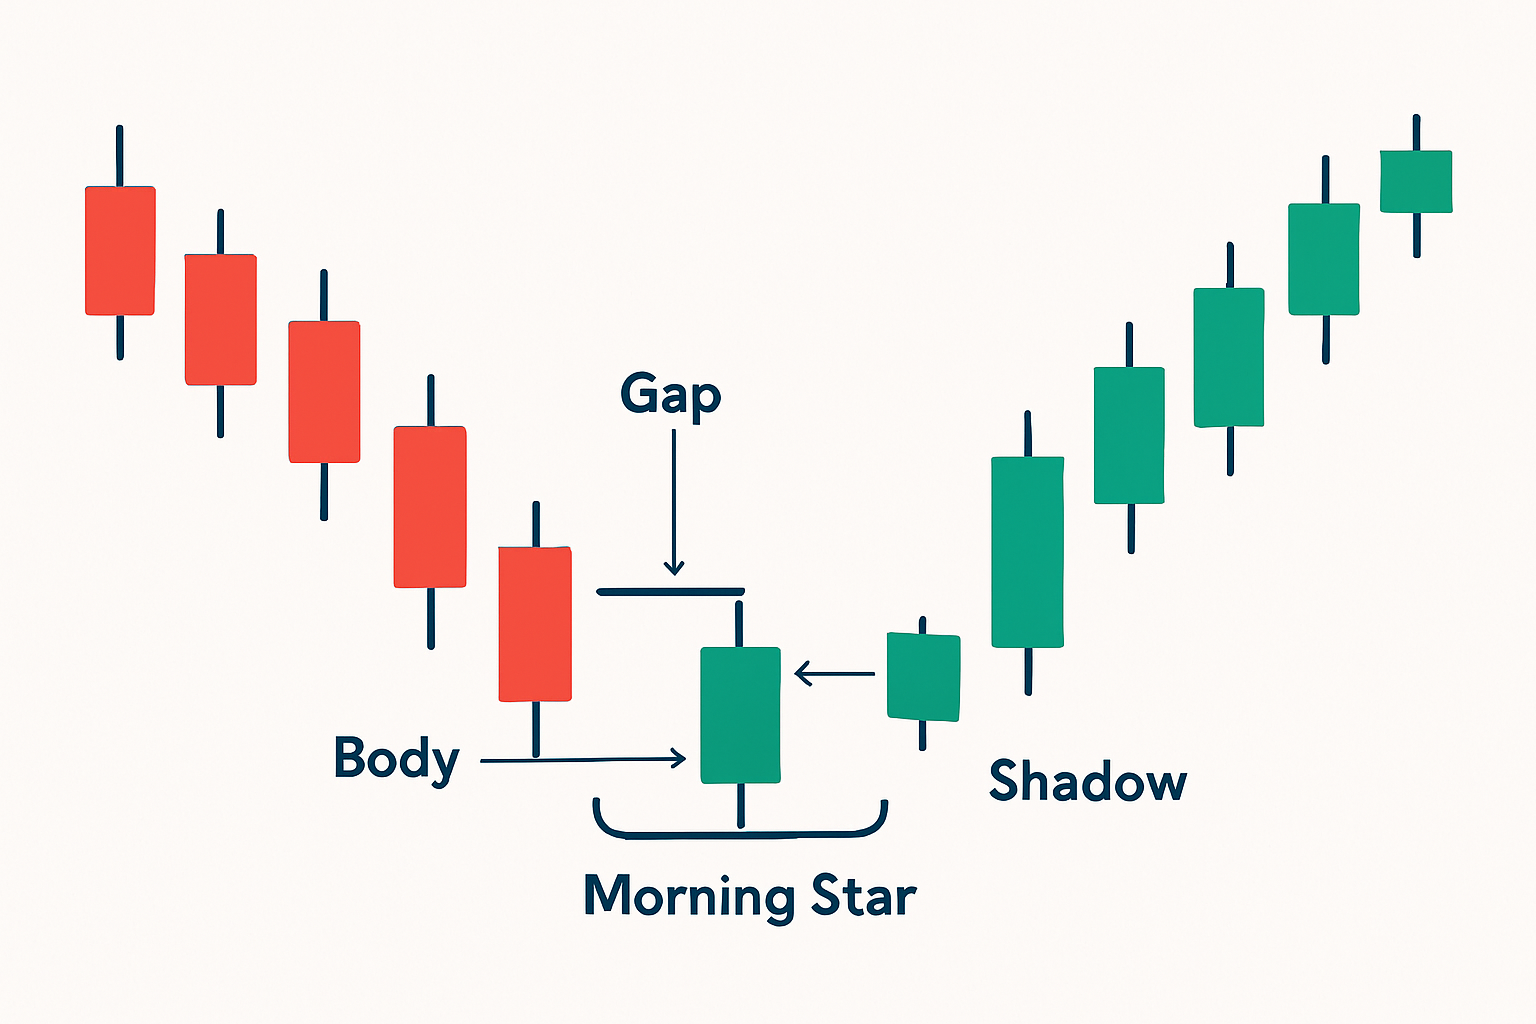
Illustration of a classic morning star candlestick pattern annotated with key features such as gaps, candle bodies, and shadows
The morning star is usually a solid pattern to watch but traders should be mindful of a few common twists that can reduce its reliability. For instance, sometimes the second candle doesn’t gap down as expected or the candle sizes might vary. These quirks can lead to false signals or reversals that aren’t as trustworthy as they seem.
Traders often lean on the morning star pattern as one piece of the puzzle. They combine it with other technical tools to craft strategies that work. Relying on trend analysis, support levels and indicators like volume or RSI leads to smarter decisions. Managing risk smartly by setting stop losses and keeping profit targets realistic helps keep trades balanced. This protects you from nasty surprises while still aiming for worthwhile gains.
Make sure the overall trend is heading south and watch for key support levels because they add strength to the pattern before you take action.
Open a long position once the bullish third candle closes. It often shows that buyers are stepping in with real enthusiasm.
Always set a stop-loss just below the pattern's lowest point as your safety net to prevent unexpected losses.
Aim for profit targets near resistance levels or maintain a healthy risk-to-reward ratio like 2 to 1 which usually works well.
Improve your pattern recognition by quickly checking volume, the RSI oscillator or moving averages because these indicators add extra confirmation to your trade.
A stock chart shows a morning star flickering to life right at a important support level after a long downtrend. The first bearish candle pounds the market with heavy selling pressure followed by a doji candle that basically says "I’m not quite sure what’s going on here." Then just when you start to hope a strong bullish third candle steps in and closes above the midpoint of the first one. If you jumped into a long position at the close of that third candle you would have ridden the wave to a neat 15% gain as the price rallied. These patterns tend to show up in forex markets too like with the EUR/USD pair where morning stars often hint at the start of daily upswings.
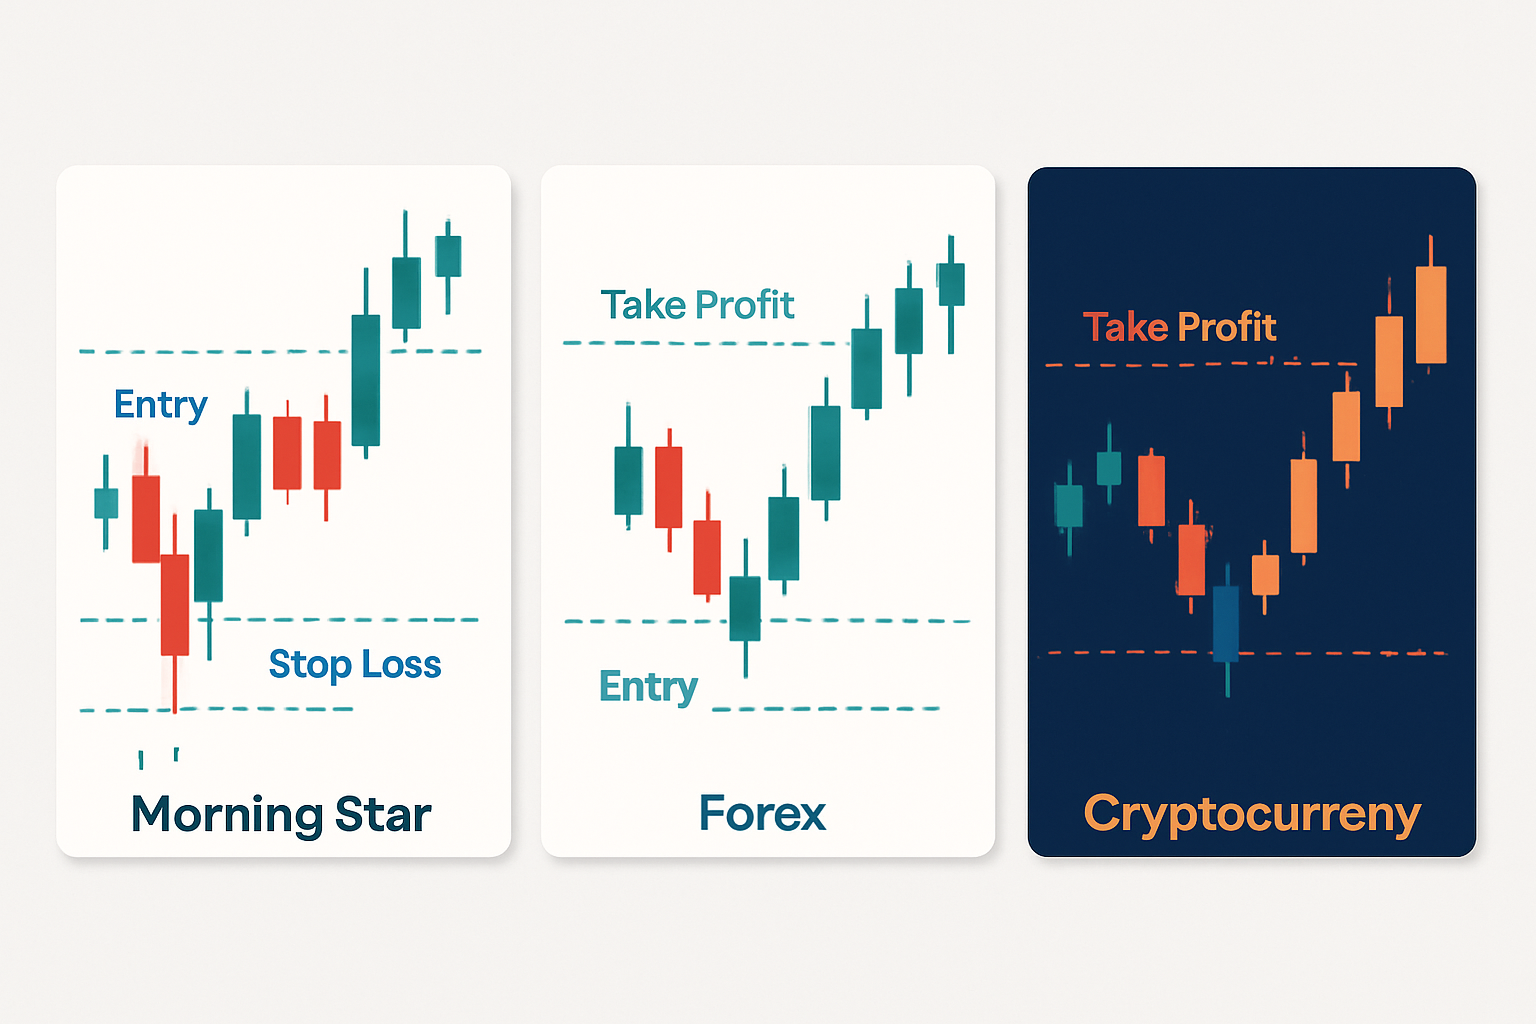
Annotated screenshots of morning star formations on real charts with trade entries, stop-loss, and take profit points
Sometimes, even the most promising tools come with their quirks, and Morning Star patterns are no exception. While they can be quite insightful, it is worth remembering that no single signal is foolproof. In fact, market conditions can throw a wrench into the works, causing these patterns to occasionally lead you astray. So, it is always a good idea to keep your wits about you and not put all your eggs in one basket when relying on this pattern alone.
The morning star is generally seen as a reliable reversal pattern but it is not foolproof. Sometimes it gives false signals especially when the market's volume is low or the price action is jumpy. The timeframe matters as well. For example, spotting a morning star on a quick 5-minute chart does not have the same impact as seeing one on a daily chart.
To really get the most out of the morning star candlestick pattern, traders have to roll up their sleeves and cultivate discipline, patience and a genuine hunger for learning that doesn’t quit. Keeping a trading journal becomes more than a routine—it's your trading diary helping you spot patterns and mistakes alike. Testing strategies against historical data and avoiding gut-wrenching emotional impulse trades will go a long way toward sharpening your pattern recognition and boosting your results.

Struggling to improve your trading performance? Edgewonk's advanced analytics tools are designed to give you the edge you need.
With detailed trade journaling, robust strategy analysis, and psychological insights, you'll gain a comprehensive understanding of your strengths and weaknesses. Don't miss out on this game-changing opportunity.

17 posts written
Discover the doji candlestick—a powerful price action signal revealing market indecision. This begin...

Discover the bullish harami candlestick pattern—a key technical signal that can hint at trend revers...

Learn how the harami candlestick pattern signals potential market reversals. This guide breaks down...

Discover what IOUs mean in finance, their role as informal debt acknowledgments, and how understandi...