


Technical Analysis
Profiting from Head and Shoulders Patterns in Any Market
Unlock the power of the head and shoulders pattern with this complete guide. Learn to spot, trade, a...

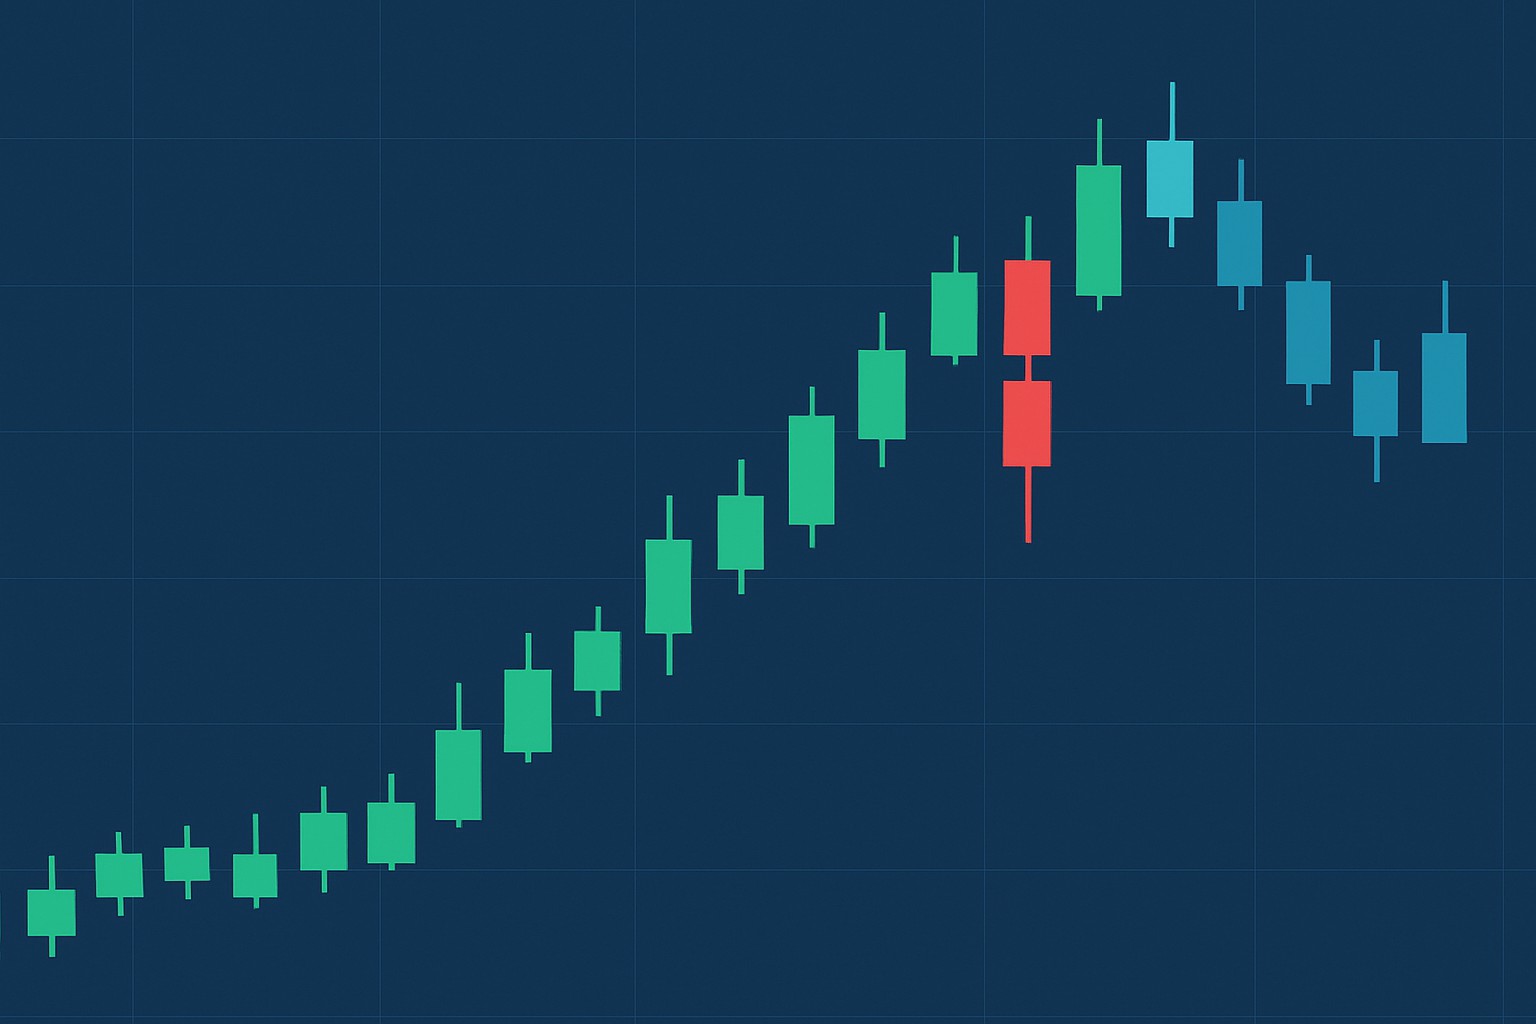
The hanging man candlestick is a key pattern in technical analysis that frequently hints at a possible reversal from a bullish trend to a bearish one.
A hanging man candlestick typically sports a small real body nestled near the top, with a long lower shadow dangling beneath it.
The term 'hanging man' might seem grim at first, but it just describes the shape of the candlestick because it resembles a man hanging without any darker undertones you might assume.
Candlestick charts show price swings over a specific period and display the open, close, high and low prices in an easy-to-read way. Understanding their components and spotting familiar patterns gives traders a good feel for the market's vibe.
The hanging man candle often signals a possible bearish reversal after an uptrend and gives traders a little heads-up. It shows that sellers had their moment pushing prices down but buyers weren’t ready to throw in the towel—they managed to keep the price close to the open.
The hanging man by itself doesn’t exactly shout "sell now." Rather, it gently nudges traders to watch for confirmation signs like a dip in price or a surge in selling volume before making any moves
The hanging man tells an interesting tale about market psychology during an uptrend. Its long lower shadow shows sellers gave prices a good shove downward at one point in the session. Still, prices bounced back to close near where they started, suggesting buyers did step up but not strongly enough to seize control. This tug-of-war hints at weakening bullish momentum and growing uncertainty as sellers push back against the buyers' grip. The small body near the top is a silent sign of hesitation—bulls aren’t driving prices upward with the same confidence as before.
The hanging man captures that brief flicker of doubt following a rally—a subtle hint that the bulls might be running low on steam, and the sellers could be gearing up to make their move.
Spot a hanging man by watching for a few telltale signs on your chart. It usually appears after an uptrend and features a small body near the top of the session with a long lower shadow. There is barely any upper wick to speak of. It’s vital to tell it apart from the hammer because the hammer typically appears after downtrends.
Make sure the previous trend is actually moving upward. This keeps the pattern relevant and your analysis on track.
Keep an eye out for a small real body that’s nestled near the top of the candlestick’s price range because it’s like the cherry on top of your observation.
Spot a long lower shadow that’s at least twice as long as the real body as it gives a subtle hint that something interesting might be brewing below the surface.
Notice little to no upper shadow since this really helps highlight that distinctive hanging shape, kind of like a flag waving in the wind.
Back up your reading by checking for volume spikes or the next candle’s move. This double-check can give you a much better feel for how strong that reversal might really be.
| Feature | Hanging Man | Hammer |
|---|---|---|
| Trend Context | Usually shows up after an uptrend, almost like a little warning flag waving | Tends to appear following a downtrend, kind of like a glimmer of hope on the horizon |
| Shadow Length | Sports a long lower shadow—at least twice the size of its body—making it hard to miss | Also features a long lower shadow, at least twice the body length, standing out like a beacon |
| Body Position | Has a small body perched near the top of its range, as if teetering on the edge | Shows a small body sitting near the bottom of its range, quietly holding its ground |
| Signal Implication | Often hints at a potential bearish reversal, waving a cautious finger to traders | Often suggests a potential bullish reversal, giving a subtle nod to the optimists |
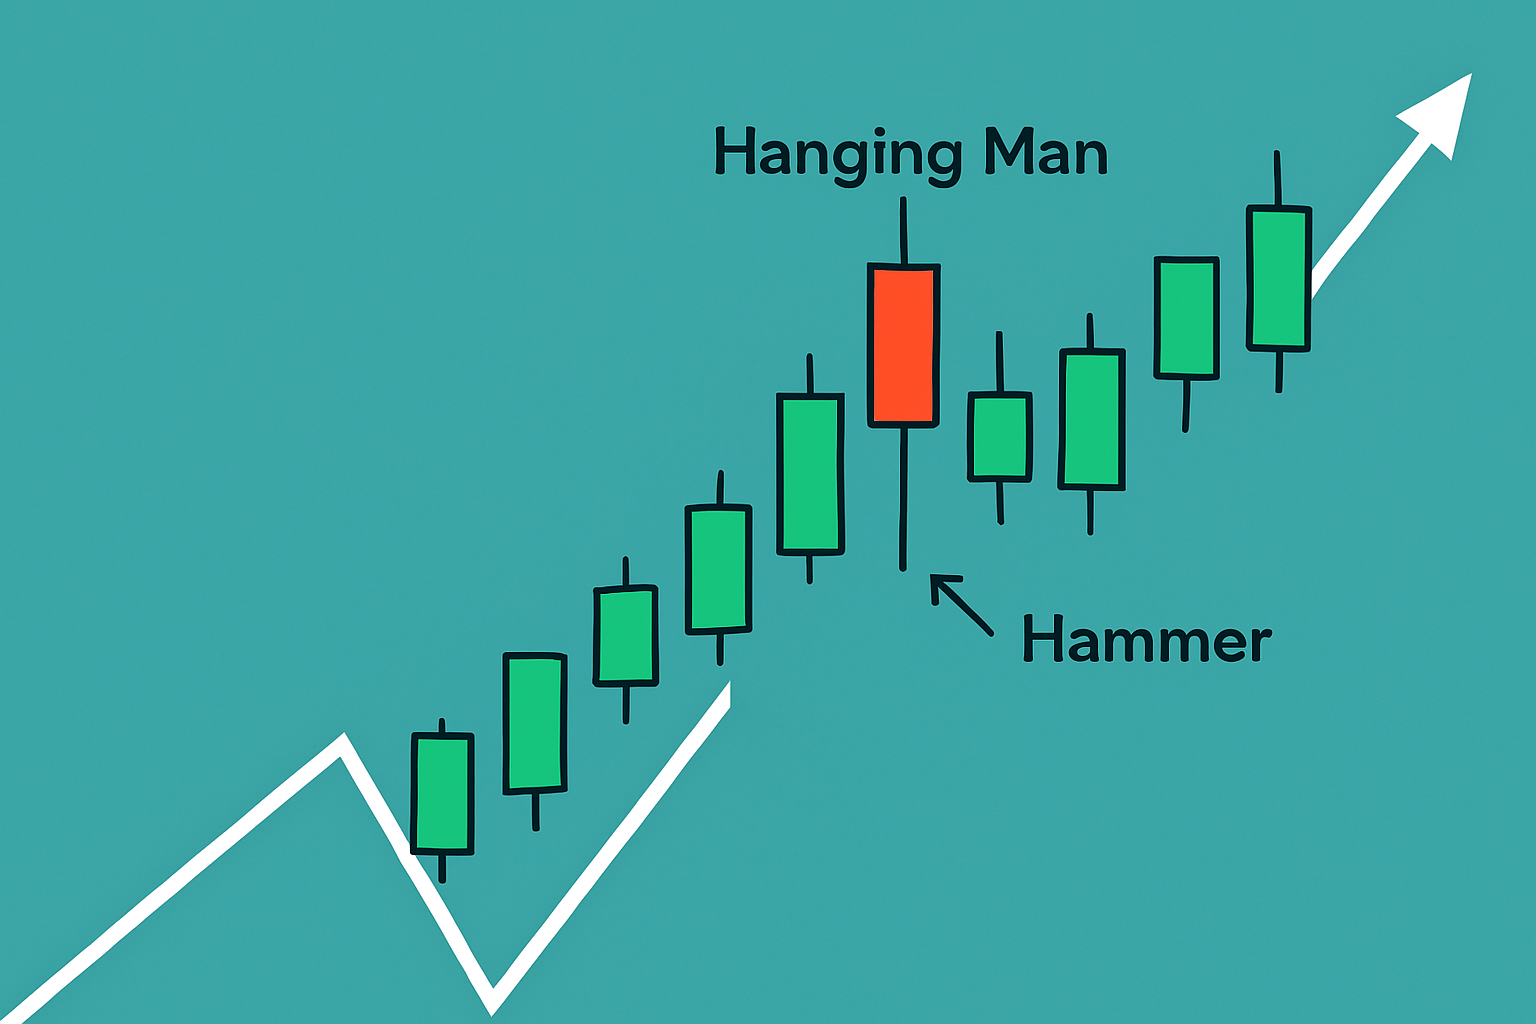
Visual comparison of Hanging Man and Hammer candlestick patterns in an uptrend and downtrend respectively
It’s really wise to hold off and wait for confirmation before jumping the gun on a hanging man signal. Traders usually keep an eye out for a bearish candle to follow, or perhaps a surge in volume on down days—both of which tend to nudge the odds in favor of a genuine reversal rather than a false alarm.
the price suddenly bounces back or the volume stubbornly stays low the hanging man can easily turn out to be a false alarm.
When it comes to spotting potential market reversals, the hanging man candle often sneaks in as a subtle yet powerful warning sign. It’s not always loud and flashy, but if you know what to look for, it can really give your trading strategy an edge. Think of it as that quiet nudge from the market saying, "Hey, maybe it’s time to rethink your next move." In this section, we’ll dig into how you can spot these nifty signals and use them to your advantage, blending them seamlessly into your existing approach without overcomplicating things.
Traders often lean on hanging man patterns as one piece of a larger puzzle and combine them with other technical indicators to get a clearer picture. Usually they set stop losses to keep risk from spinning out of control and patiently wait for solid confirmation signals before pulling the trigger.
Day traders for instance lean on it for timing quick exits because when you are in the thick of the action every second counts. Longer-term investors usually take a laid-back approach and blend it with trend analysis on daily or weekly charts to steer bigger portfolio moves.
Let’s clear the fog around the Hanging Man, shall we? This little candlestick pattern often trips up traders more than it should, leading to some classic misreads. While it’s a handy signal in the toolbox, many tend to jump the gun or miss key nuances. Stick with me as we untangle these common slip-ups—because getting this right can make all the difference between a decent trade and a facepalm moment.
Many traders tend to jump the gun by reading the hanging man candlestick without pausing to consider the prior trend or waiting for those all-important confirmation signals. I have seen some even confuse it with the hammer pattern, which can be a recipe for disaster. Overlooking trading volume can send you down the wrong path since it leaves you with only half the story.

Struggling to improve your trading performance? Edgewonk's advanced analytics tools are designed to give you the edge you need.
With detailed trade journaling, robust strategy analysis, and psychological insights, you'll gain a comprehensive understanding of your strengths and weaknesses. Don't miss out on this game-changing opportunity.

10 posts written
Unlock the power of the head and shoulders pattern with this complete guide. Learn to spot, trade, a...

Unlock the power of the bear flag pattern with our practical, step-by-step guide. Understand market...

Unlock the power of candle patterns to decode market psychology and improve your trading precision....

Discover the bullish harami candlestick pattern—a key technical signal that can hint at trend revers...