


Technical Analysis
What the Doji Candlestick Means in Price Action
Discover the doji candlestick—a powerful price action signal revealing market indecision. This begin...

The rising wedge pattern is a pretty handy tool in technical analysis that a lot of traders lean on to get a heads-up about possible price reversals and shifts in market trends.
Spotting rising wedge patterns is like having an early heads-up that the upward momentum might be losing steam, which can really help traders get a better handle on timing their trades. Once you’ve wrapped your head around this pattern, it’s easier to dodge those pesky surprise reversals and fine-tune your entry and exit points.
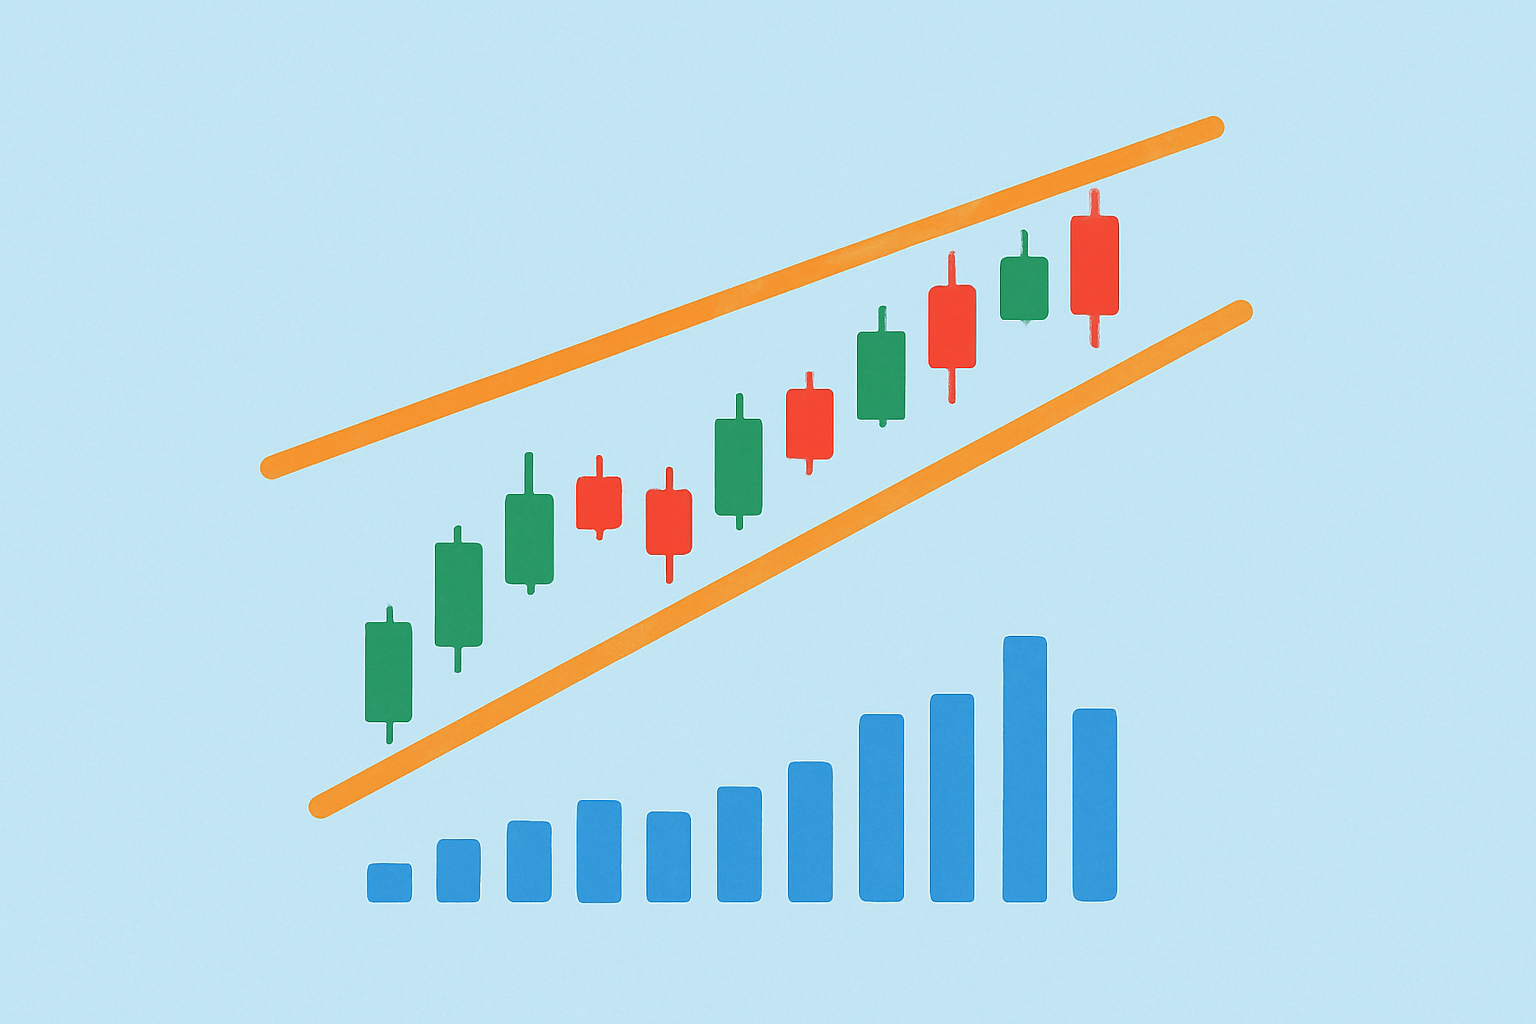
A rising wedge pattern occurs when price action squeezes between two trendlines that both slant upwards but the support line rises quicker than the resistance one. This gradually closes the gap. You’ll often spot this pattern after a strong uptrend or during consolidation, hinting that the buying momentum might be running out of steam.
Unlike bullish wedge patterns that hint at a continuation or upward reversal, rising wedges usually point toward bearish outcomes. It’s easy to mix up rising wedges with straightforward ascending channels. The trendlines converge and volume tends to wane, signaling exhaustion rather than building strength.
| Pattern Type | Trend Direction | Reliability | Common Market Outcomes |
|---|---|---|---|
| Rising Wedge | Upward sloping and narrowing | Often hints at a bearish reversal sneaking in | Price tends to break down after hanging around for a bit |
| Falling Wedge | Downward sloping and narrowing | Usually points toward a bullish reversal making its move | Price tends to break up after chilling sideways for a spell |
| Ascending Channel | Parallel lines trending upward | Reliability is decent, but not foolproof | Generally, it suggests the uptrend will stick around |
| Descending Channel | Parallel lines trending downward | Reliability is decent, but not foolproof | Usually signals the downtrend isn’t going anywhere soon |
Spotting a rising wedge involves really tuning into how the price dances and how the volume plays along on your trading charts.
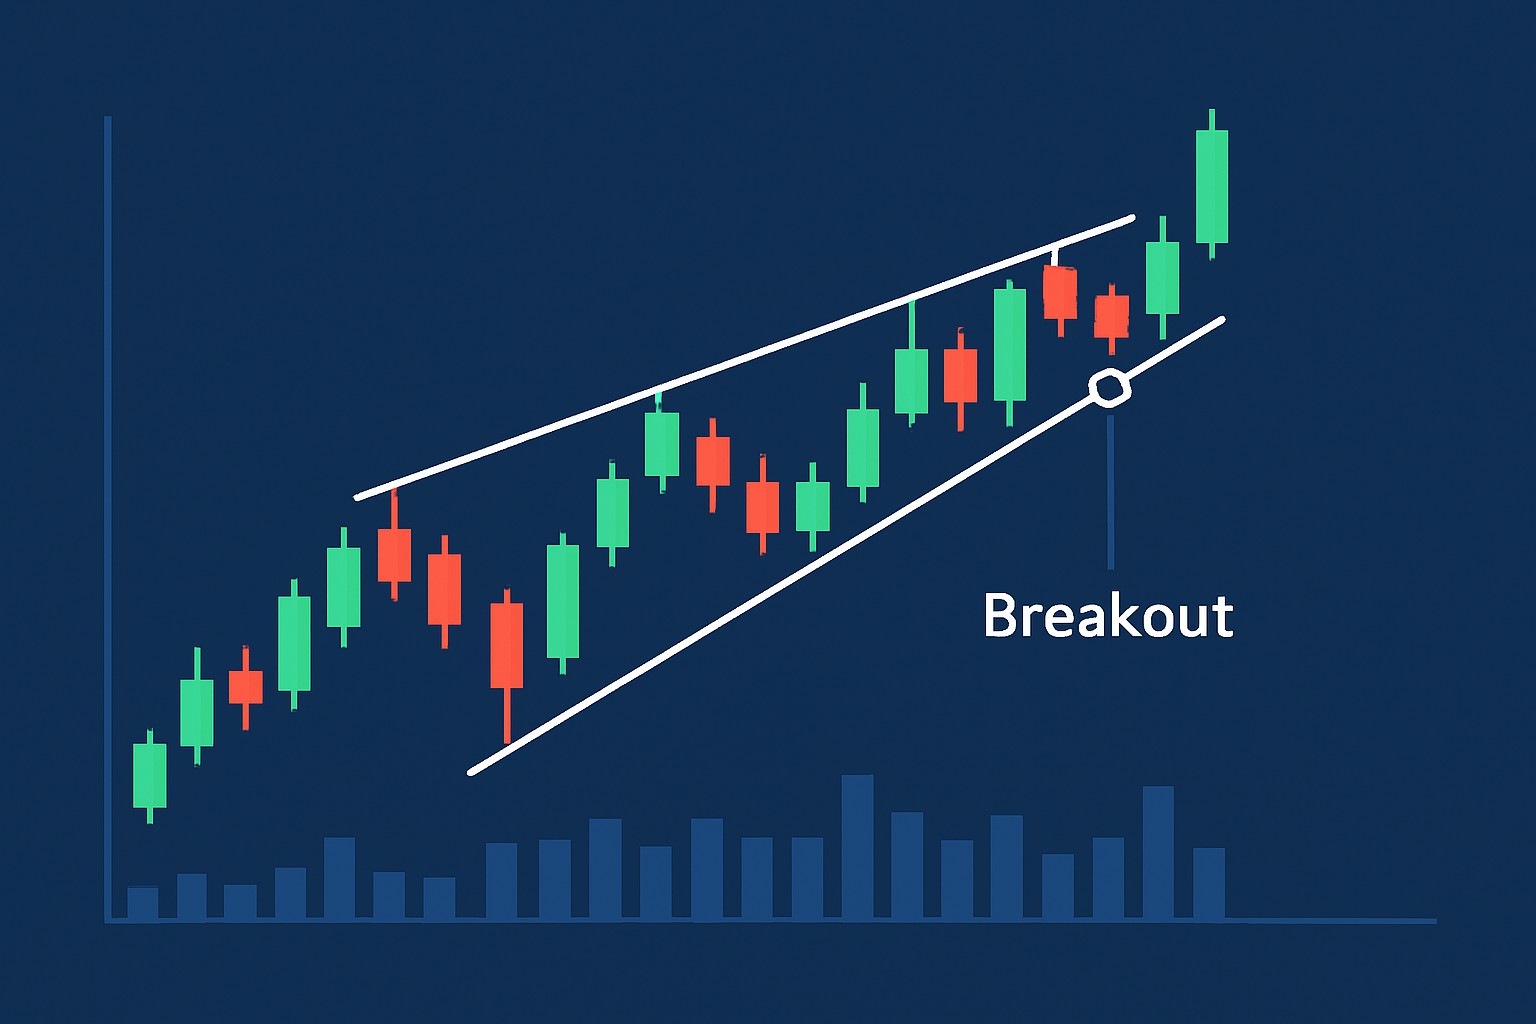
Example of a rising wedge pattern on a candlestick chart highlighting converging trendlines and volume decline
Volume tends to play a pretty telling role when confirming a rising wedge. More often than not it slowly tapers off as the pattern takes shape, hinting that buyers are starting to lose steam. This gradual dip in volume actually cranks up the signal’s credibility because a breakout—usually downward—is looming.
Start by picking a trading timeframe that feels right—daily or 4-hour charts often work well because patterns tend to carry more weight there. 2. Take a close look at your charts for trendlines that slope upward and gradually come together, forming the classic wedge shape.
Make sure the trading volume drops as the wedge develops since that usually signals momentum is losing steam.
Watch carefully for a breakout below the support trendline because this is what really confirms the pattern's bearish outcome.
Remember to rely on other trusted technical tools like RSI or MACD to confirm that momentum shift and boost your confidence in making trade decisions.
Using advanced charting platforms like TradingView or TrendSpider can truly give you a leg up when it comes to spotting rising wedges. These tools don’t just come with customizable drawing options—they also offer automated pattern detection and real-time volume analysis, handing you a pretty solid setup to tackle technical analysis with a lot more confidence.
Dodge these pitfalls by scanning patterns across multiple timeframes and mixing volume analysis with price action. Hold your horses until breakouts are confirmed before jumping into trades.
If you’ve ever scratched your head over chart patterns, you’re not alone. The rising wedge pattern is one of those sneaky formations that can really throw traders a curveball. But once you get the hang of it, it can be a handy tool in your trading toolkit. Let’s dive in and break down how to spot it and use it without losing your shirt.
Traders often keep a keen eye out for the rising wedge pattern as a heads-up for potential bearish reversals. It’s a handy little signal that helps them figure out the best moments to jump into short positions or quietly exit long trades.
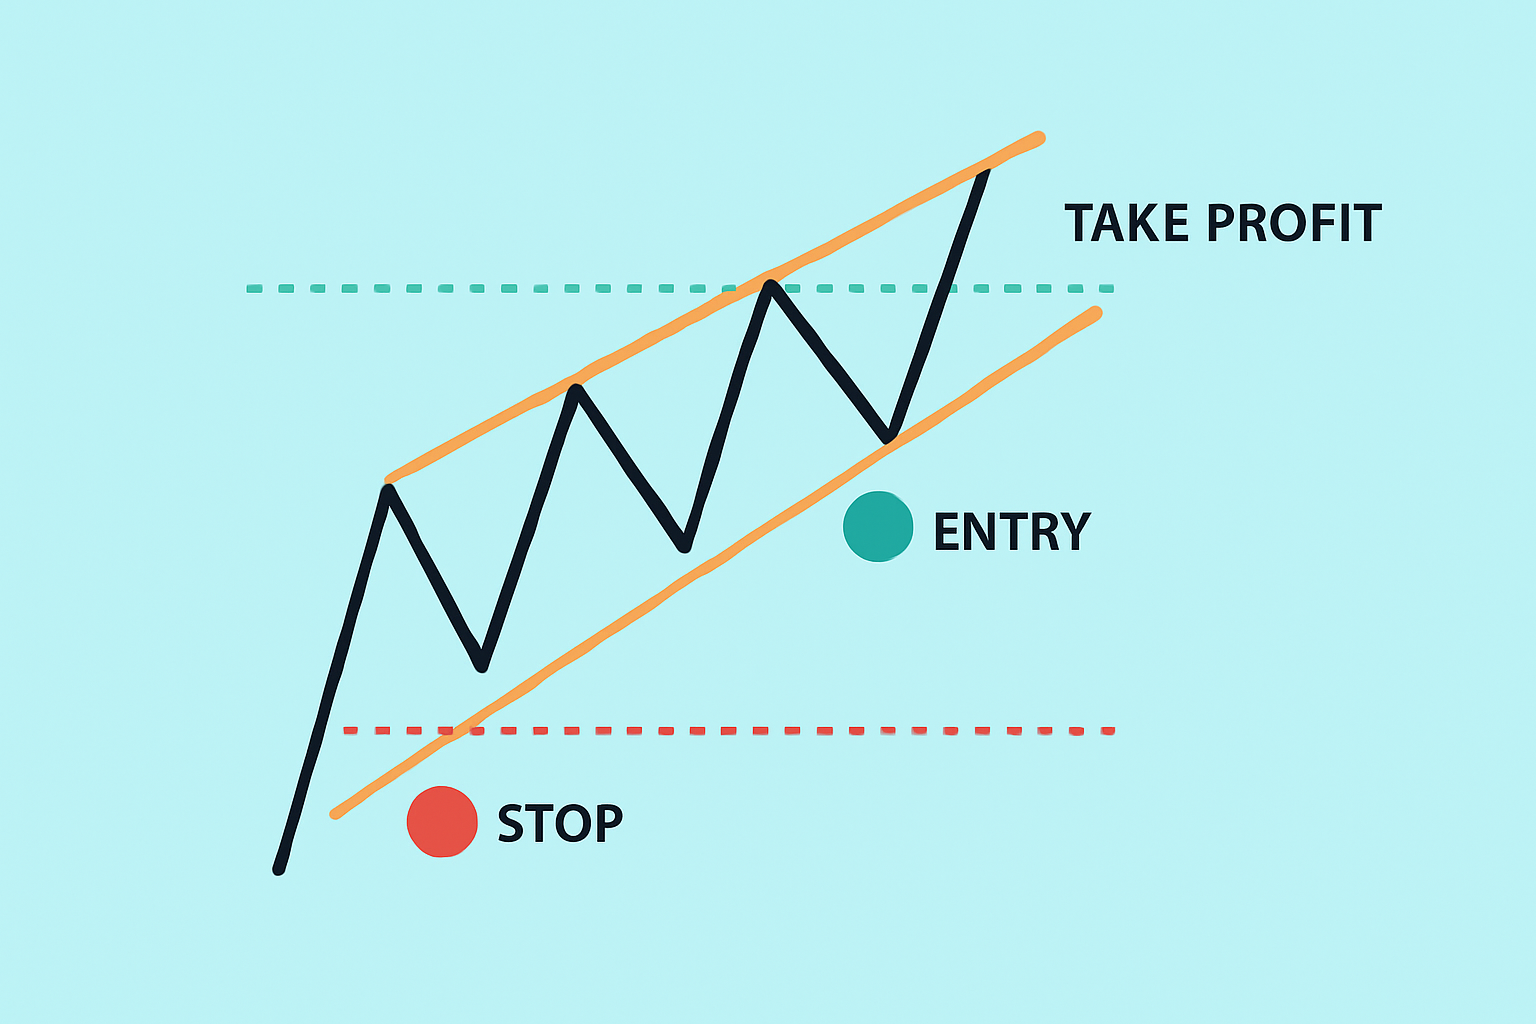
Illustration of trade setup using rising wedge pattern with entry, stop-loss, and target levels
A trader noticed a rising wedge forming on a daily chart of a well-known cryptocurrency, which often points to a potential slowdown in upward momentum. Pairing this pattern with MACD divergence, the trader decided to take a short position just as the wedge’s support line finally gave way. Thanks to careful stop-loss placement and pretty spot-on timing, the trade turned out to be quite profitable when the price took a sharp nosedive shortly after.
Spotting rising wedge patterns definitely calls for steady practice and patience. Keeping a trading journal where you jot down your pattern sightings and trade decisions can help you learn the ropes and fine-tune your accuracy over time. Combine that with ongoing learning and savvy use of advanced analysis tools.

Struggling to improve your trading performance? Edgewonk's advanced analytics tools are designed to give you the edge you need.
With detailed trade journaling, robust strategy analysis, and psychological insights, you'll gain a comprehensive understanding of your strengths and weaknesses. Don't miss out on this game-changing opportunity.

16 posts written
Discover the doji candlestick—a powerful price action signal revealing market indecision. This begin...

Unlock the power of the head and shoulders pattern with this complete guide. Learn to spot, trade, a...

Unlock the power of candle patterns to decode market psychology and improve your trading precision....

Learn how the harami candlestick pattern signals potential market reversals. This guide breaks down...