


Technical Analysis
Master the Bear Flag Setup
Unlock the power of the bear flag pattern with our practical, step-by-step guide. Understand market...

The wedge pattern is a classic chart setup in technical analysis that individuals often get a bit tangled up in, yet it quietly holds a important spot when it comes to spotting possible reversals or continuations of market trends.
Rising and falling wedge patterns really stand out as clear chart formations that traders often lean on to get a sneak peek at upcoming price changes. These patterns usually give a heads-up on shifts in momentum just before major market moves.
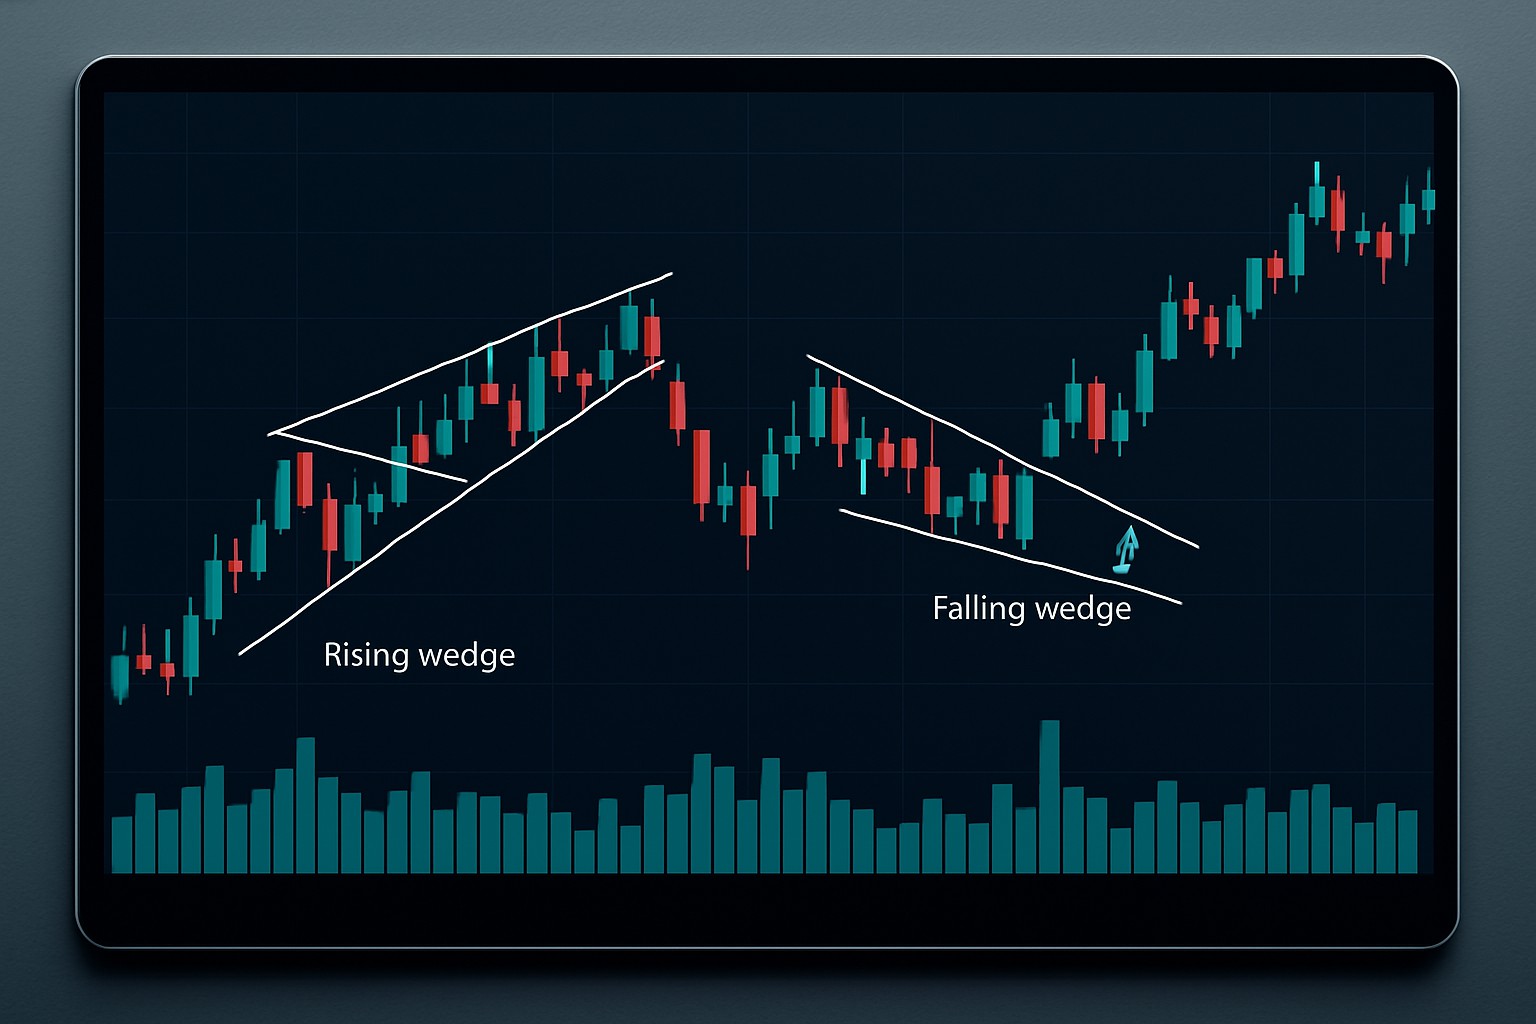
A wedge pattern shows up when price movements get squeezed between two trendlines that slowly close in on each other, tightening the price range like a slowly tightening noose.
Imagine a wedge pattern like water winding its way through a narrowing river channel. As the banks squeeze closer the pressure builds up until the water bursts free in a fresh, powerful direction.
A rising wedge pattern is marked by two trendlines that slope upward and gradually draw closer together over time. It hints that the buying pressure might be starting to ease off, even though prices are still making their climb.
Many beginners often jump to the conclusion that rising wedges are purely bullish patterns, simply because prices are inching up within the formation. The real kicker lies in the shrinking range and falling volume, quietly hinting that momentum is losing steam.
Spot a rising wedge by sketching two trendlines that track the highs and lows of price swings—both leaning upwards and gradually closing in. You will usually notice volume tapering off as this wedge forms, which is a bit like the market catching its breath.
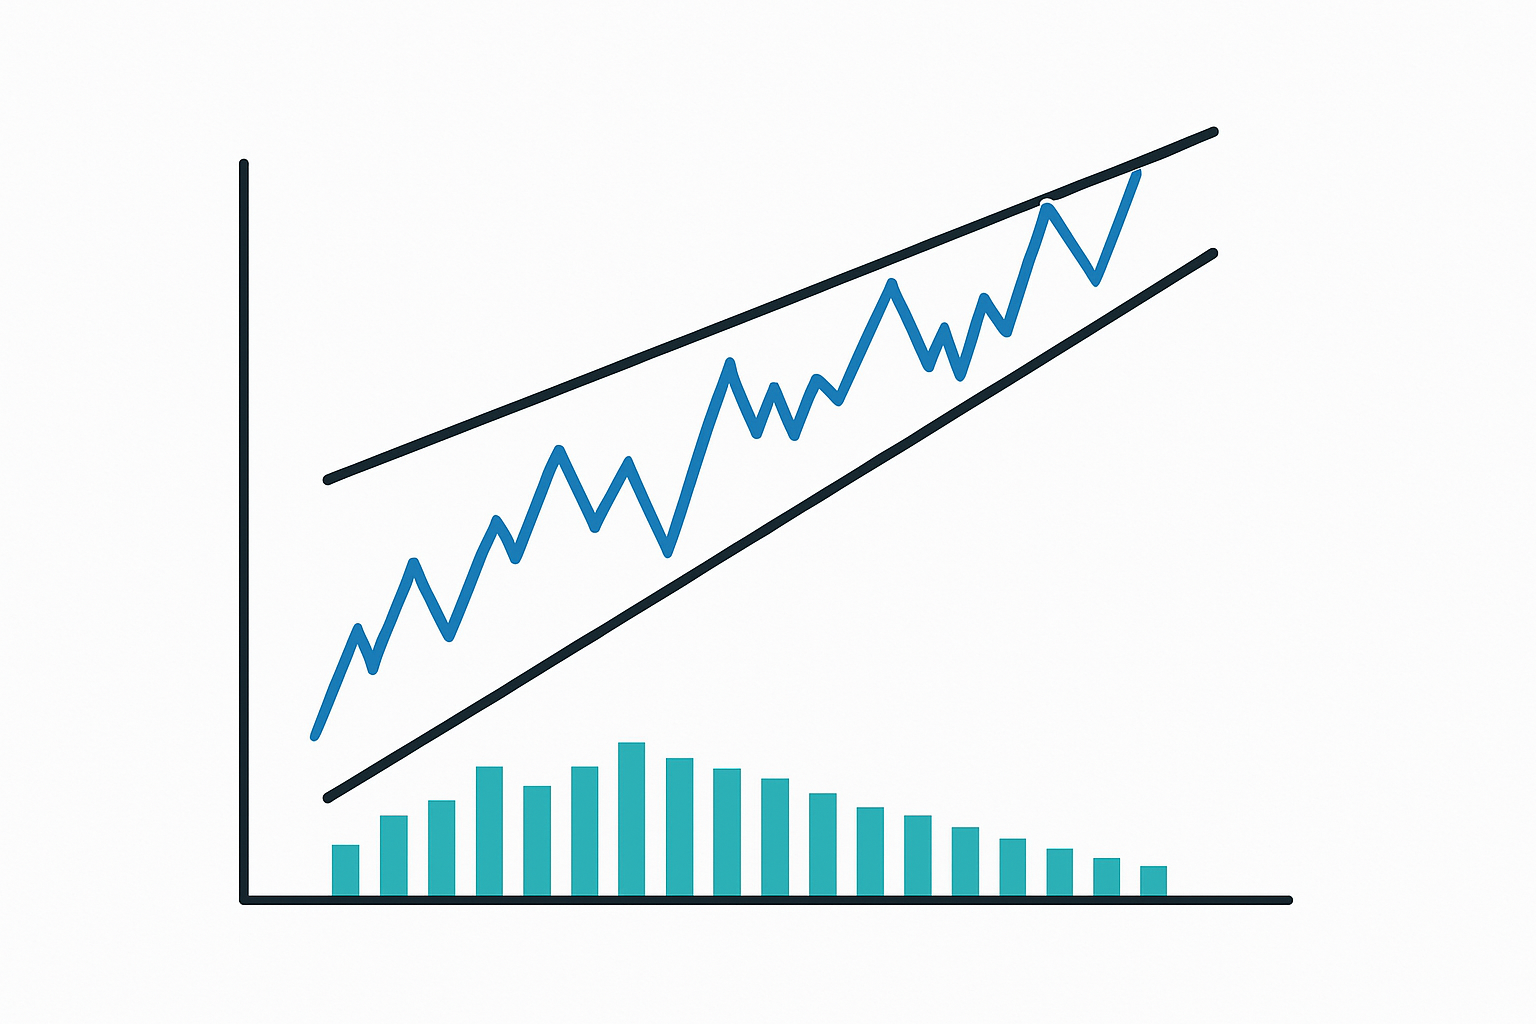
Chart illustration showing a confirmed rising wedge pattern with volume declining as price converges upwards.
The falling wedge is shaped by two downward sloping trendlines that gradually move closer together, signaling that the selling pressure is starting to let up.
Traders often get their wires crossed by mixing up falling wedges with plain downtrends or bearish flags and miss the subtle shift in momentum that falling wedges usually reveal. Spot that tightening price range paired with a drop in volume—kind of like sellers slowly running out of steam instead of rallying to push prices down more.
You can spot a falling wedge by sketching two downward-sloping trendlines that hug the highs and lows, slowly inching closer together like they’re about to meet at a secret rendezvous. Volume tends to taper off as this pattern takes shape—like traders are holding their breath, waiting for the next move.
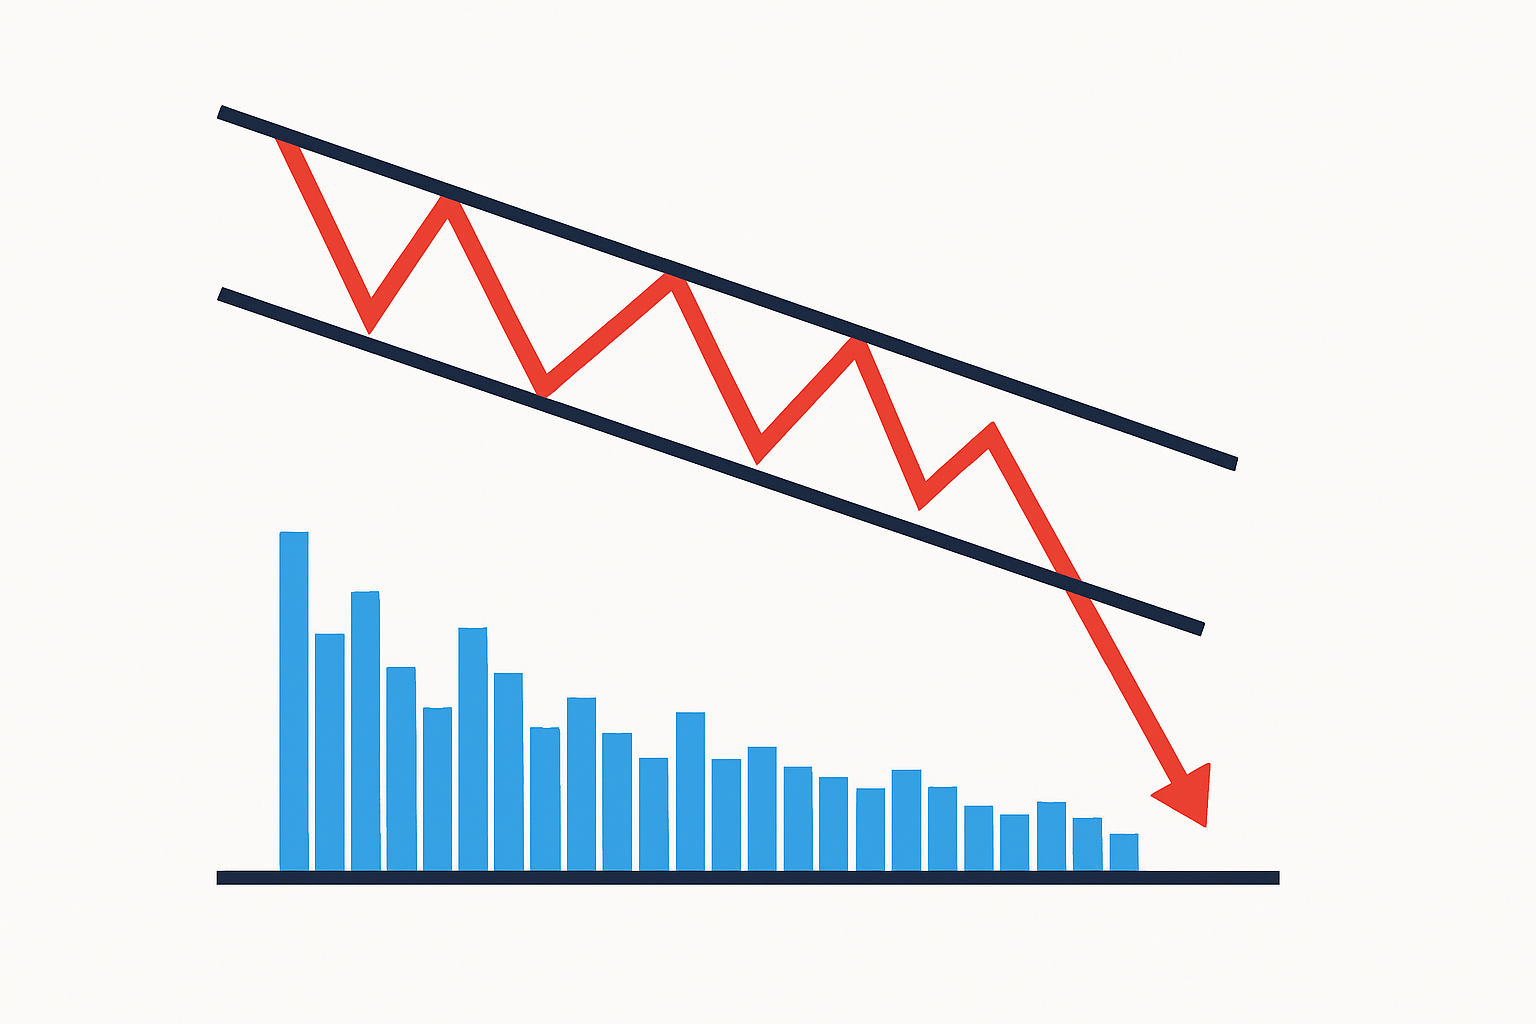
Visual of a falling wedge pattern highlighting converging downtrend lines accompanied by reducing trading volume.
Trading wedge patterns typically involves a few straightforward steps like keeping a close eye on breakout directions and sticking to rock-solid risk management. It pays off to patiently wait for confirmation signals because jumping the gun often leads to those pesky false breakouts.
Spot the wedge formation that usually shows up as clearly converging trendlines—best done on reliable charting platforms like TradingView where the visuals won’t lead you astray.
Hold your horses until the breakout outside the wedge is confirmed, ideally backed up by a spike in volume or other solid technical clues that tell you this move isn’t a false alarm.
Set your entry point just beyond the breakout to lower the odds of getting played by those pesky false signals lurking around.
Place stop-loss orders either snug inside or just outside the opposite side of the wedge—think of it as your safety net that keeps unwelcome surprises at bay.
Pick your profit targets based on previous support or resistance levels or by eyeballing measured moves equal to the wedge’s height because aiming with local context usually pays off better.
Breakouts from wedges can head either way—up or down—and every now and then, you’ll spot those pesky false breakouts that pop up just long enough to trick you before the price swings back the other way. Glancing over other indicators and really tuning into the price action itself often sheds light on which moves are the real deal and which ones are just clever traps.
Patience really pays off when trading wedge patterns. Waiting for that clear confirmation before jumping in not only shields your capital but also saves you from the headache of chasing after false signals that lead nowhere.
Traders often slip up by mixing up wedge patterns or brushing off volume changes. They also set stop-loss orders that are way too weak or lean solely on wedges without stepping back to see the bigger market picture.
Dodge these common pitfalls by pairing wedge pattern analysis with volume checks and trend assessments along with a few other technical methods.

Are you tired of juggling multiple tools for your trading needs? TradingView is the all-in-one platform that streamlines your analysis and decision-making.
With its powerful charting capabilities, real-time data, and vibrant community, TradingView empowers traders like you to stay ahead of the market. Join thousands who trust TradingView for their trading success.

10 posts written
Unlock the power of the bear flag pattern with our practical, step-by-step guide. Understand market...

Learn how the harami candlestick pattern signals potential market reversals. This guide breaks down...

Unlock the power of the head and shoulders pattern with this complete guide. Learn to spot, trade, a...

Unlock the power of candle patterns to decode market psychology and improve your trading precision....