


Technical Analysis
Master the Bear Flag Setup
Unlock the power of the bear flag pattern with our practical, step-by-step guide. Understand market...

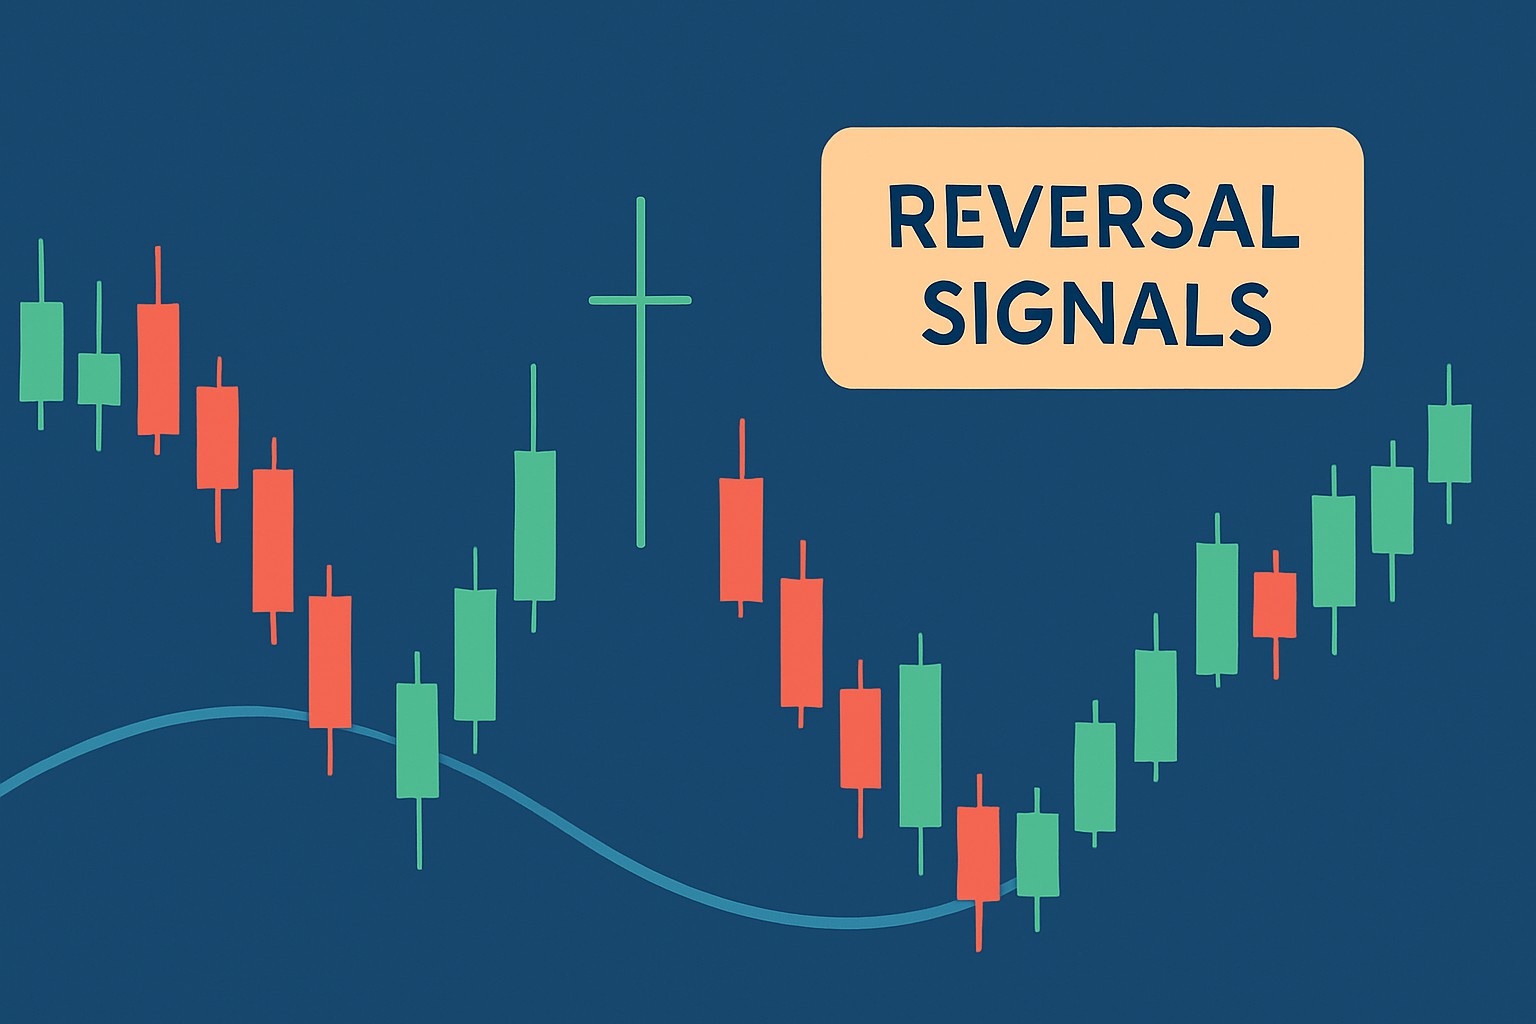
The dragonfly doji is a pretty eye-catching candlestick pattern that often hints at possible market reversals. Traders often lean on it to spot shifts in momentum and to help steer their entry or exit moves.
A dragonfly doji is a candlestick pattern that shows up with a long lower shadow while the open and close prices hover near the period's high creating a distinctive 'T' shape. It’s a classic sign of market indecision. Buyers have stepped in and taken the reins.
The dragonfly doji tends to pop up across various markets like stocks, forex and cryptocurrencies. It usually plays nicest on daily and hourly charts where volume and price trends give us clearer hints about potential reversals.
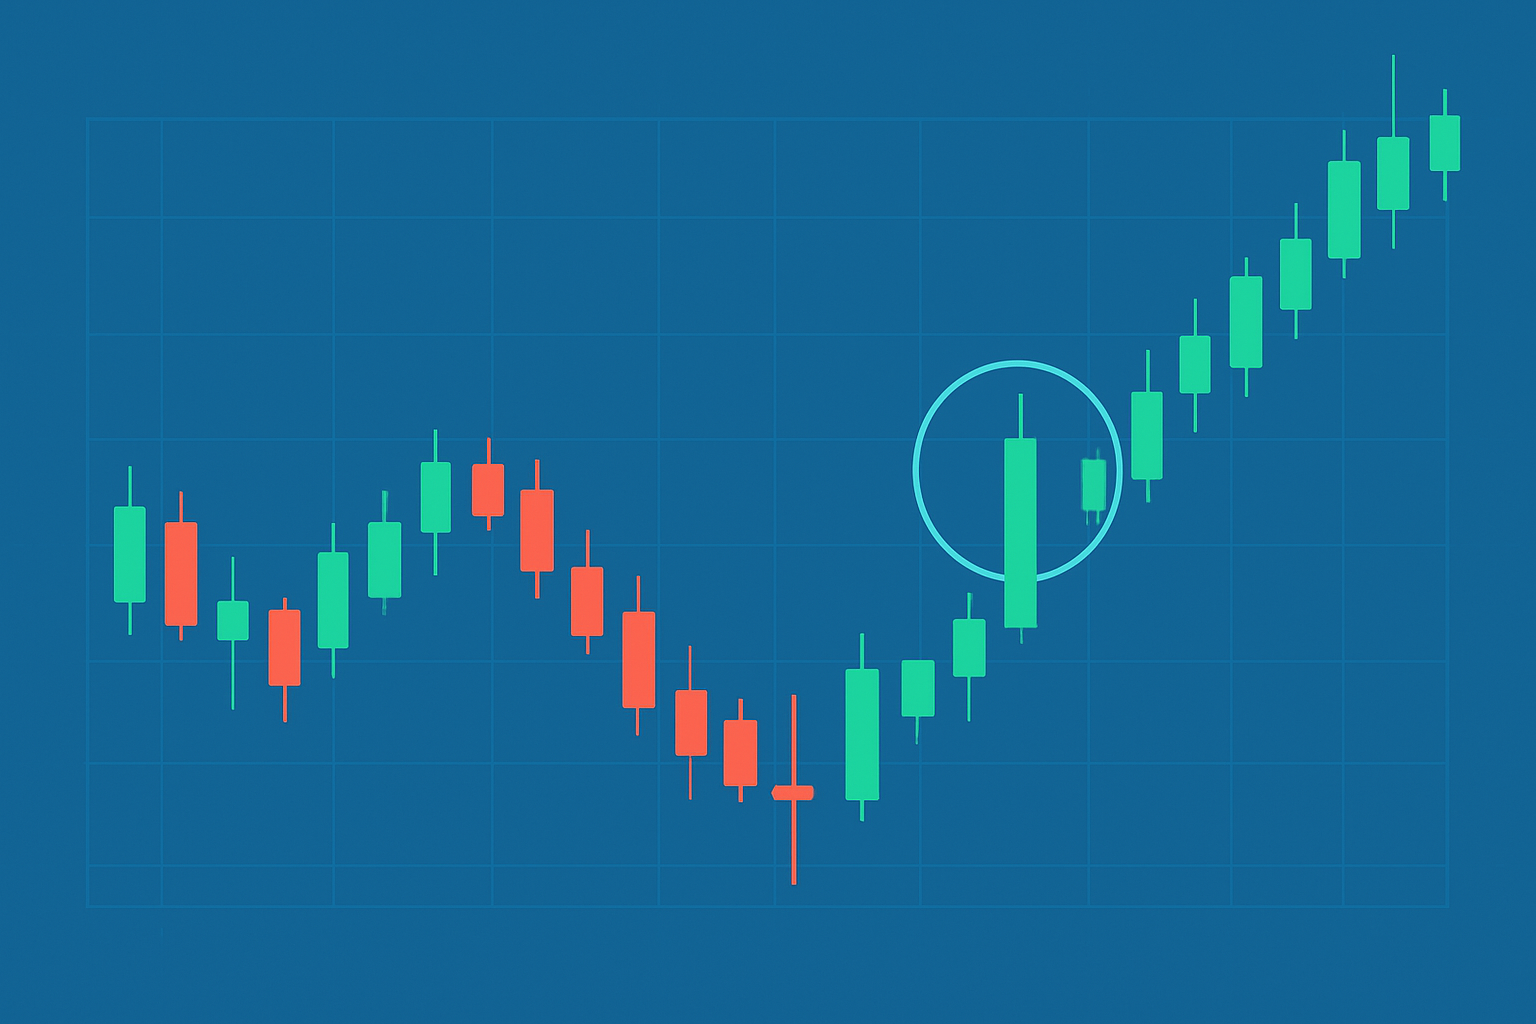
A highlighted dragonfly doji candlestick pattern on a daily stock price chart illustrating its distinctive shape.
The dragonfly doji reveals a tug-of-war between sellers and buyers. Initially, sellers grab the reins and push prices sharply downward. Buyers jump back in and steer the price right up to close near the session’s high.
The dragonfly doji tells a bit of a tug-of-war tale: sellers try to drag prices down, but buyers aren’t having it and rally to push them back up. It’s a subtle hint that the bulls might just be gearing up to take the reins.
To nail down a valid dragonfly doji traders need to look closely at the candle’s shape compared to the earlier trend. They should pay attention to volume spikes and the wider market vibe.
Check that the candle sports a long lower shadow because this usually indicates serious selling pressure during that period.
Make sure the open and close prices are nearly the same, sitting right at or very close to the session’s high.
Confirm there is little to no upper shadow, which creates the classic 'T' pattern we all recognize.
Take a look at the volume during that candle and consider the previous trend. You will often see this pattern show up after a downtrend or during a consolidation phase. It’s like the market’s way of catching its breath.
Traders often get the dragonfly doji tangled up with other doji types like the gravestone doji or they miss how important its spot in the trend truly is.
A dragonfly doji often hints at a bullish reversal after a downtrend and signals that selling pressure could be loosening and buyers are starting to flex their muscles. Sometimes it plays a trickier role by showing up near market highs and suggesting a bearish reversal might be on the horizon.
| Trend Direction | Signal Interpretation | Confirmation Signals | Reliability |
|---|---|---|---|
| Downtrend | Suggests there’s a chance for a bullish reversal to take hold | A noticeable bump in volume combined with a strong candle that follows through | Usually pretty reliable, especially if it lines up nicely with known support levels |
| Uptrend | Points to a possible bearish reversal looming | Look for a reversal candle popping up after a rally | Moderately reliable, though I’ve found it often calls for a bit more confirmation before trusting it fully |
Traders usually double-check the dragonfly doji signal by lining it up with other clues like volume spikes and familiar support levels or moving averages.
Trading the dragonfly doji usually pays off to hang tight for price confirmation before jumping in. Then, place your stop losses with a bit of care—no need to get reckless—and aim for profit targets that honestly reflect a sensible risk-reward balance.
Keep an eye out for a dragonfly doji appearing near a well-known support level or an area that looks a bit oversold. These small signals can be very telling.
Wait for a bullish confirmation candle that closes above the doji’s high. This is your green light that a reversal might be starting.
Enter the trade right at the opening of this confirmation candle. If you prefer to be more cautious, you can wait for a slight pullback first.
Place your stop loss just below the lowest tip of the dragonfly doji’s lower shadow. This is a smart way to manage your risk.
Aim for profit targets that offer a comfortable risk-reward balance, such as 2 to 1 or 3 to 1. Alternatively, you can let nearby resistance levels serve as your target zones.
Managing risk carefully is absolutely important when trading dragonfly doji patterns. Traders usually avoid over-leveraging and pick position sizes that fit their overall game plan. They often lean on trailing stops to lock in gains as the price swings their way.
Traders often jump the gun, diving in before a clear confirmation candle shows up. They zero in on the dragonfly doji all by itself, forgetting to step back and see the bigger market picture.
Using the dragonfly doji signal with popular technical indicators like RSI, MACD and support and resistance levels usually gives trading accuracy a nice boost.
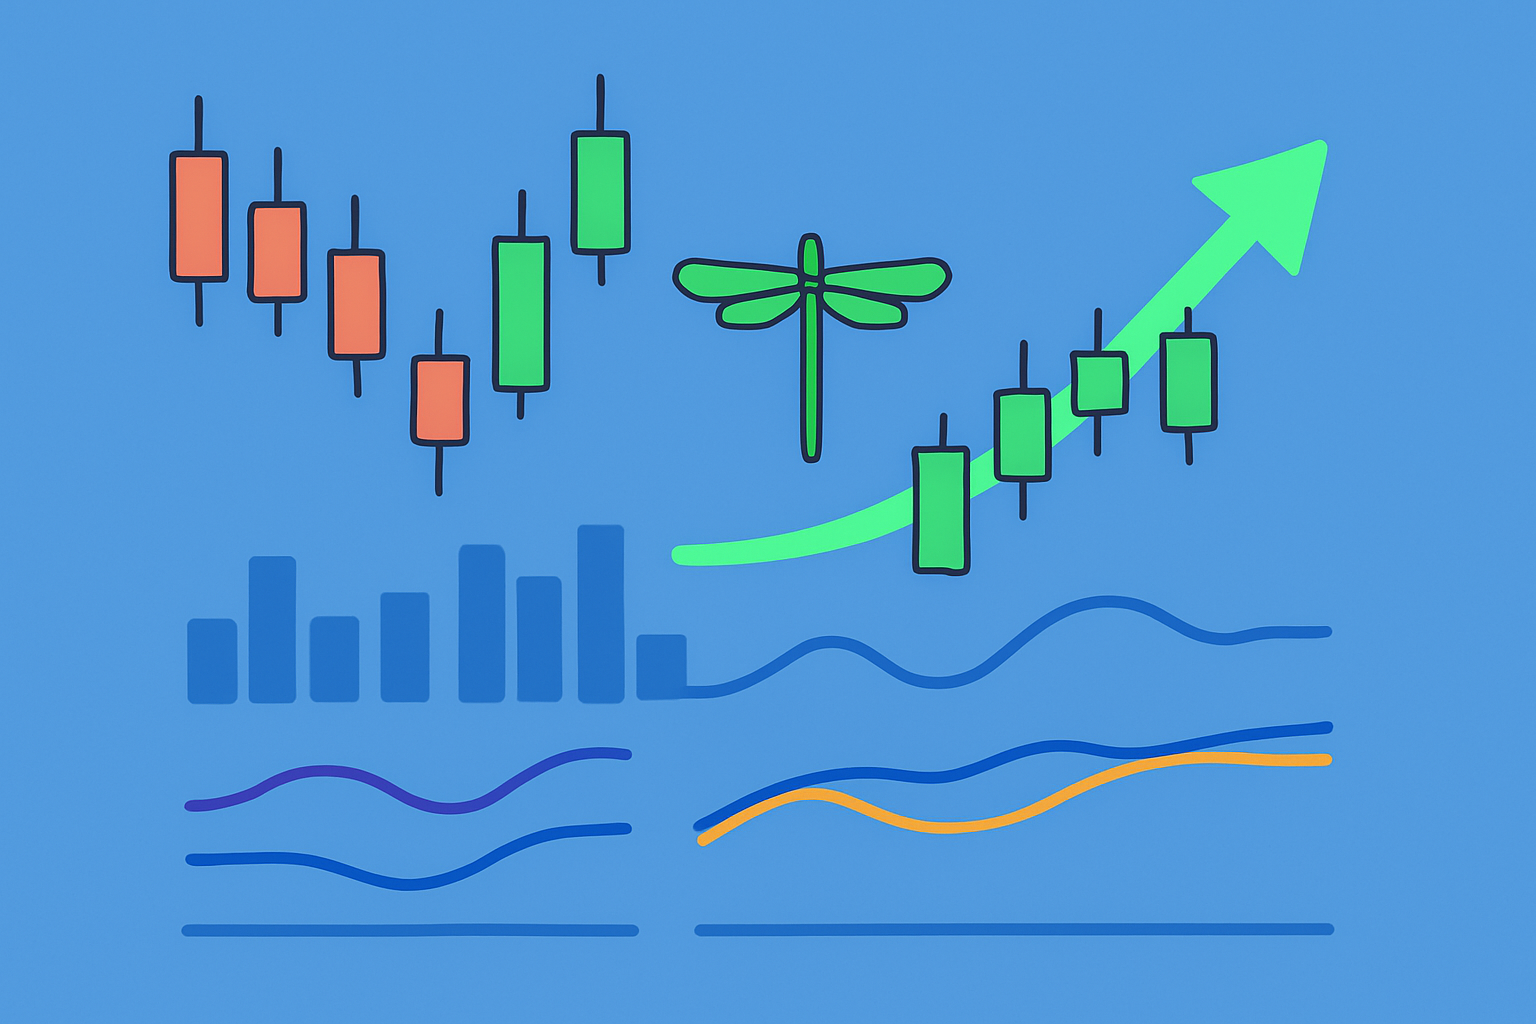
Example of a technical chart illustrating a dragonfly doji accompanied by RSI oversold levels, MACD bullish crossover, and volume spike confirming a reversal.
A recent trade caught my eye when a dragonfly doji popped up at a vital support level teamed with a bullish MACD crossover and an RSI hinting the asset was oversold. As volume started to tick up the price took off sparking a reversal trade that delivered solid returns.

Tired of missing opportunities and making suboptimal trading decisions? TrendSpider's cutting-edge platform automates complex technical analysis, saving you time and reducing human error.
With multi-timeframe analysis, dynamic alerts, backtesting, and customizable charting, you'll gain a competitive edge in identifying trends and making informed trades across global markets.

23 posts written
Unlock the power of the bear flag pattern with our practical, step-by-step guide. Understand market...

Unlock the power of the head and shoulders pattern with this complete guide. Learn to spot, trade, a...

Discover what IOUs mean in finance, their role as informal debt acknowledgments, and how understandi...

Learn how the harami candlestick pattern signals potential market reversals. This guide breaks down...