


Technical Analysis
Master the Bear Flag Setup
Unlock the power of the bear flag pattern with our practical, step-by-step guide. Understand market...

This article explains how bearish engulfing candles can be your early warning system for market dips and help you sharpen your trading game with more confidence.
Bearish engulfing candles are powerful candlestick patterns that traders often lean on when trying to spot potential reversals and fine-tune their trade timing. Catching these patterns is like getting a heads-up that selling pressure is starting to muscle out buying momentum, often signaling a likely dip ahead. By getting comfortable recognizing bearish engulfing candles, traders can sharpen their timing for entries and exits and handle risk with a bit more confidence.
A bearish engulfing candle is a pattern formed by two candles. Picture a big bold red candle that completely swallows the smaller green one that came just before it. This hints that the mood is shifting from bullish optimism to bearish caution.
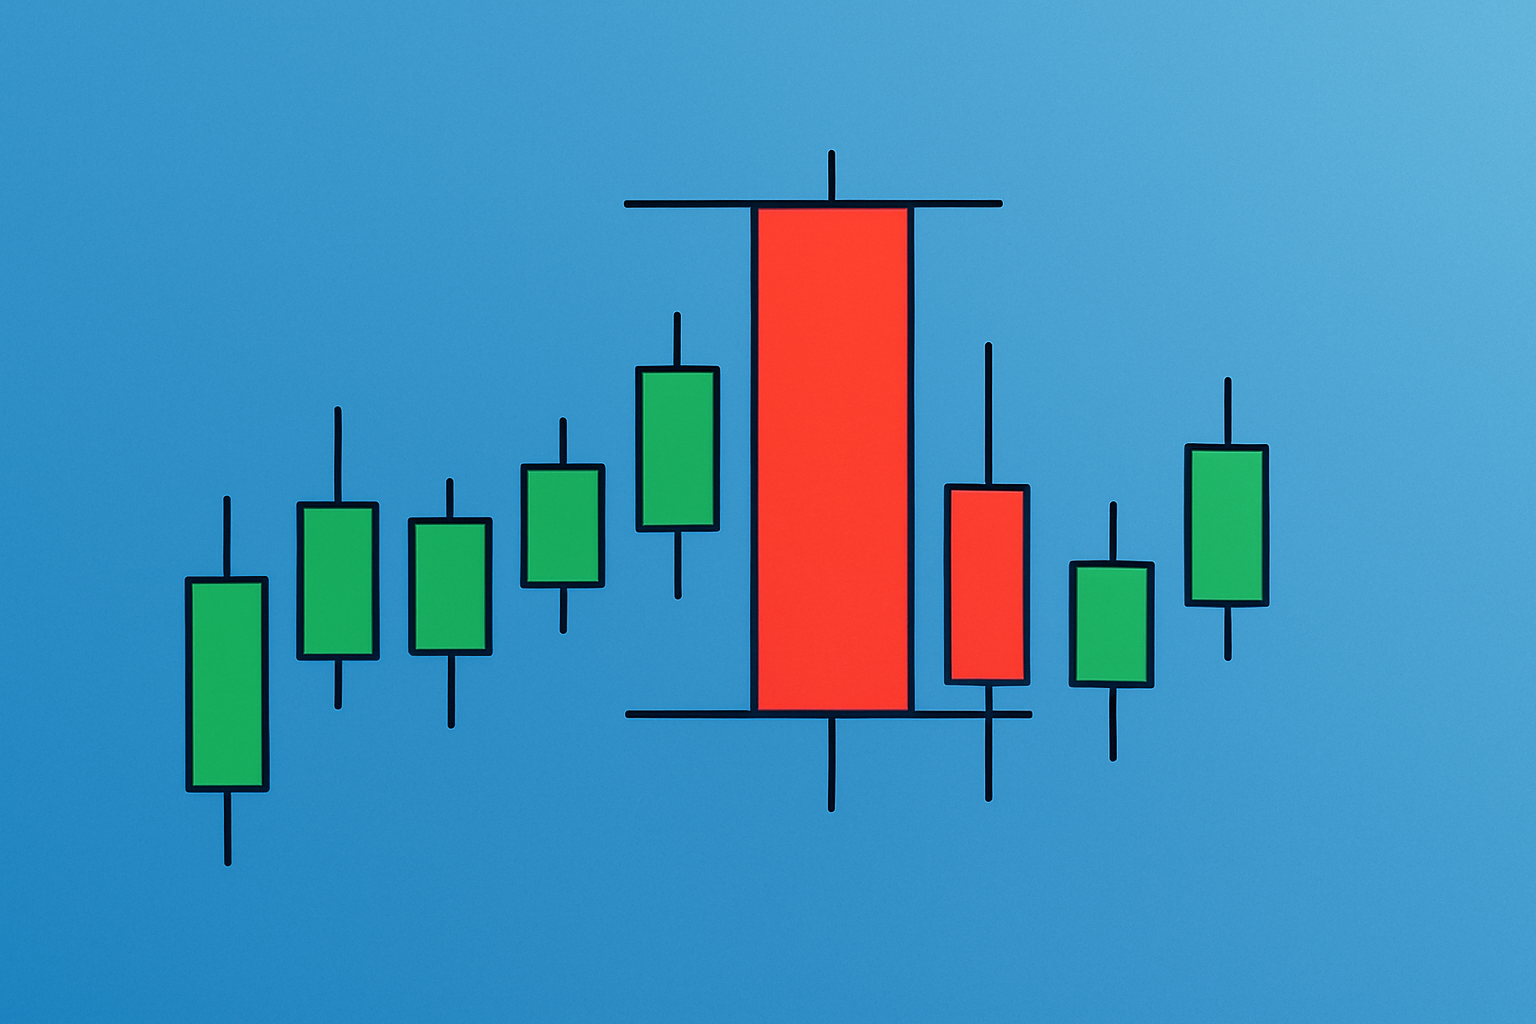
Example of a bearish engulfing candlestick pattern on a price chart
When it comes to reading the market’s mood swings, Bearish Engulfing Patterns are like those unmistakable red flags waving in the wind. They might seem subtle at first glance, but if you’ve spent any time staring at charts, you know these patterns can make you sit up and take notice. Essentially, they signal a potential reversal to the downside, telling traders that selling pressure is gathering steam. While they’re not foolproof crystal balls, spotting one could save you from jumping the gun or holding on too long to a losing trade. In my experience, adding a little patience after spotting a Bearish Engulfing Pattern often pays off better than rushing in headfirst. It’s one of those handy tools in the trading toolbox that quietly shouts, "Heads up!" just when you need it most.
Bearish engulfing patterns matter a great deal because they often signal a possible turnaround from an uptrend to a downtrend, flagging growing selling pressure. Psychologically speaking, this pattern captures a swift mood swing in the market—buyers suddenly lose their grip as sellers jump in with both feet. This jarring shift often kicks off sell-offs, making bearish engulfing candles a handy tool for knowing when to jump into short positions or cut your losses on longs.
Successful traders often wait patiently for a bearish engulfing candle to confirm that momentum has truly shifted before jumping into a trade — it acts like a reliable green light on the chart that’s hard to ignore.
You want to be sure the market was cruising upwards or caught in a bullish phase before this pattern makes an appearance.
Keep your eyes peeled for the classic two-candle setup: a smaller green candle quickly followed by a larger red one that steals the show.
The second candle needs to fully engulf the first. That red candle wraps around the entire body of the green candle from open to close like a big bear hug.
Give the signal’s strength a thorough once-over by checking the volume and price action nearby. This helps you get a feel for whether the bearish momentum is genuinely packing a punch or just blowing hot air.
When you’re on the lookout for bearish engulfing patterns, be careful not to trip over common slip-ups like misreading candle sizes or zoning out on the bigger picture of the prior trend. Candles with tiny bodies or patterns that pop up after a bit of sideways price shuffle can easily lead you down the wrong path.
When bearish engulfing candles team up with other technical indicators such as RSI, moving averages, volume, support and resistance or MACD, traders often find themselves sifting through the noise to weed out weaker signals. This boosts the odds that their setups actually hold water. Platforms like TradingView lend a helping hand here and make it a breeze to stitch these indicators together.
When it comes to trading, spotting a bearish engulfing candle can feel like catching a sneaky little signal waving at you from the charts. These patterns, while sometimes subtle, have a knack for hinting that the sellers are about to take the reins. In my experience, weaving these candles into your strategy can really sharpen your sense for when the market might be gearing up for a downturn. Let’s dive into some practical tactics that leverage this powerful indicator, keeping you one step ahead without overcomplicating things.
Keep an eye out for a bearish engulfing candle forming near a recent resistance level during an uptrend. This often hints at a potential reversal if you’re lucky.
Consider jumping into a short position either right when that engulfing candle closes or as soon as the next candle confirms the signal.
Always tuck your stop-loss just above the high of the engulfing candle. Think of it as your safety net to avoid nasty surprises.
Aim your profit targets around previous support levels or shoot for a solid risk-to-reward ratio of at least 2 to 1. It’s like setting yourself up for a fair shake.
Tailor your position size to what feels comfortable on your risk scale and don’t forget to keep a vigilant eye on the trade. If volume or momentum starts turning south, it’s usually a good idea to exit.
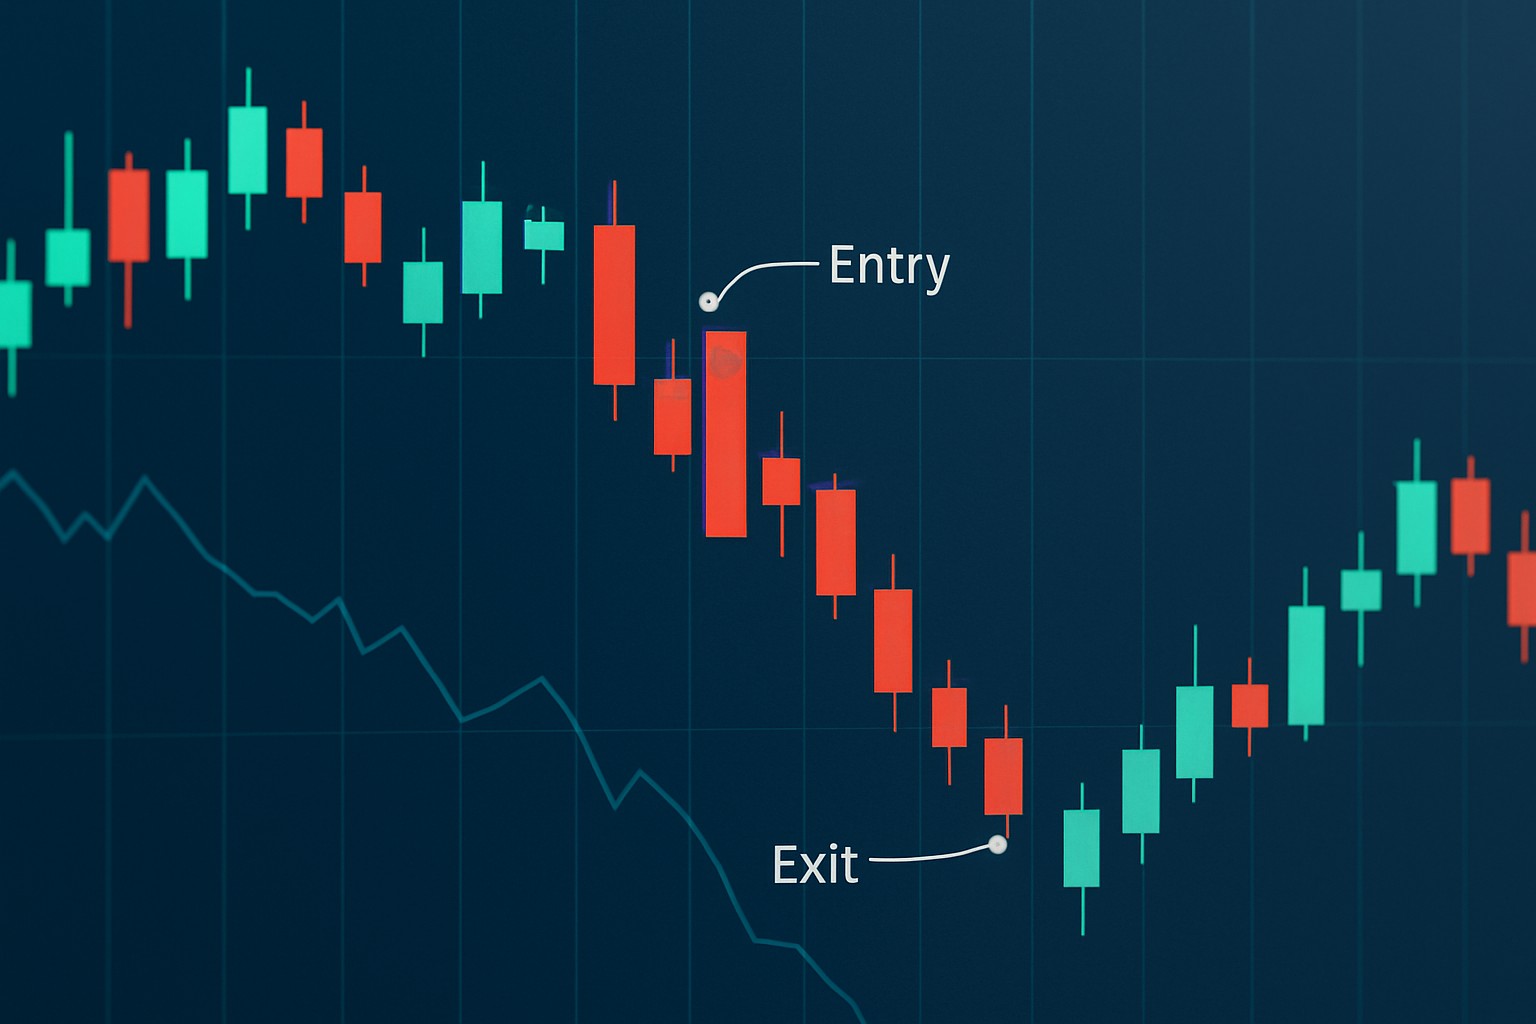
Bearish engulfing patterns tend to work well across a variety of markets like stocks, forex and cryptocurrencies. Take a daily stock chart for example. Catching a bearish engulfing candle near resistance levels often hints at a solid opportunity to short especially when high volume gives you extra confidence. On the quicker side, like 15-minute crypto charts, it usually points to a swift pullback that day traders and scalpers live for. It’s smarter to pair this pattern with other tools and rigorously test your strategy.
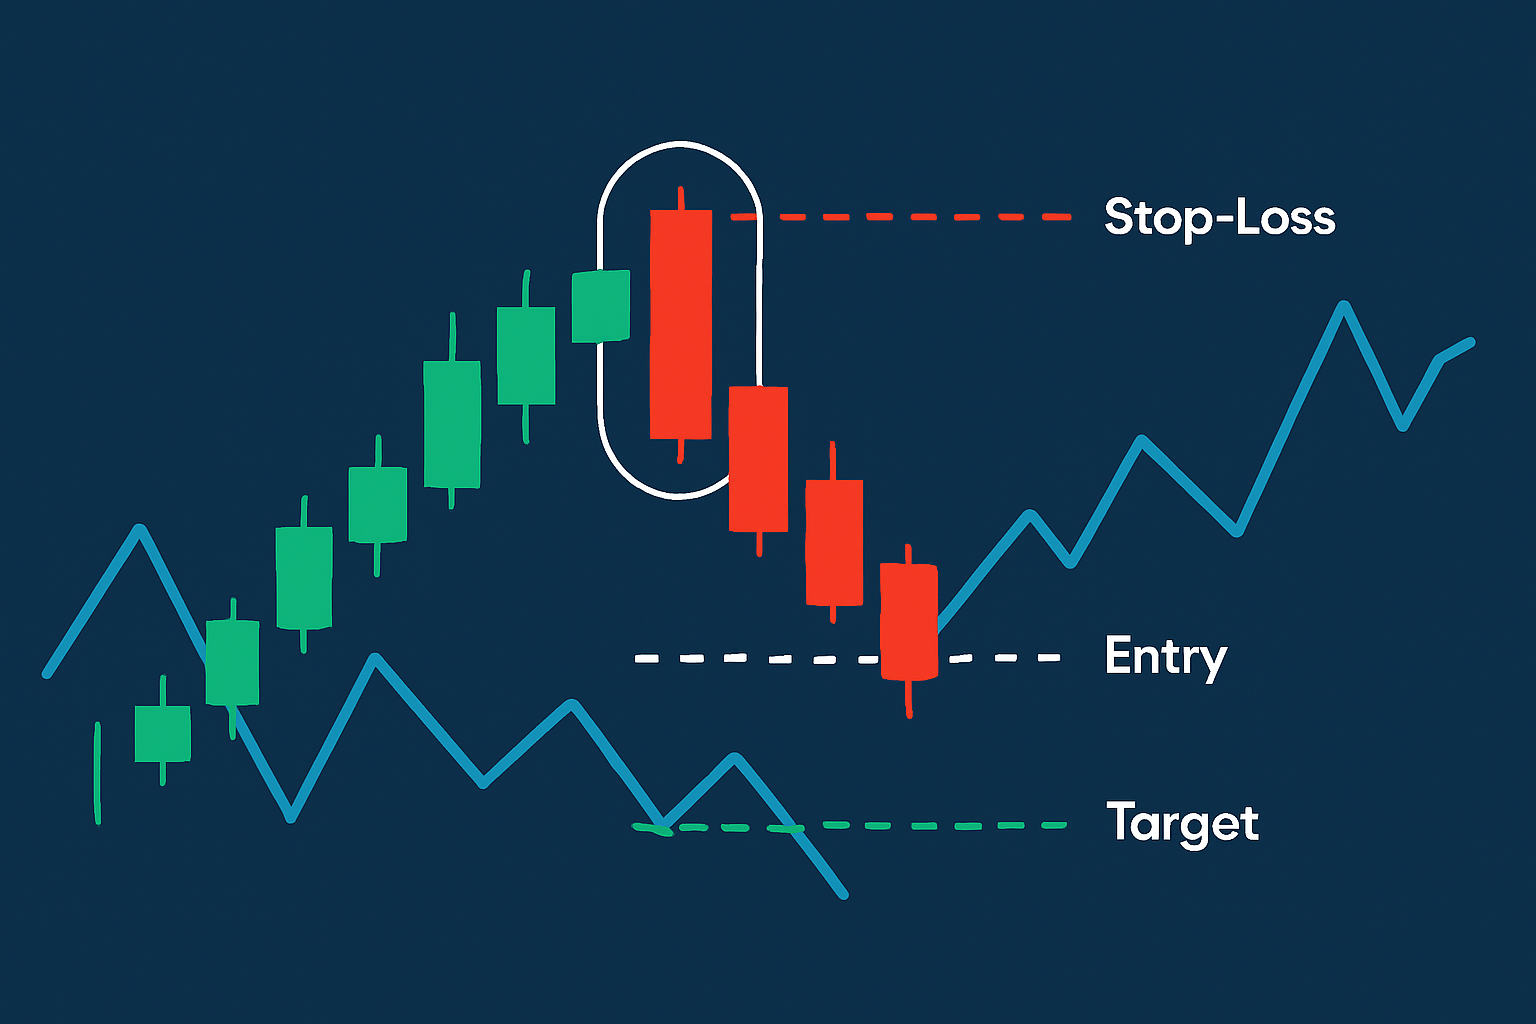
Illustration of a bearish engulfing trade setup highlighting entry and exit points
To really boost your accuracy when trading bearish engulfing candles, it is key to ensure your trades align with the overall trend and those important confirmation signals. Think of it as having a safety net. Practice careful risk management by setting stop losses and keeping your position sizes under control. Don’t just rely on the pattern alone. Verify its validity by closely examining candle size and volume.

Are you tired of juggling multiple tools for your trading needs? TradingView is the all-in-one platform that streamlines your analysis and decision-making.
With its powerful charting capabilities, real-time data, and vibrant community, TradingView empowers traders like you to stay ahead of the market. Join thousands who trust TradingView for their trading success.

23 posts written
Unlock the power of the bear flag pattern with our practical, step-by-step guide. Understand market...

Unlock the power of candle patterns to decode market psychology and improve your trading precision....

Unlock the power of the head and shoulders pattern with this complete guide. Learn to spot, trade, a...

Master the hammer candlestick pattern—a key indicator for market reversals. This beginner-friendly g...