


Technical Analysis
Master the Bear Flag Setup
Unlock the power of the bear flag pattern with our practical, step-by-step guide. Understand market...

The evening star pattern is a key candlestick formation that often signals a turn from an uptrend to a downtrend. Spotting this pattern can give traders an edge by helping them anticipate market reversals more reliably and nail their timing for entries and exits. It also helps handle risk with more confidence when markets get choppy.
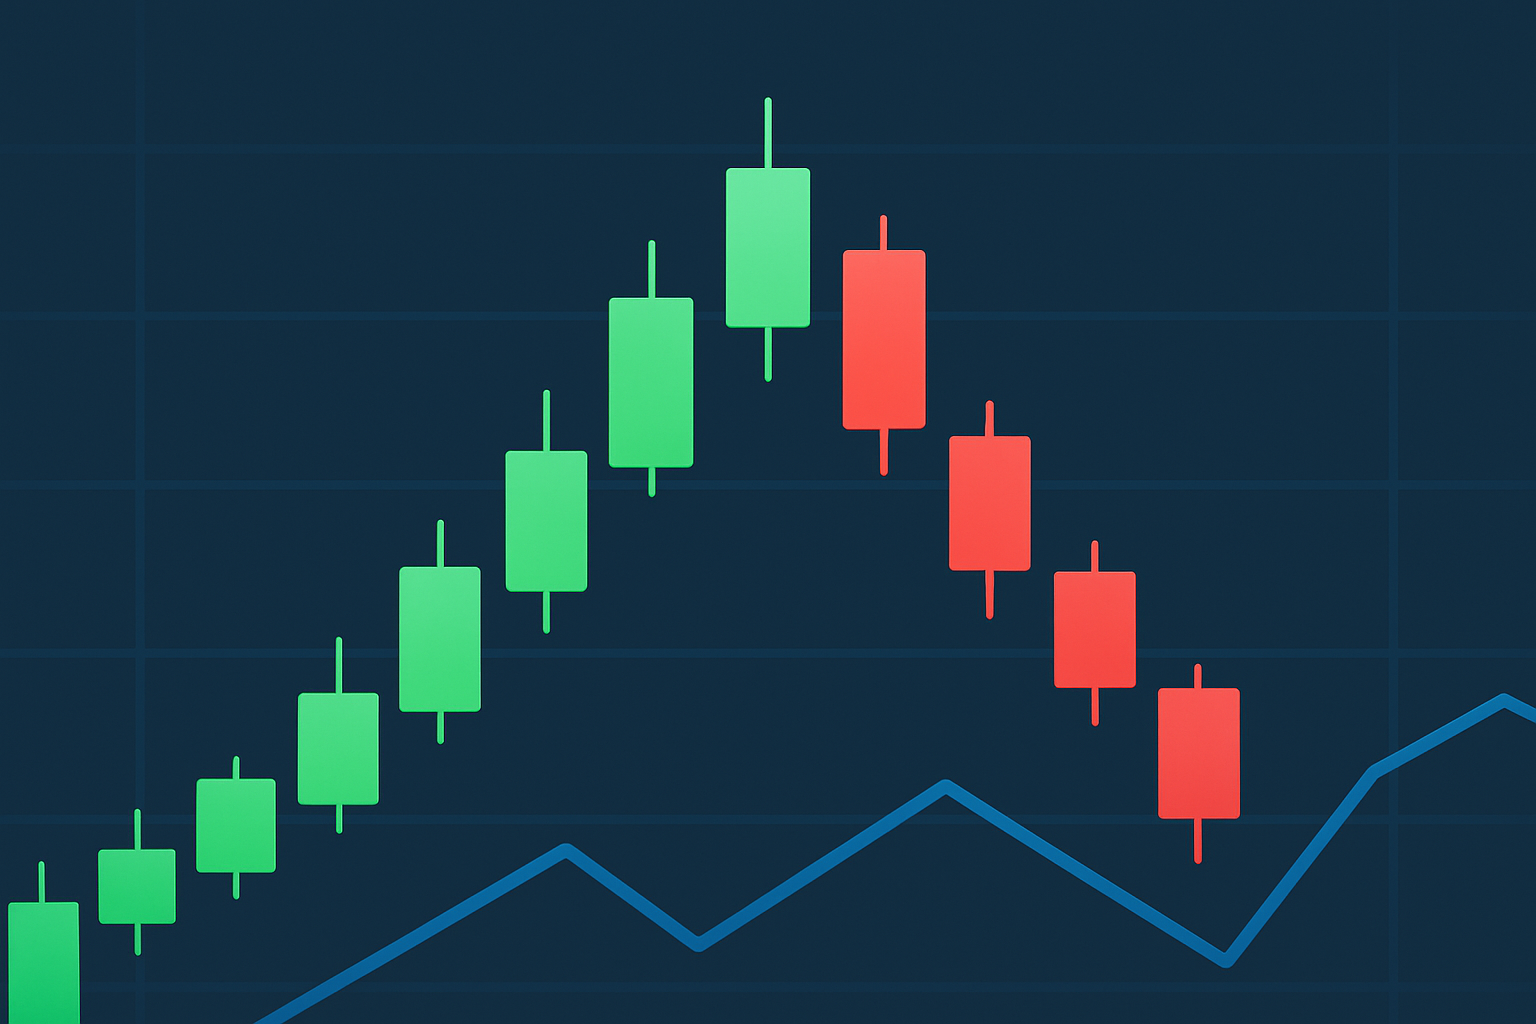
Candlestick patterns act as handy visual cues in technical analysis and paint a clear picture of price movements over specific time frames. Each candlestick shows the opening and closing prices and the high or low prices. This gives traders a quick snapshot of the market's mood. Patterns like the evening star string together several candles to spotlight shifts in momentum.
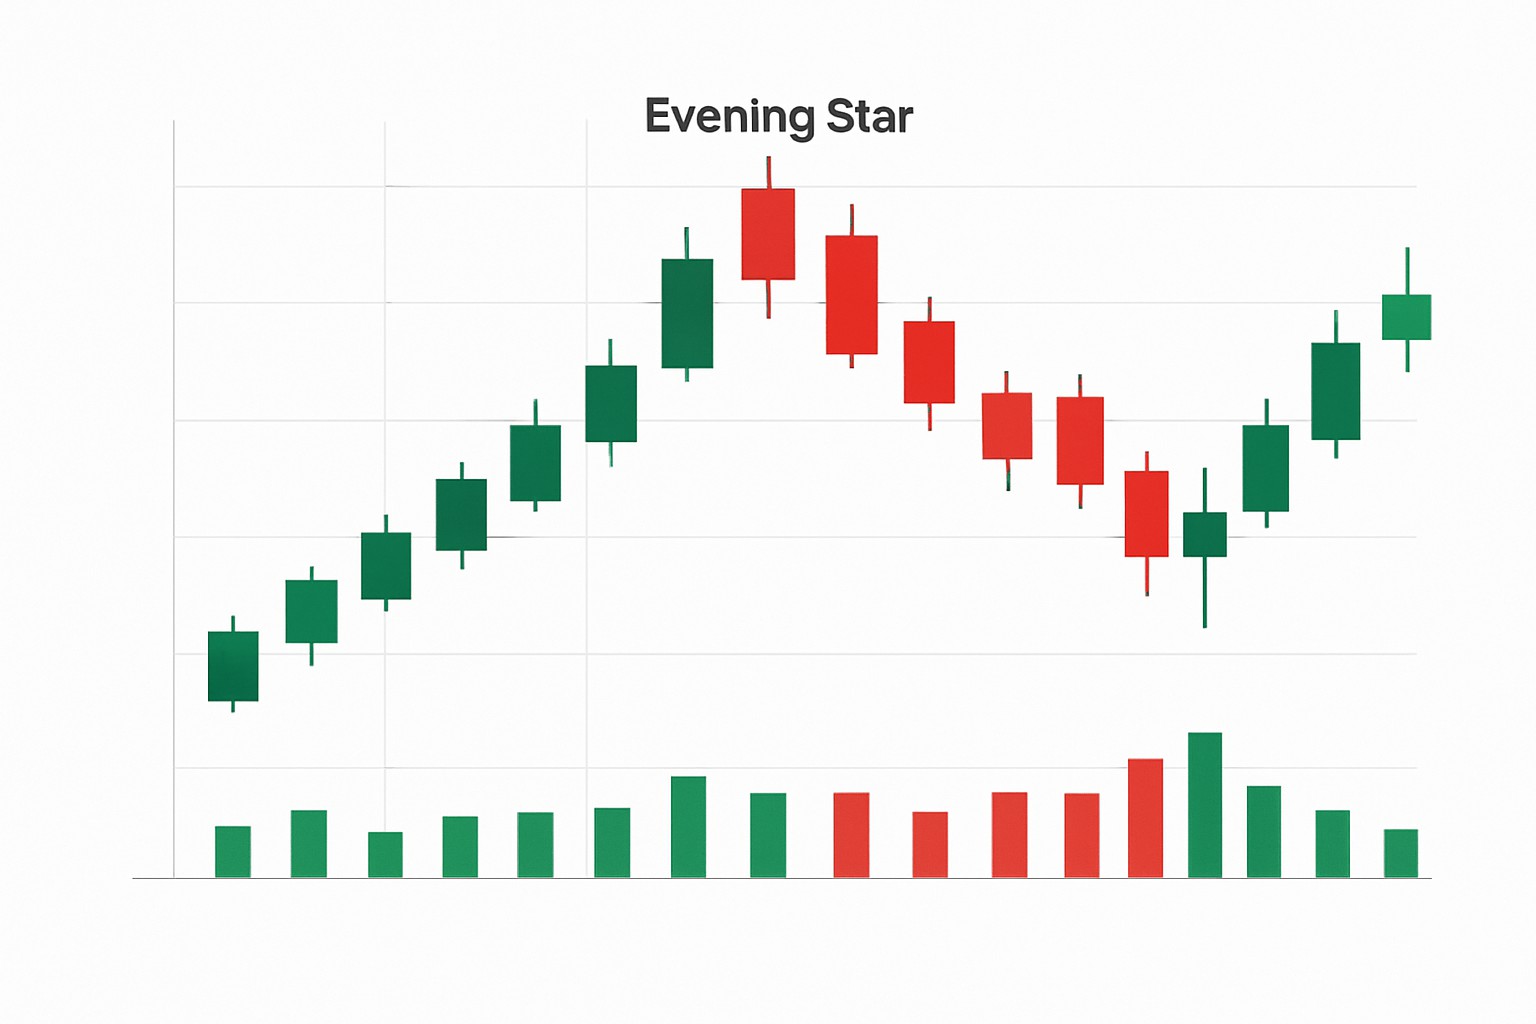
The evening star pattern is a trio of candles that typically appears at the top of an uptrend. It starts with a tall bullish candle followed by a small-bodied candle called the star that gaps above the first one, making a subtle statement. Then a long bearish candle swoops in and closes well inside the body of the first candle.
Visual representation of the evening star pattern with three candlesticks on an uptrend chart.
Make sure there is an existing uptrend where prices have been gradually climbing without too many hiccups.
Spot the first candle—a long bullish (green/white) candle that shows buyers are still calling the shots.
Keep an eye out for the second candle. It usually has a small body and gaps up above the close of the first candle, hinting at a bit of hesitation or slight uncertainty.
Find the third candle—a long bearish (red/black) candle that closes well into or below the midpoint of the first candle’s body. This clearly shows the sellers aren’t messing around.
Look for extra confirmation like a surge in trading volume on the third candle or technical indicators such as RSI or MACD giving a nudge toward a momentum shift.
Spot an evening star pattern the right way by making sure there is a clear uptrend because this pattern typically hints at a reversal at market highs. The opening candle is strongly bullish and signals the uptrend is still holding strong. Then comes the second candle which has a small body and could be bullish, bearish or neutral. It often gaps up and signals a hint of buyer hesitation that is hard to miss if you know what to look for. Wrapping it up, the final candle turns bearish and ideally closes below the midpoint of that first candle. This pretty much confirms a shift toward selling pressure. Do not confuse this with the morning star pattern which tends to pop up during downtrends.
A well-known twist on the evening star pattern is the evening doji star, where the middle candle takes the form of a doji—kind of like the market throwing up its hands in a moment of real indecision. These subtle variations often nudge the strength of the reversal signal one way or the other.
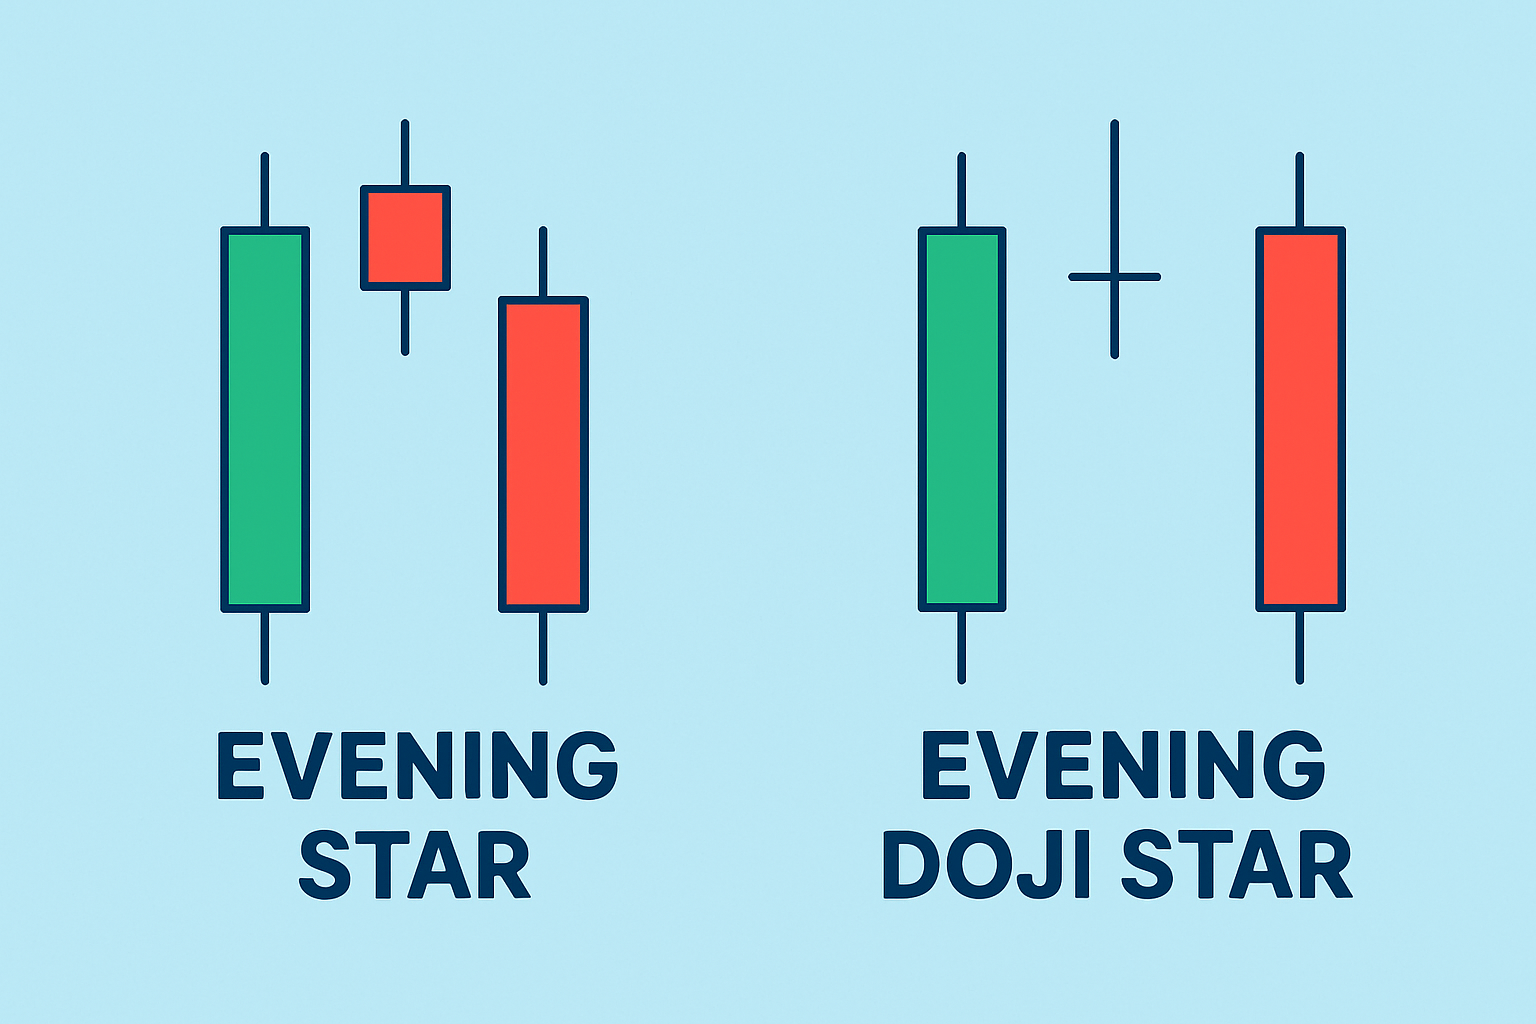
Side-by-side comparison of the evening star and evening doji star patterns.
Give the evening star pattern a shot in your trading routine by keeping an eye out for it on timeframes like daily or 4-hour charts—these often strike a nice balance between being reliable enough and timely enough to act on. It’s always wise to double-check with other technical indicators and make sure you set solid stop-loss orders to keep your risk from spinning out of control.
Relying solely on the evening star without double-checking other indicators can occasionally lead you down the garden path, especially in those unpredictable or sideways markets.
Take a stroll through a real daily stock chart that features an evening star following a steady uptrend. It kicks off with a solid white candle that confidently pushes prices higher. Then, we see a small-bodied candle that cheekily gaps up above the first one. Wrapping things up is a hefty red candle that closes deep into the body of that initial candle.
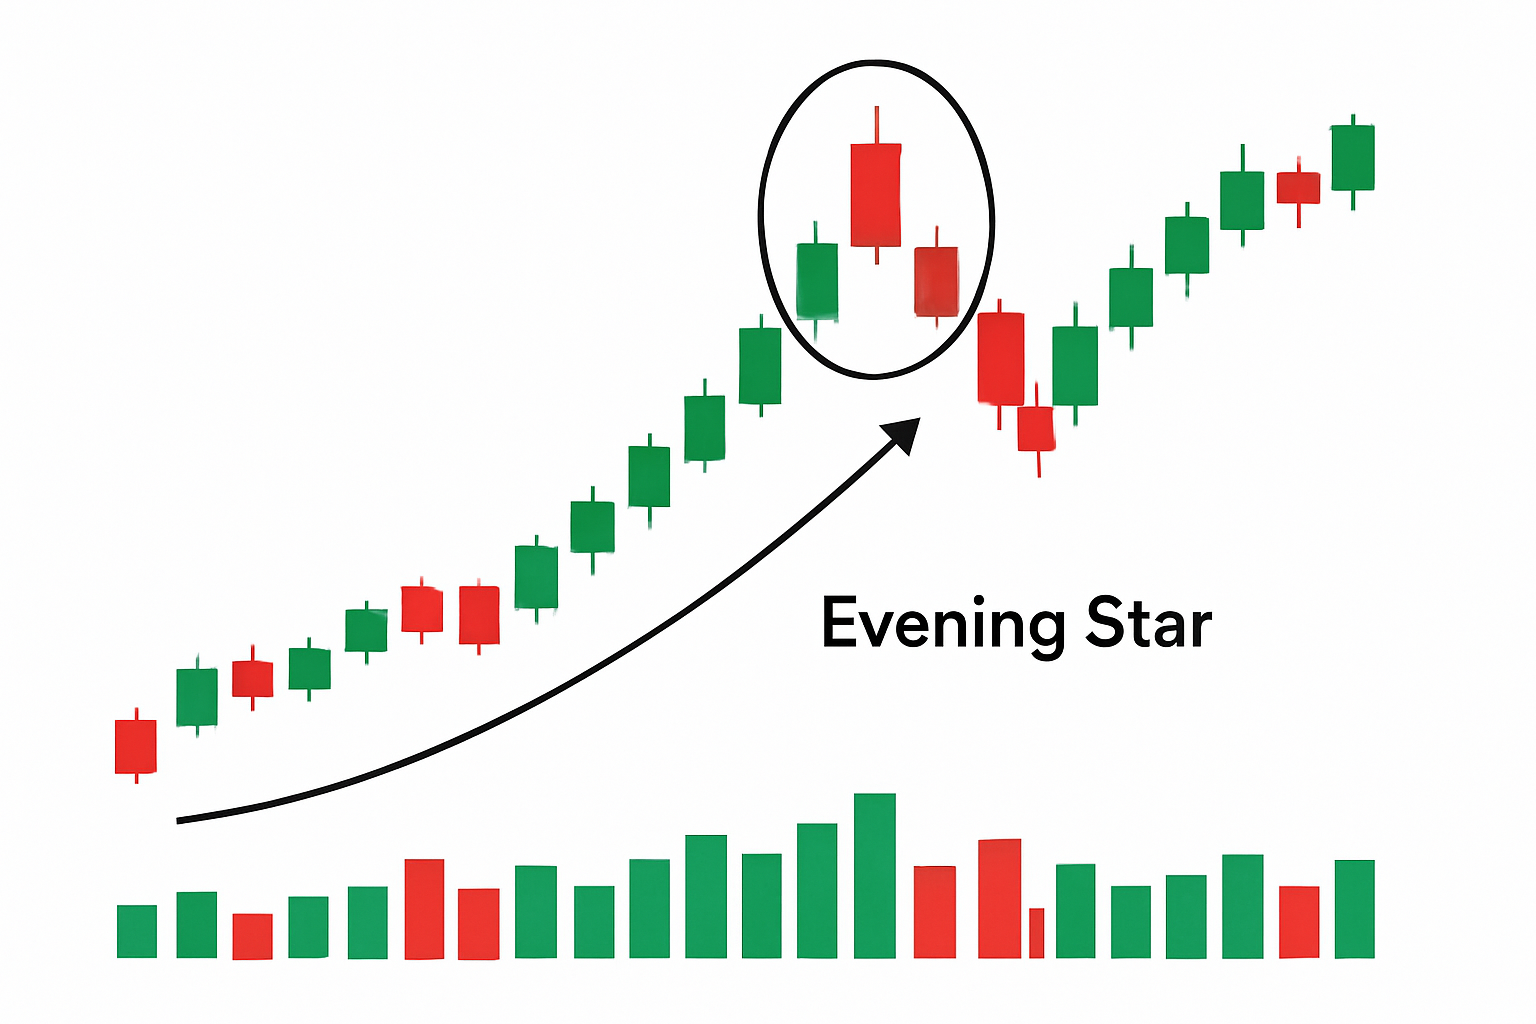
Daily stock chart with an annotated evening star pattern showing candle sequence and volume confirmation.
After the evening star pattern made its appearance, the stock took a sharp turn and prices tumbled over the following sessions.

Tired of missing opportunities and making suboptimal trading decisions? TrendSpider's cutting-edge platform automates complex technical analysis, saving you time and reducing human error.
With multi-timeframe analysis, dynamic alerts, backtesting, and customizable charting, you'll gain a competitive edge in identifying trends and making informed trades across global markets.

17 posts written
Unlock the power of the bear flag pattern with our practical, step-by-step guide. Understand market...

Unlock the power of candle patterns to decode market psychology and improve your trading precision....

Discover the doji candlestick—a powerful price action signal revealing market indecision. This begin...

Unlock the power of the head and shoulders pattern with this complete guide. Learn to spot, trade, a...