


Technical Analysis
How to Spot a Hammer Candlestick in Trading Charts
Master the hammer candlestick pattern—a key indicator for market reversals. This beginner-friendly g...

Reversal candle patterns are a trader’s secret weapon when it comes to spotting those key moments when the market decides to change direction. If you can catch these patterns early, it often gives you a leg up on timing your entries and exits just right—helping to fatten your profits while keeping those pesky risks in check.
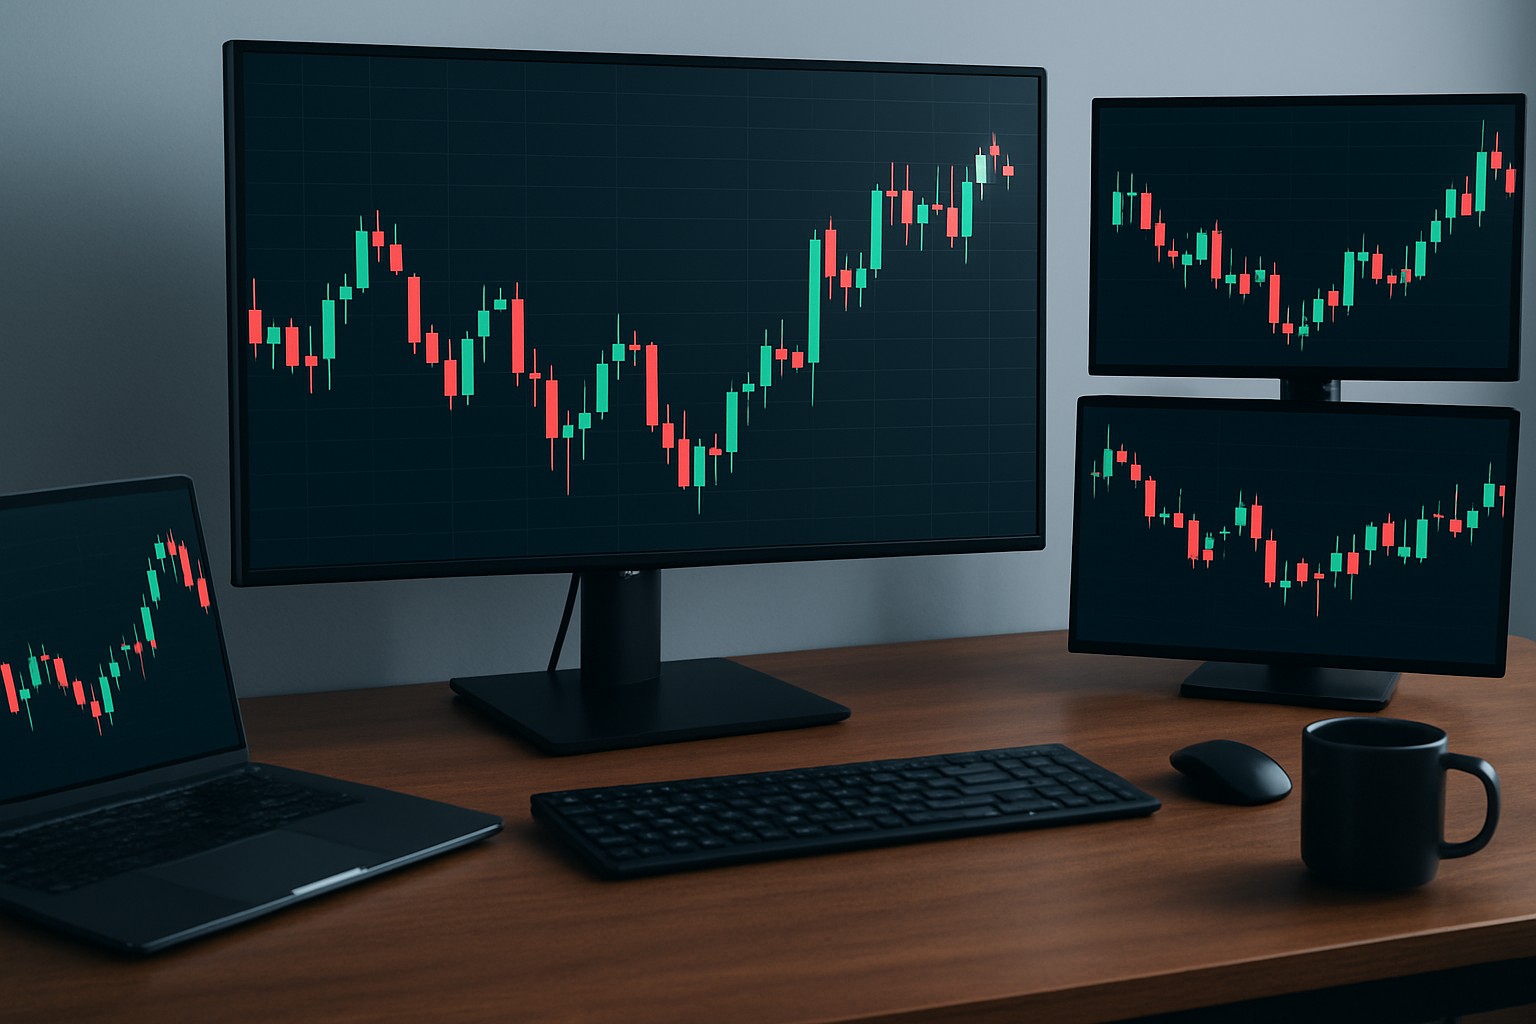
Candlestick charts are a handy way to track how prices move during specific timeframes. Each candle tells a story with four key data points: the open, high, low and close. The candle's body shows the price swing between opening and closing. The thin wicks, sometimes called shadows, highlight the highest and lowest prices during that period. Understanding a candle’s anatomy is like having a secret decoder ring for the market’s mood.
Reversal candle patterns are little signals showing the market's momentum is about to turn. They hint the current trend is losing steam and a fresh one could be on the horizon. Unlike continuation patterns that say "Hold on, this ride’s not over yet," reversal patterns give traders a sneak peek at a possible change in direction.
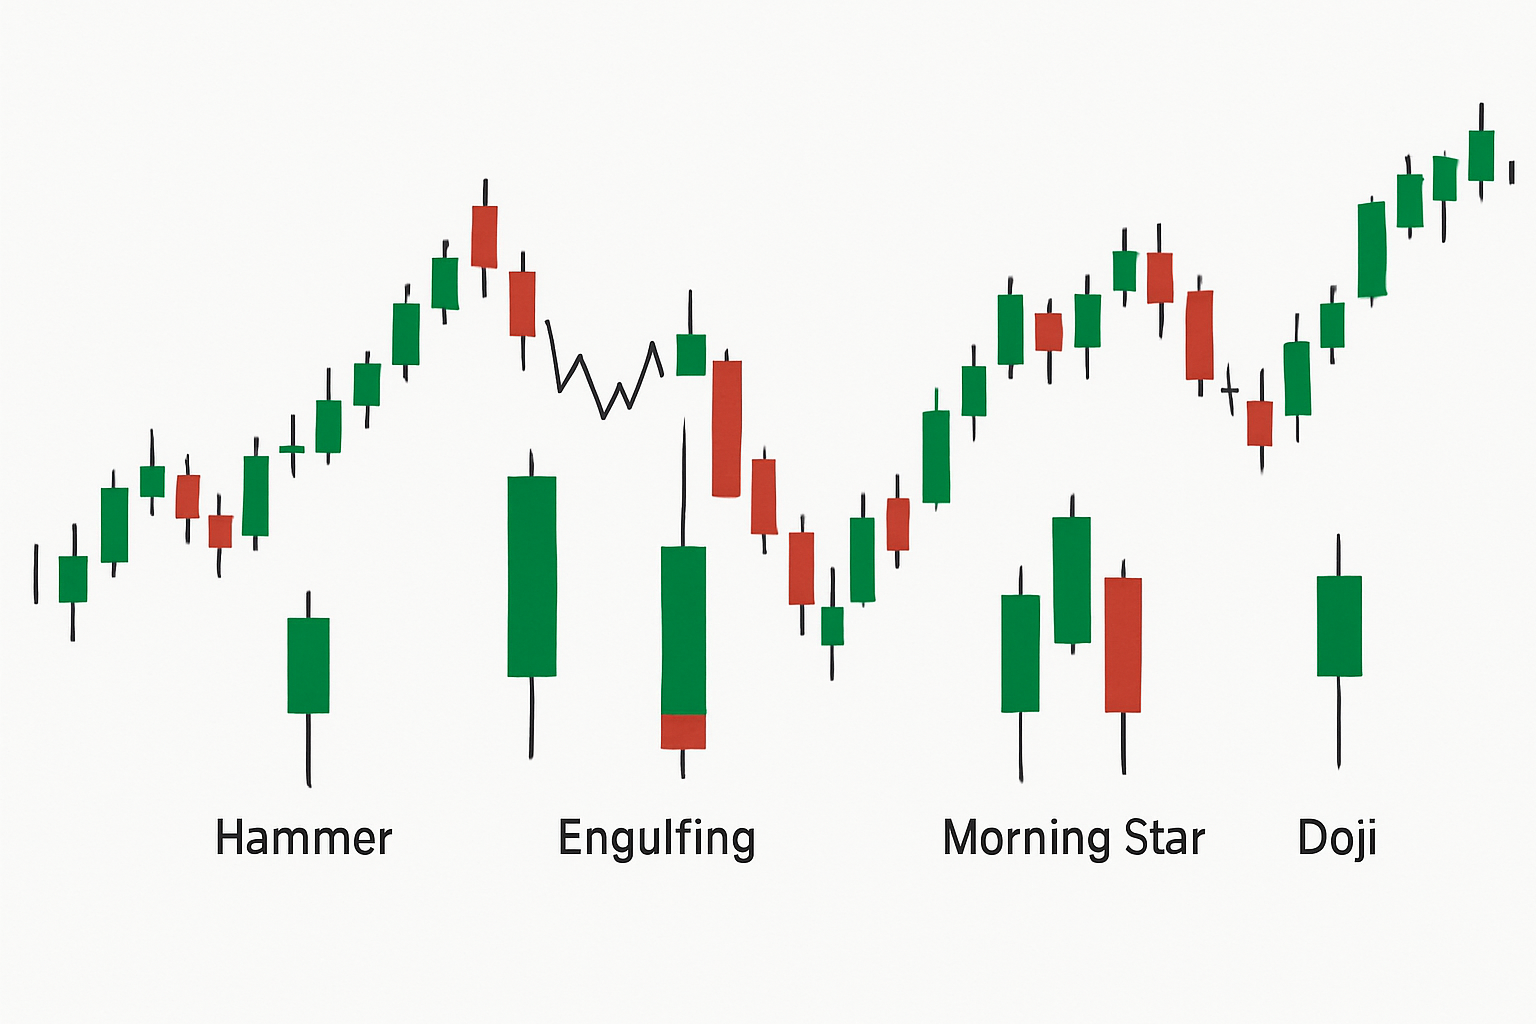
Visual examples of key reversal candle patterns with labels highlighting pattern characteristics
Spotting a real reversal candlestick pattern can feel a bit like finding a needle in a haystack, but once you know what to look for, it’s a whole lot easier. These patterns don’t just pop up randomly; they often come with subtle hints that savvy traders have learned to catch. So, if you’re aiming to separate the genuine signals from the noise, buckle up and let’s dive into some down-to-earth tips that might just save you from a costly misread.
To get a good feel for whether a reversal candle pattern is the real deal, start by sizing it up against the candles that came before it and see where it lands within the current trend. It’s also worth keeping an eye out for spikes in trading volume that lend some weight to the pattern.
Start by sizing up the direction and strength of the prior trend to get a solid feel for the bigger picture. It’s like getting your bearings before setting off.
Take a close look at the candle’s shape, size and shadows to catch classic hints that a reversal might be brewing.
Keep an eye out for a jump in trading volume because it often adds muscle to confirm the momentum is shifting.
Double-check that the pattern shows up near key support or resistance levels since this can boost how much you trust the signal.
Don’t be shy about leaning on other indicators like RSI or moving averages because they’re your backup crew to help confirm the reversal signal.
Try not to jump headfirst into trades just because you spot a single reversal candle, especially without stepping back to see the bigger picture. I have found that skipping over volume or trends on the higher timeframes usually leads to a wild goose chase of false signals.
Trading based on reversal candle patterns usually means first double-checking the signals to be sure, then carefully setting clear entry and exit points.
Keep an eye out for a clear reversal candle popping up near a major support or resistance level—this is often where the magic starts.
Double-check the pattern with reliable trusty tools like the RSI to see if things are overbought or oversold, or by glancing at moving averages for added confidence.
Pick your entry point just past the candle’s high or low, depending on which way you’re leaning—like stepping right over the threshold.
Don’t forget to set a stop loss to keep your risk in check, usually placed just beyond the opposite wick of that reversal candle—think of it as your safety net.
Set realistic profit targets based on the recent price swings and keep a close watch on your trade—sometimes a little nudge here or there makes all the difference.
If you catch a bullish Hammer hanging out at a support zone, consider placing your entry just a bit above its high. It’s usually wise to tuck your stop loss just below that long wick—think of it as a safety net against any sneaky downside surprises. Then, set your sights on a take-profit spot near the next resistance level.
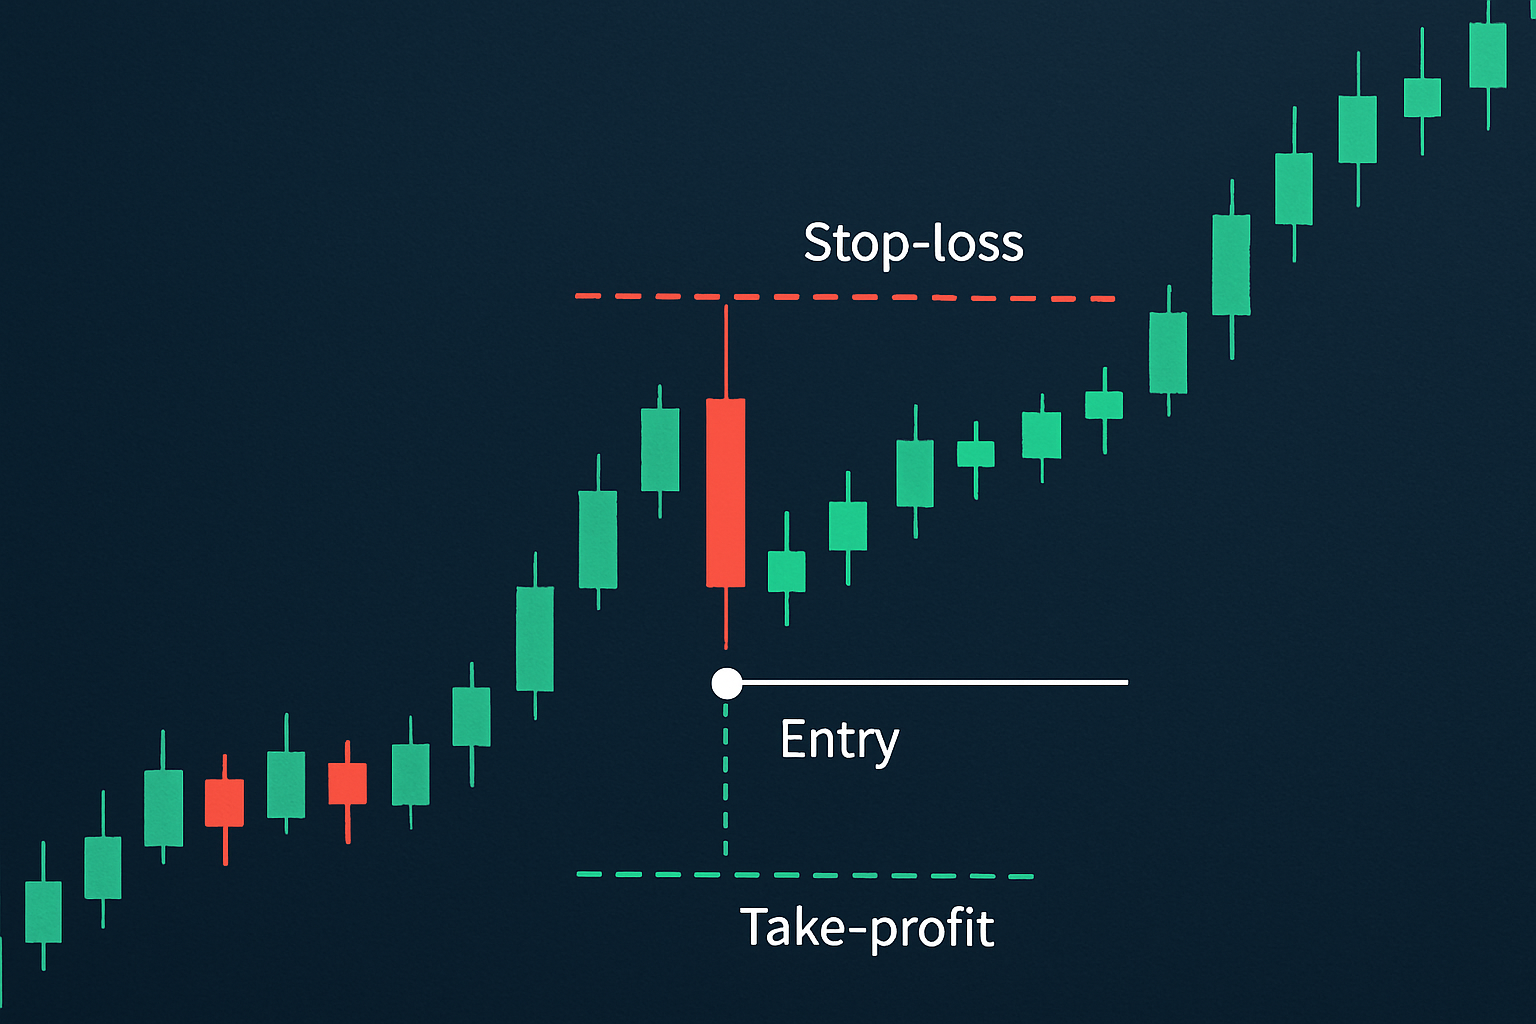
Annotated chart illustrating a real trade setup using reversal candle patterns including entry, stop loss, and profit target
Reversal candle patterns are popular and tend to hold up well whether you’re dabbling in forex, stocks, cryptocurrencies or commodities.
When tailoring reversal pattern strategies it’s smart to pick timeframes that match your trading style. Day traders usually focus on quick intraday candles while swing traders swear by daily or weekly charts to see the bigger picture. Don’t underestimate the power of choosing your order types wisely. Using limit orders near key reversal points can give you an edge in controlling your pricing—like setting a soft landing instead of a free fall. Platforms like Binance open a world of cryptocurrency markets and TradingView brings flexible charting tools for all sorts of assets.
A key challenge traders often run into with reversal candle patterns is getting tripped up by false signals that masquerade as real reversals. This can easily lead to jumping the gun and ending up on the losing side. Trading too much off every frequent pattern tends to chip away at both your capital and confidence
"Patience and discipline are really the bedrock of successful trading. When it comes to reading reversal candle patterns, it’s more about biding your time and waiting for the perfect moment rather than rushing in on every single signal that pops up."

Struggling to improve your trading performance? Edgewonk's advanced analytics tools are designed to give you the edge you need.
With detailed trade journaling, robust strategy analysis, and psychological insights, you'll gain a comprehensive understanding of your strengths and weaknesses. Don't miss out on this game-changing opportunity.

14 posts written
Master the hammer candlestick pattern—a key indicator for market reversals. This beginner-friendly g...

Unlock the power of candle patterns to decode market psychology and improve your trading precision....

Unlock the power of the bear flag pattern with our practical, step-by-step guide. Understand market...

Discover what IOUs mean in finance, their role as informal debt acknowledgments, and how understandi...