


Technical Analysis
What is a Harami Pattern? Breaking It Down
Learn how the harami candlestick pattern signals potential market reversals. This guide breaks down...

This article breaks down how to trade the bearish flag pattern. It walks you through everything from recognizing it to pulling the trigger on trades and managing your risk like a pro.
The bearish flag pattern is a classic chart setup that traders watch when they suspect a downtrend isn’t done yet. It signals that after a brief breather or sideways shuffle the asset’s price will likely resume its downward slide. This pattern stands out because it follows a steep drop and then settles into relatively flat or slightly upward movement—like the market catching its breath before pushing on. This pause helps traders spot and profit from the next leg down.
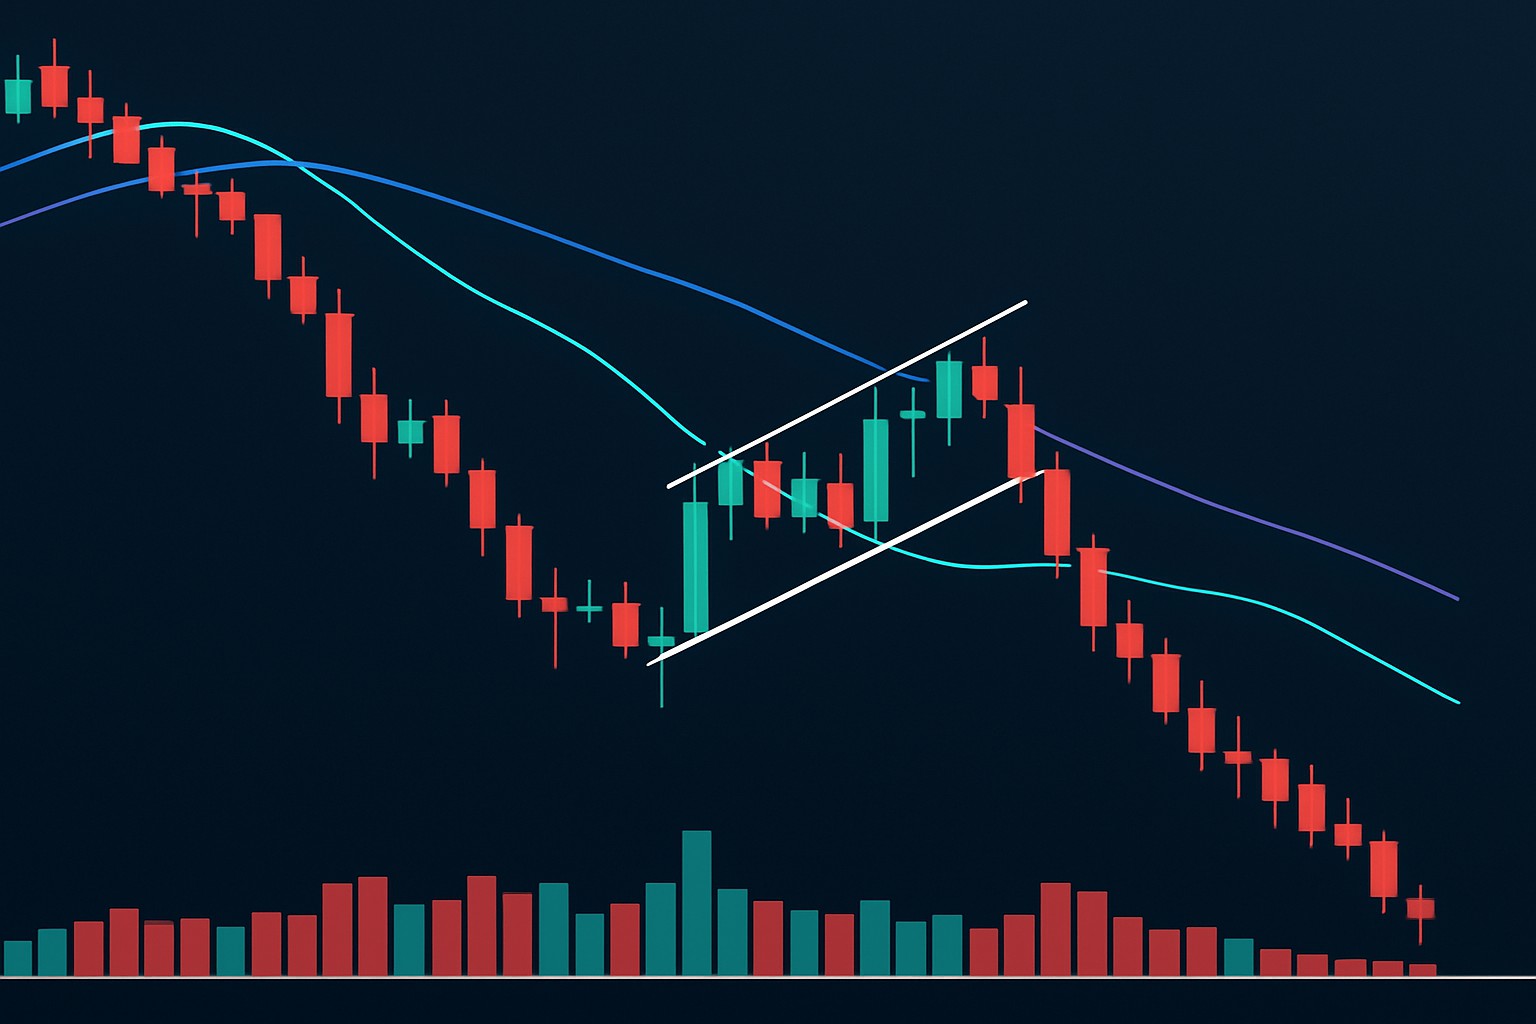
The bearish flag pattern comes with two key players: the flagpole and the flag itself. The flagpole forms when the price takes a sharp nosedive—almost straight down—showing that sellers have really thrown in the towel. Following this swift drop, the flag stage rolls in like a short breather—a sideways shuffle or a slight upward drift confined within a parallel channel or a small rectangle. This little pause usually means the momentum is just catching its breath, not calling an end to the party. The pattern wraps up when the price slips below the flag's lower boundary, waving a strong hint that the downtrend is gearing up to continue.
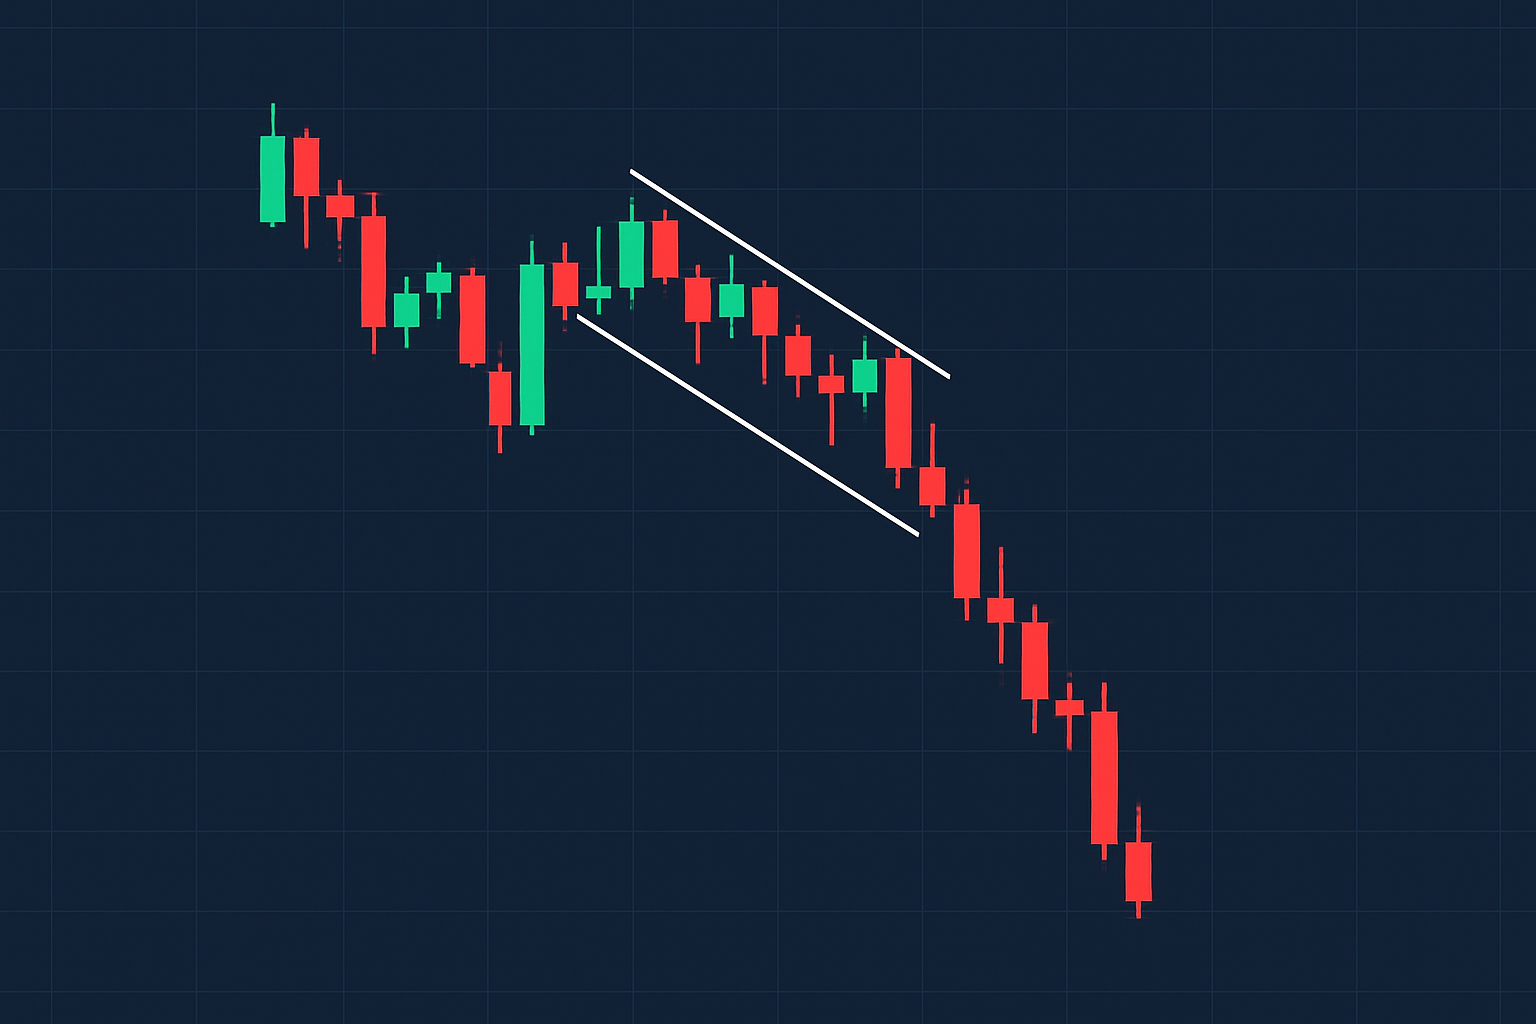
Illustration of the bearish flag pattern on a stock chart, highlighting the flagpole and the consolidation phase forming the flag
Spot a sharp and sudden drop in price that forms a clear flagpole with no room for doubt.
Look for a consolidation phase after the drop where the price moves within a tight, slightly upward-sloping channel or a neat little rectangle.
Ensure the flag’s consolidation happens on lower volume because this usually indicates a brief pause in the selling pressure.
Watch for a breakout that slips below the consolidation area's lower trendline or support level as this signals something important.
Confirm the downtrend is still active by checking if the volume rises during the breakout, since otherwise it might just be a false alarm.
The bearish flag pattern can be a slippery customer to nail down accurately. Traders often chase false signals, especially when the consolidation period drags on longer than expected or when the breakout lacks the volume muscle to sell the move. Sometimes this pattern gets mistaken for a reversal flag or a bear trap, particularly if the price action feels wobbly during consolidation.
Make absolutely sure there’s a clear and strong downtrend humming along before the flag starts to form. This way, you know the bearish momentum hasn’t packed its bags yet.
Patience is key here as the flag consolidation unfolds. Keep an eye out for a sideways or gently upward price channel that’s taking shape.
Take a moment to check the volume. If it dips during this consolidation phase, that’s usually your green light confirming the pattern’s legitimacy.
Get ready to jump in when the price decisively breaks below the flag’s support line, especially if you see a nice uptick in volume backing it up.
Don’t forget to place a stop-loss just above the flag’s recent highs. This little safety net can save you from nasty false breakouts.
Set your profit target by measuring the length of the flagpole and projecting it straight down from the point where the breakout happens.
Stay on your toes by actively managing the trade. Adjust stop-loss levels as needed and consider taking some profits off the table when the price starts moving in your favor.
Each step zeroes in on careful precision, mixing technical signals like volume with no-nonsense risk management tricks to sharpen trade outcomes.
When you combine these tools with the bearish flag pattern it usually makes the whole setup more dependable—cutting through the noise and confirming the trend's muscle while giving you a sharper sense of when to jump in.
Trading the bearish flag pattern comes with its fair share of risks, including those sudden reversals or breakouts that just don’t pan out the way you’d hoped. Managing risk smartly—by keeping position sizes in check and setting stop-loss orders—is absolutely vital to protecting your hard-earned capital.
Work out a risk-to-reward ratio that really adds up before you jump into a trade so you’re not chasing profits that aren’t worth the gamble.
Set stop-loss orders just above the flag’s consolidation area. Think of it as a safety net to catch you if the pattern decides to throw you a curveball.
Keep your position sizes small enough to comfortably fit within your portfolio’s risk limits because nobody likes waking up to bad surprises.
Move your stop-loss levels up as the price moves in your favor to lock in those hard-earned gains. It’s better to be safe than sorry.
Try to steer clear of overtrading or hopping on every pattern without clear confirmation since patience often pays off more than impulsiveness.
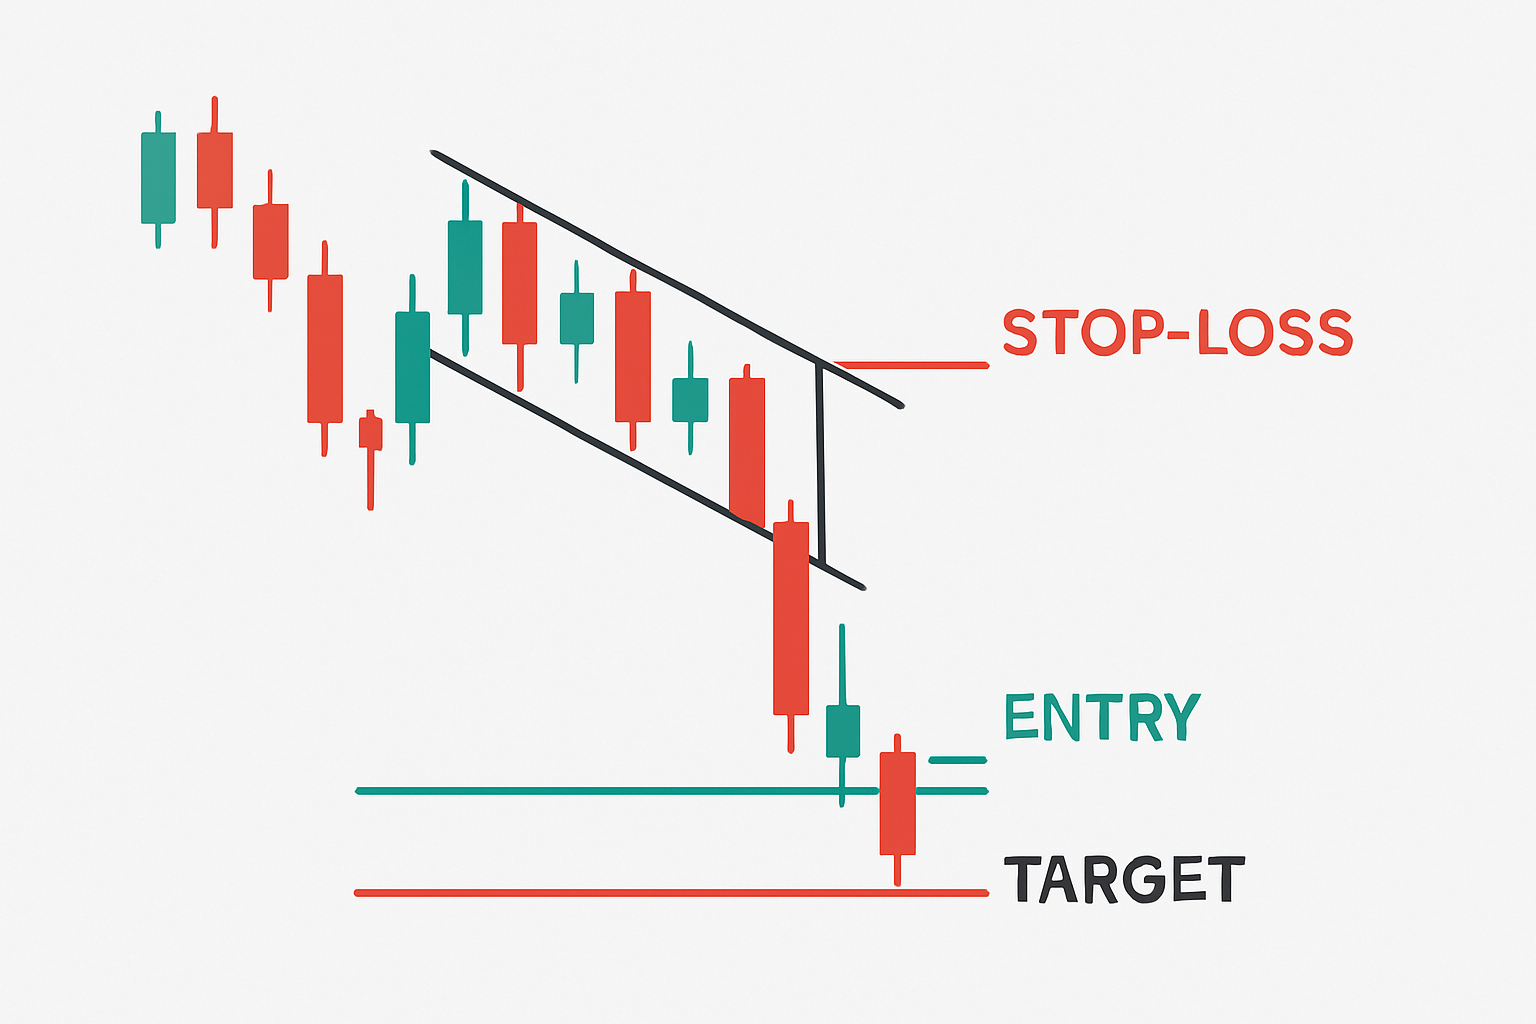
Chart example showing where to place entry, stop-loss, and profit target when trading a bearish flag pattern
Success with bearish flag pattern trades often depends on discipline and properly confirming the pattern. For example, a trader who enters a position without carefully considering volume may be stopped out prematurely. In contrast, a trader who monitors volume closely and uses their stop-loss effectively can secure substantial gains.

Struggling to improve your trading performance? Edgewonk's advanced analytics tools are designed to give you the edge you need.
With detailed trade journaling, robust strategy analysis, and psychological insights, you'll gain a comprehensive understanding of your strengths and weaknesses. Don't miss out on this game-changing opportunity.

19 posts written
Learn how the harami candlestick pattern signals potential market reversals. This guide breaks down...

Discover the doji candlestick—a powerful price action signal revealing market indecision. This begin...

Unlock the power of candle patterns to decode market psychology and improve your trading precision....

Discover what IOUs mean in finance, their role as informal debt acknowledgments, and how understandi...