
IOU Meaning in Finance
Discover what IOUs mean in finance, their role as informal debt acknowledgments, and how understandi...
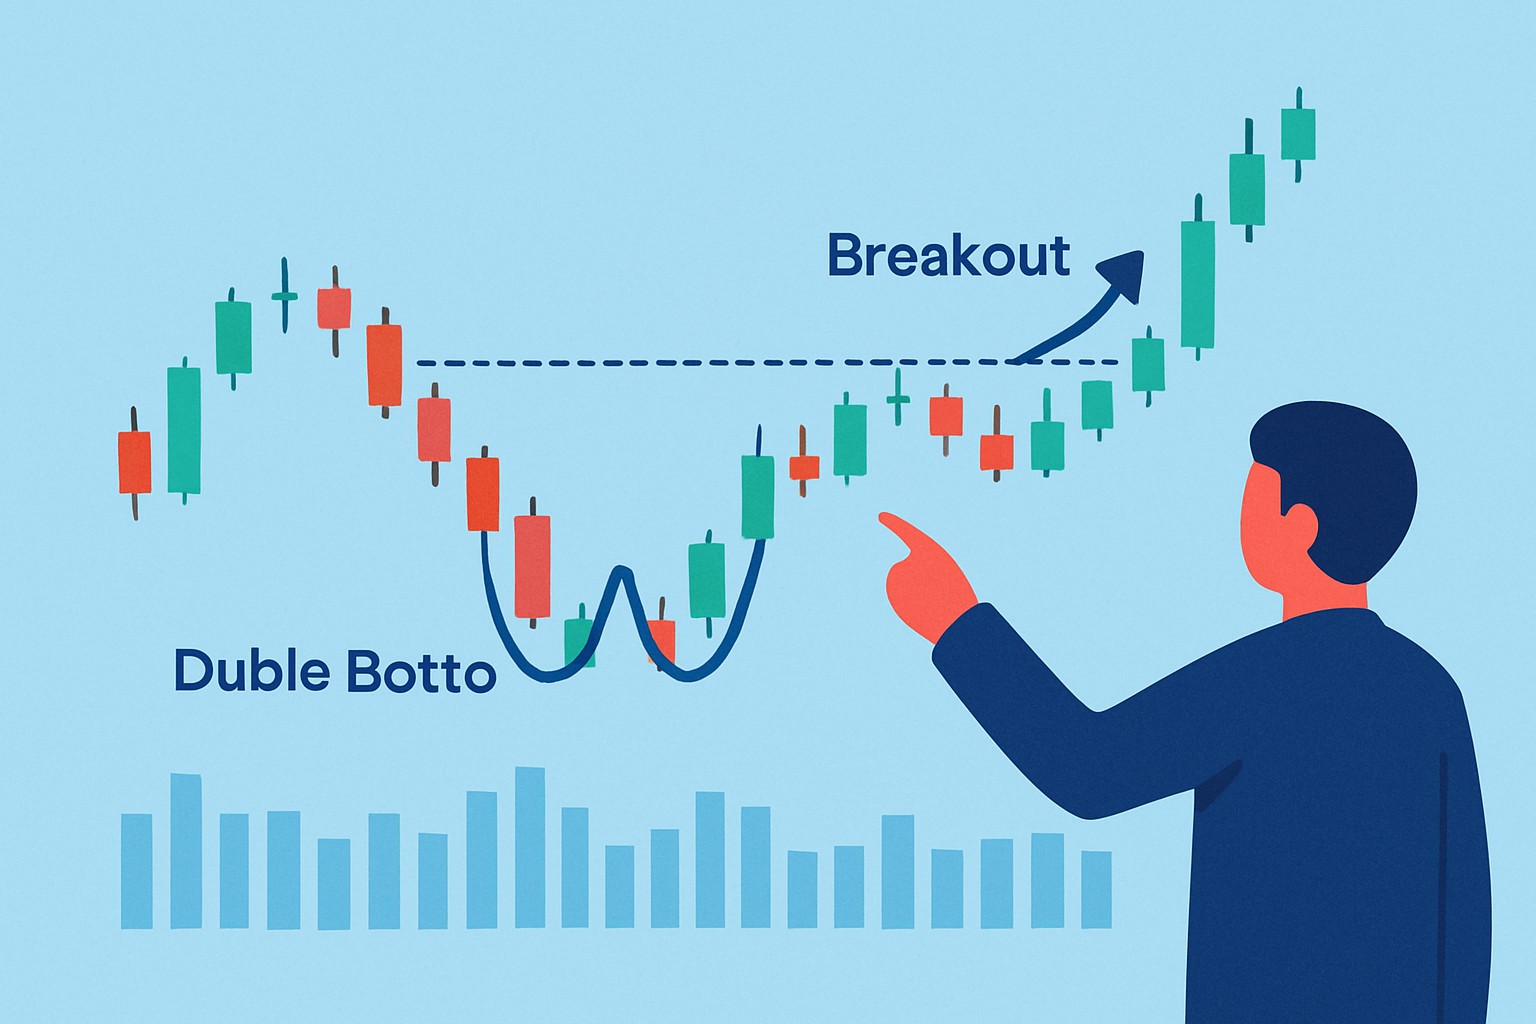
The double bottom pattern is a classic technical analysis formation that often points to a potential turnaround from a downtrend to an upward move. We break down the pattern's structure and the psychology behind it. We also cover practical trading strategies laid out in straightforward terms to help traders of all stripes spot and capitalize on this bullish setup.
The double bottom pattern is a bullish reversal chart that usually pops up after a downtrend and hints at a possible shift toward upward momentum. It sports two consecutive lows around the same price level, with a peak or resistance sandwiched right in the middle.
The key elements include two distinct lows hanging out around the same price level where the asset tends to find some support. Sandwiched between them is a moderate peak playing the role of resistance like a gatekeeper. When the price finally marches above this peak called the neckline it usually signals a potential upward reversal.
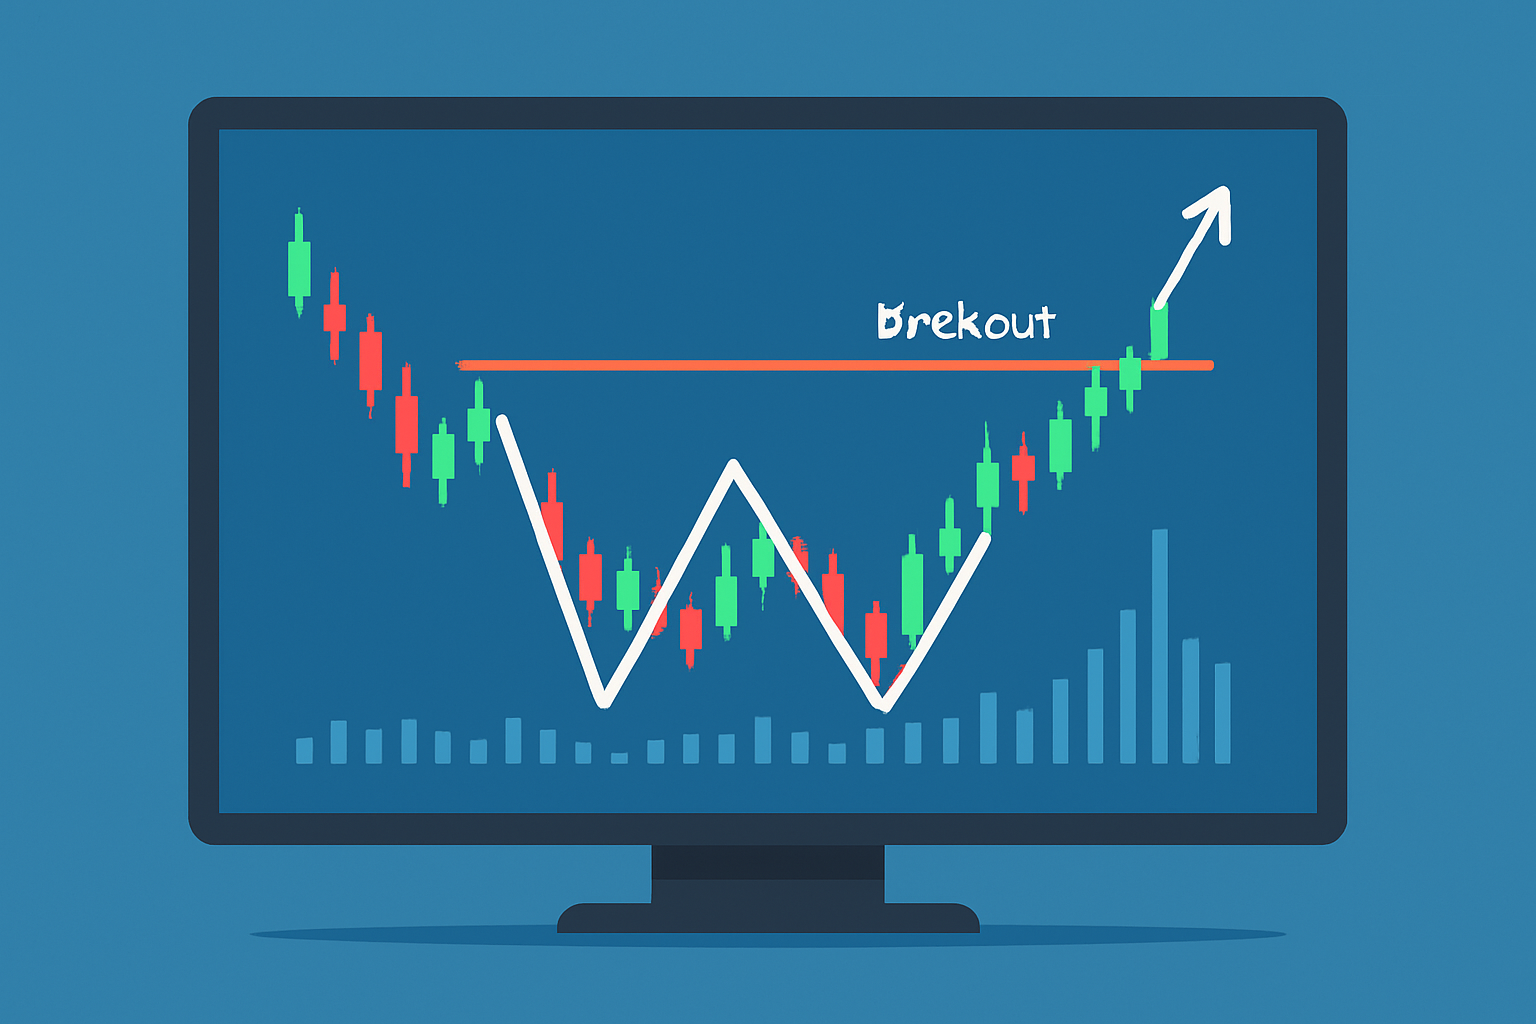
Illustration of the double bottom pattern on a price chart highlighting two lows, neckline, and breakout point.
The double bottom pattern is a neat window into how market participants think. The price dips to a solid support level twice with buyers jumping in to keep it from slipping further. When sellers cannot push the price down on the second try, it is a good sign that selling pressure is losing steam and bullish sentiment is gaining ground. This often sets the stage for a trend reversal.
Not every chart showing two lows screams a reliable double bottom, believe me. Traders usually keep an eye out for certain clues—like a decent gap of days or even weeks between those lows—to really trust that support has been tested. Then there’s that moment when the price breaks above the peak connecting these bottoms.
Common mistakes often creep in when people misread a double bottom, especially if the lows don’t line up neatly or when there’s no volume backing it up. It’s all too easy to mix up a simple bounce or a bit of consolidation with the real deal.
Picture the double bottom like a spring that gets squeezed not once, but twice, before it bounces back up—this second dip is kind of like the market giving a little nod, hinting it is about to climb higher.
Trading the double bottom usually begins by making sure the pattern is legit, then jumping in once the breakout shows it’s the real deal. It’s important to set protective stops and carve out profit targets with a bit of care—after all, you want to avoid nasty surprises along the way.
Keep an eye out for the double bottom pattern on the price chart making sure those lows are twins and nicely spaced over a decent stretch of time.
Look for a solid breakout above the neckline resistance ideally backed up by a noticeable surge in volume because without volume a breakout feels empty.
Jump into a long position right after that breakout candle closes to make sure the move has real legs.
Place a stop-loss just a smidge below the second bottom. That little safety net can save you from nasty surprises.
Nail down your profit target by measuring the gap from those bottoms up to the neckline then projecting that distance upwards. Think of it like stretching a rubber band upward.
Watch your trade like a hawk and consider shifting your stop-loss to break-even or using trailing stops as the price starts to work in your favor because locking in gains early can make a difference.
The 'measured move' technique basically works by sizing up the profit target using the vertical distance between the double bottom lows and the neckline. Then, you take that height and stack it just above the breakout point.
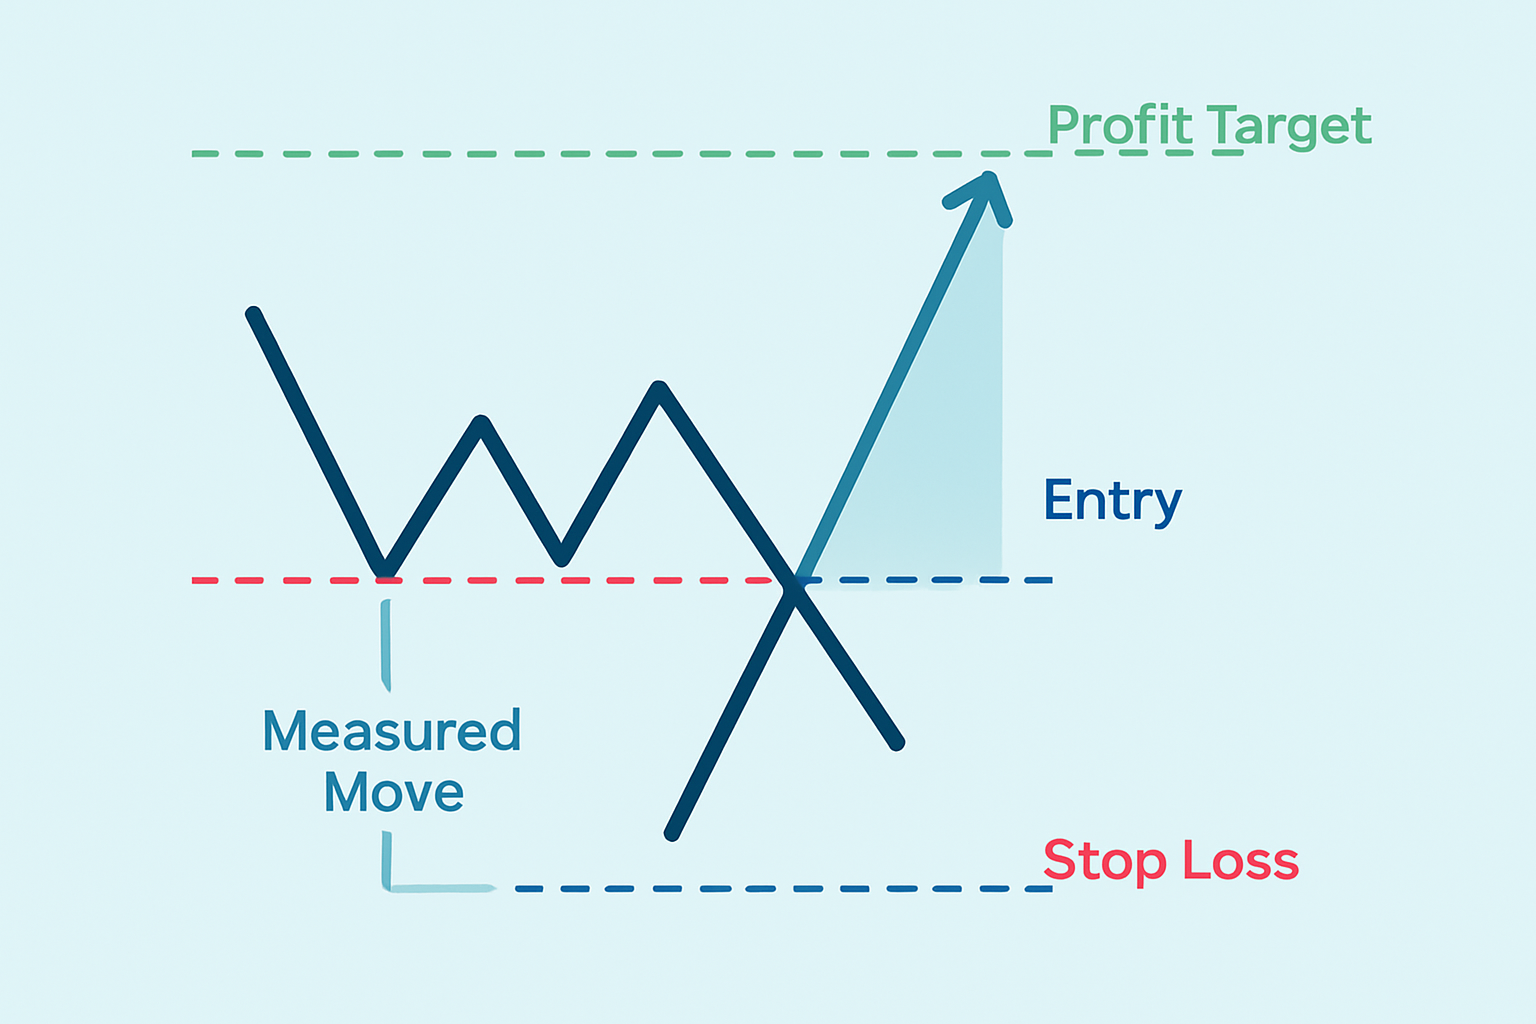
Chart demonstrating how to use the measured move technique to calculate profit targets from the double bottom pattern.
Volume usually takes a dip as the price forms the two bottoms signaling that the selling pressure is easing up. Then it shoots up noticeably once the price breaks above the neckline.
The double bottom pattern can pop up on various time frames like daily, weekly and intraday charts. Daily and weekly charts earn their stripes as more reliable for long-term trading and investing. Meanwhile, intraday charts tend to suit short-term traders eager to snatch quicker reversals. Picking the right time frame really boils down to your personal trading style. Longer periods help filter out market noise but demand patience.
Trading double bottoms effectively calls for patience and discipline. Keep an eye out for confirmations backed by strong volume. Lean on solid risk management and make sure to slot the pattern snugly into your overall trading strategy.
In early 2023 Apple Inc. (AAPL) pulled off a textbook double bottom on its daily chart after a steep drop. The stock found its footing near $140 twice, and volume gave a noticeable bump once it pushed past $150. Traders who jumped on that breakout were rewarded with a solid rally. Around the same period the EUR/USD pair in the forex market wasn’t sitting still either. It formed its own double bottom pattern in late 2023 and gave savvy investors a clear entry point as price busted through resistance near 1.0800. This was backed by strong volume and steady gains.
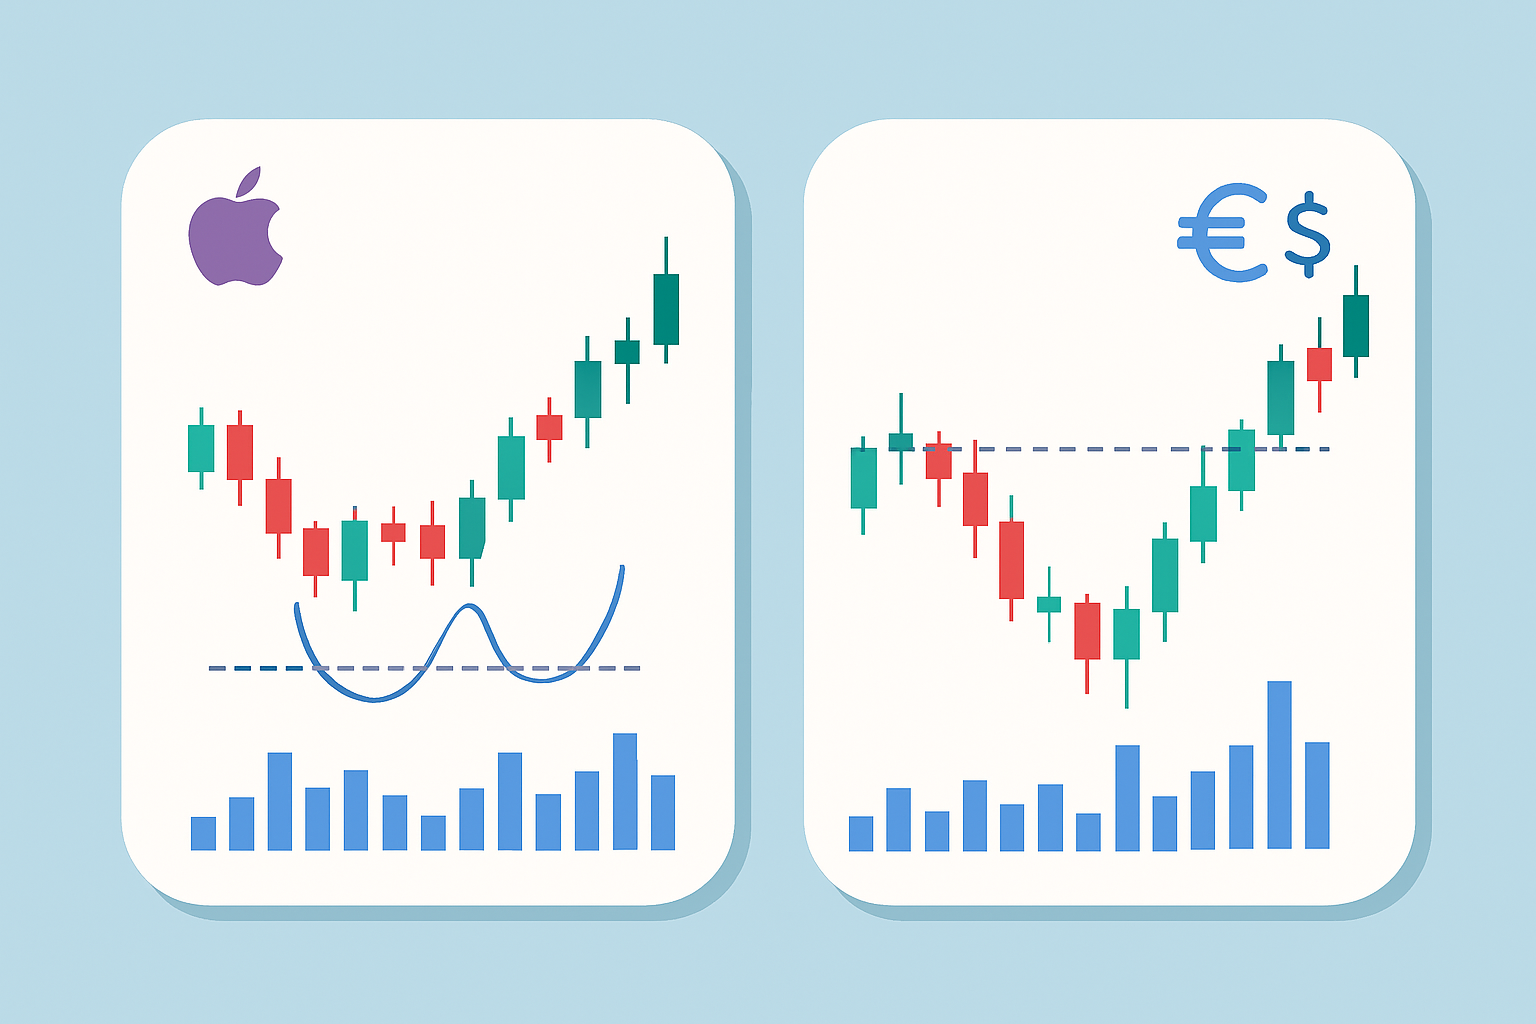
Real-world charts showing double bottom formation and breakout examples on Apple stock and EUR/USD currency pair.
These examples really drive home how vital it is to clearly identify patterns and confirm volume when nailing successful double bottom trades.
Traders often boost the reliability of signals from double bottom patterns by teaming them up with technical indicators like the Relative Strength Index (RSI) or moving averages and support or resistance zones. These trusty tools include another level of confirmation that can help weed out sneaky false breakouts and fine-tune the timing for entries and exits.
Tired of missing opportunities and making suboptimal trading decisions? TrendSpider's cutting-edge platform automates complex technical analysis, saving you time and reducing human error.
With multi-timeframe analysis, dynamic alerts, backtesting, and customizable charting, you'll gain a competitive edge in identifying trends and making informed trades across global markets.
As a trader seeking opportunities in the dynamic crypto market, you need a reliable and secure platform to execute your strategies. Coinbase, the leading cryptocurrency exchange, offers a seamless trading experience tailored to your needs, empowering you to navigate the market with confidence.
20 posts written
Driven by an insatiable curiosity for behavioral economics and its impact on trading psychology, Sophia Dekkers offers groundbreaking insights into harnessing cognitive biases for improved decision-making.
Read Articles
Discover what IOUs mean in finance, their role as informal debt acknowledgments, and how understandi...
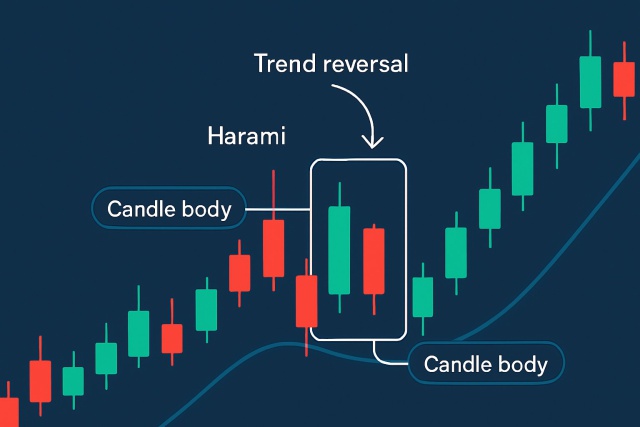
Learn how the harami candlestick pattern signals potential market reversals. This guide breaks down...
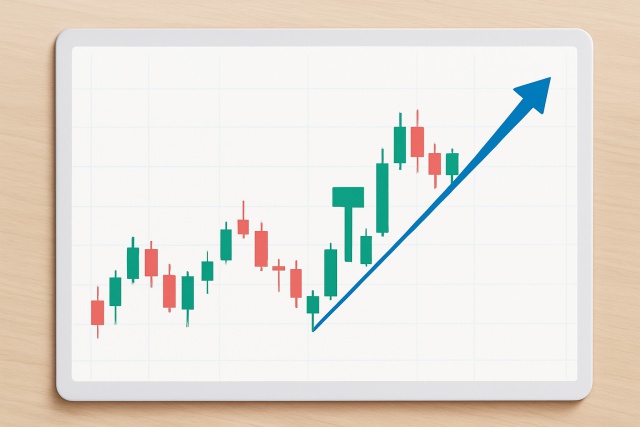
Master the hammer candlestick pattern—a key indicator for market reversals. This beginner-friendly g...
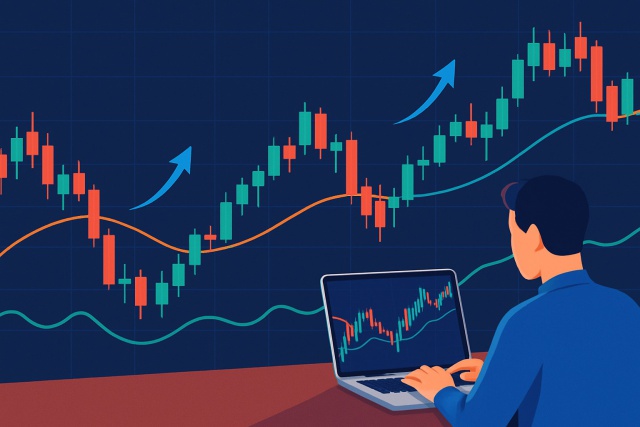
Unlock the power of candle patterns to decode market psychology and improve your trading precision....
