


Technical Analysis
What the Doji Candlestick Means in Price Action
Discover the doji candlestick—a powerful price action signal revealing market indecision. This begin...

The descending triangle is a classic chart pattern in technical analysis that traders rely on to catch potential price dips. It captures a tug-of-war where sellers push prices downhill while buyers hold the line at a key support level. Understanding how this pattern forms and what it means can give you an edge in predicting breakdowns and managing risk with more confidence.
A descending triangle is a classic bearish chart pattern that reveals a string of lower highs and sketches out a descending resistance line paired with a flat or nearly horizontal support line where the price seems to reliably find its footing. This pattern shows sellers gradually becoming more persistent and nudging prices downward while buyers stubbornly hold the line at a key support level.
The descending triangle forms when sellers gradually nudge prices down to lower highs, while buyers stubbornly hold their ground at a steady support level. It creates this tug-of-war vibe where the resistance line slopes downward, and the support line stays nice and flat. Traders watching this pattern usually figure that if sellers keep tightening their grip, the price will eventually break through support signaling either a continuation or a reversal heading toward a bearish trend.
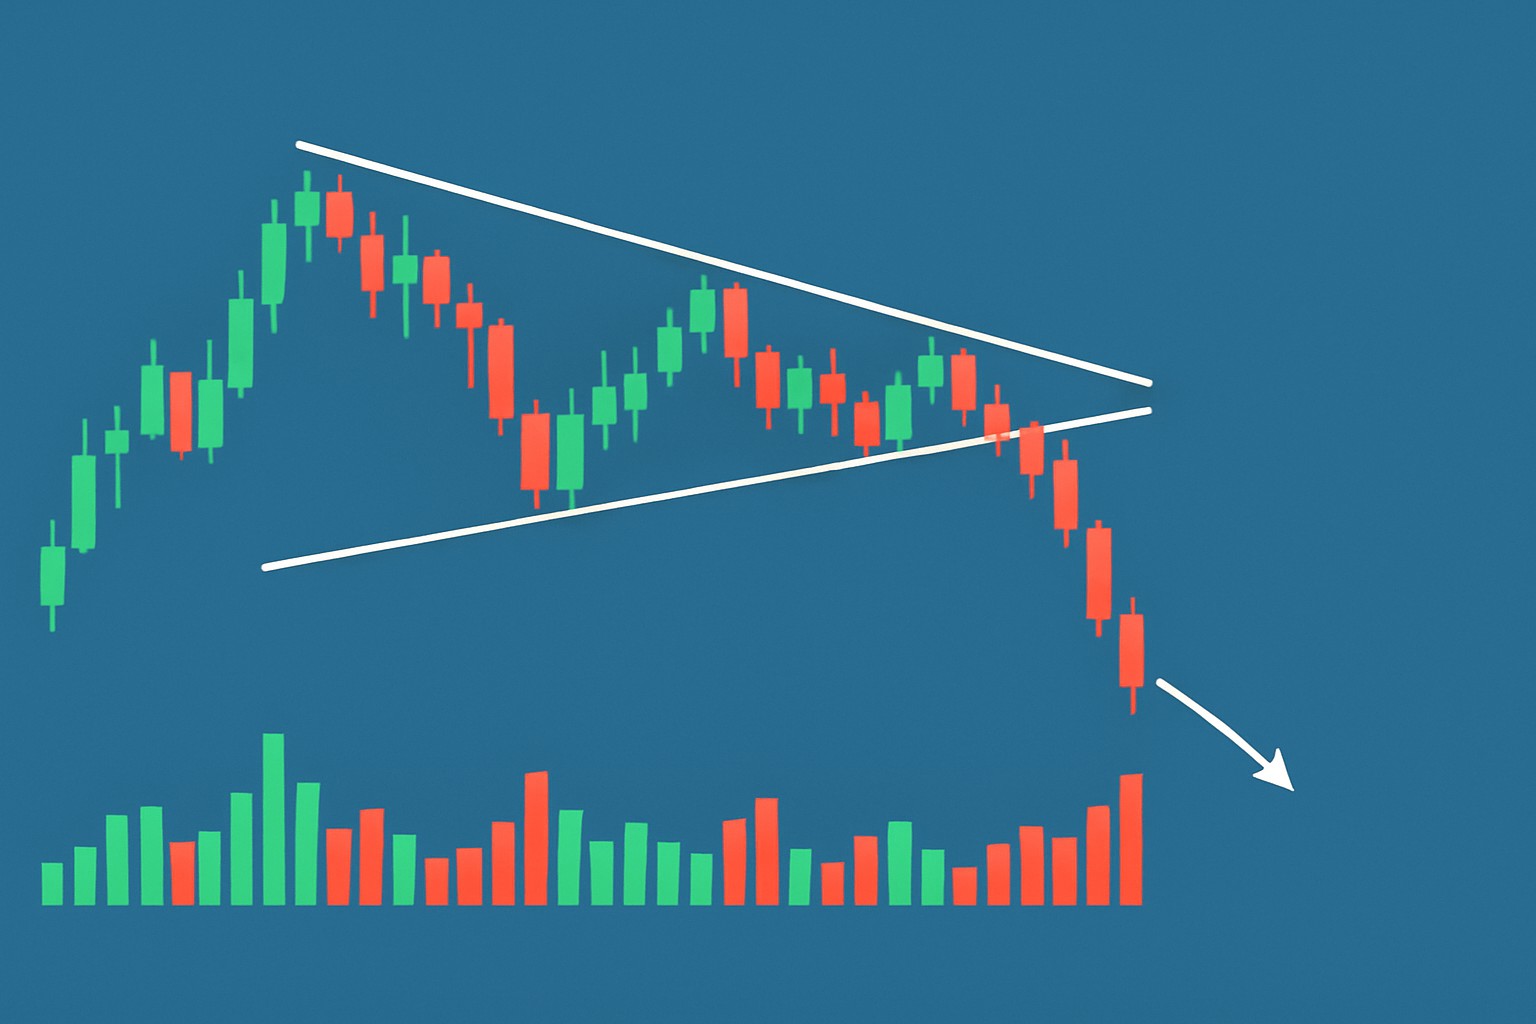
The chart kicks off with a clear downtrend setting the tone for a bearish mood hanging over the market like a gloomy cloud.
The price settles into a rhythm bouncing off the same horizontal support level multiple times.
Sellers keep nudging the price lower and carving out lower highs that form the descending resistance line as if the market is slowly backing away.
That trusty horizontal support line keeps getting tested which tells us there is buying interest lurking even as selling pressure piles up.
Over time volume and selling strength ramp up setting the stage for one of two dramas: either a break below support or a resilient rebound, both of which put the pattern's story in sharp focus.
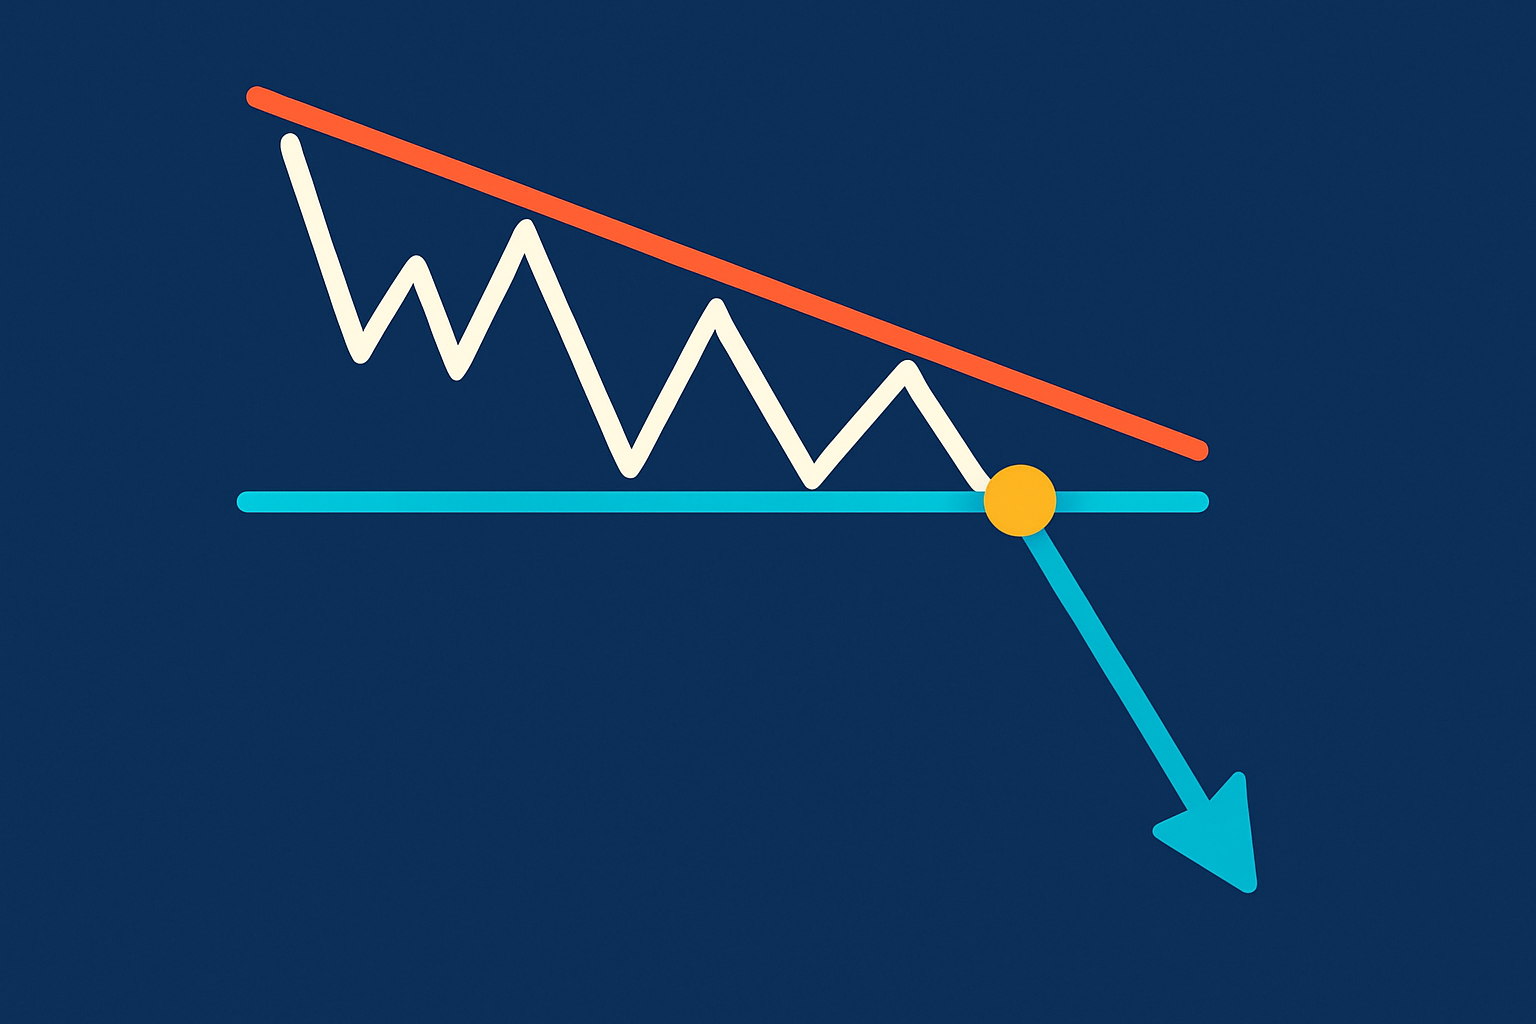
Illustration of a descending triangle pattern featuring lower highs and horizontal support, highlighting key points of price touches and breakout.
Spot a descending triangle by keeping an eye out for the price making lower highs along a downward sloping resistance line, while it keeps testing a flat support level at the bottom like clockwork. Nailing this pattern usually hinges on watching volume trends closely and making sure both trendlines get a few solid touches—no one-hit wonders here.
The descending triangle usually signals a bearish continuation, suggesting that the downtrend is likely to keep chugging along once the price slips below the support line. It’s a clear sign that sellers have the upper hand, with those steadily lower highs hinting at mounting selling pressure. Sometimes it bucks the trend and turns into a reversal pattern or even an upside breakout—especially when the support level holds stronger than anyone might’ve guessed. Historical data tends to back up the pattern’s reliability, especially when you pair it with volume analysis and other indicators.
"Descending triangles often lean towards signaling downward breakouts, but in my experience, it’s smart for traders to keep an eye on the breakout volume to make sure it’s the real deal—after all, false breaks and sudden reversals love to sneak in when you least expect them."
Volume is really the lifeblood when confirming a descending triangle pattern. As the pattern starts to form, you’ll often see volume taper off reflecting less trading hustle while the price takes a breather and consolidates. Then a strong breakout usually shows up with a sudden burst in volume like a neon sign flashing that market sentiment is shifting. On the flip side, breakouts that happen on low volume can be sneaky false alarms and potentially lead to losing trades.
Nailing the descending triangle take takes a keen eye to spot the pattern and a bit of patience to wait for that clear confirmation before diving in. Traders typically jump into short positions once the price decisively breaks below support, carefully placing stop losses to keep risks in check while eyeing profit targets based on the pattern’s expected move.
Keep an eye out for a descending triangle pattern. This usually appears with a series of lower highs along with a steady horizontal support level that won’t budge.
Be patient and wait for a clear, decisive breakout below that support line. It is even better if you see volume picking up to confirm it—it's like the market giving you a little nod.
After the breakout is confirmed, consider entering a short position just below that level to ride the downward momentum while it is still fresh.
Set a stop loss just above the most recent lower high to protect yourself from sneaky false breakouts that often trick traders.
Determine your profit target by measuring the tallest height of the triangle and then projecting that distance downward from the breakout point. This classic approach often helps keep your goals realistic.
Although descending triangles are pretty popular among traders, many find themselves scratching their heads trying to read them right—sometimes with costly consequences. Misreading the pattern or ignoring those subtle volume clues often leads to trades that are way off timing. It’s all too common for individuals to confuse descending triangles with other triangle varieties or to dive in headfirst before a breakout gives a clear green light, cranking up the risk substantially.
Triangle patterns pop up in a few different shapes each carrying its own story and vibe. The descending triangle usually leans bearish with a resistance line that dips downward while the support level holds steady like a stubborn friend. Meanwhile the ascending triangle flips the script by showing a rising support line clashing with a flat resistance. This is often a sign that bullish momentum is gearing up. Then there’s the symmetrical triangle where trendlines squeeze inward and tilt toward each other. This signals a standoff and the chance for a breakout in either direction.
| Pattern Type | Shape Characteristics | Typical Trend Bias | Breakout Direction | Volume Behavior |
|---|---|---|---|---|
| Descending Triangle | Resistance slopes downward, while support tends to hold steady as if clinging on for dear life | Usually keeps heading down | Most of the time breaks downwards | Volume often takes a nap during formation, then suddenly wakes up with a bang at breakout |
| Ascending Triangle | Support slopes upward, with resistance keeping a flatline, like the calm before a storm | Often keeps climbing | Usually breaks upward | Volume tends to ease off while forming, then spikes sharply when the breakout hits |
| Symmetrical Triangle | Trendlines squeeze together with opposing slopes, like a tug of war reaching its climax | Often leaves traders scratching their heads | Can go either way, so beware | Volume tightens up as the pattern forms, then bursts out to life at breakout |
Historical stock charts and cryptocurrency examples often show descending triangles before notable price drops. These cases show how catching the pattern, waiting for breakout confirmation, and making the trade come together in the messy reality of the markets.
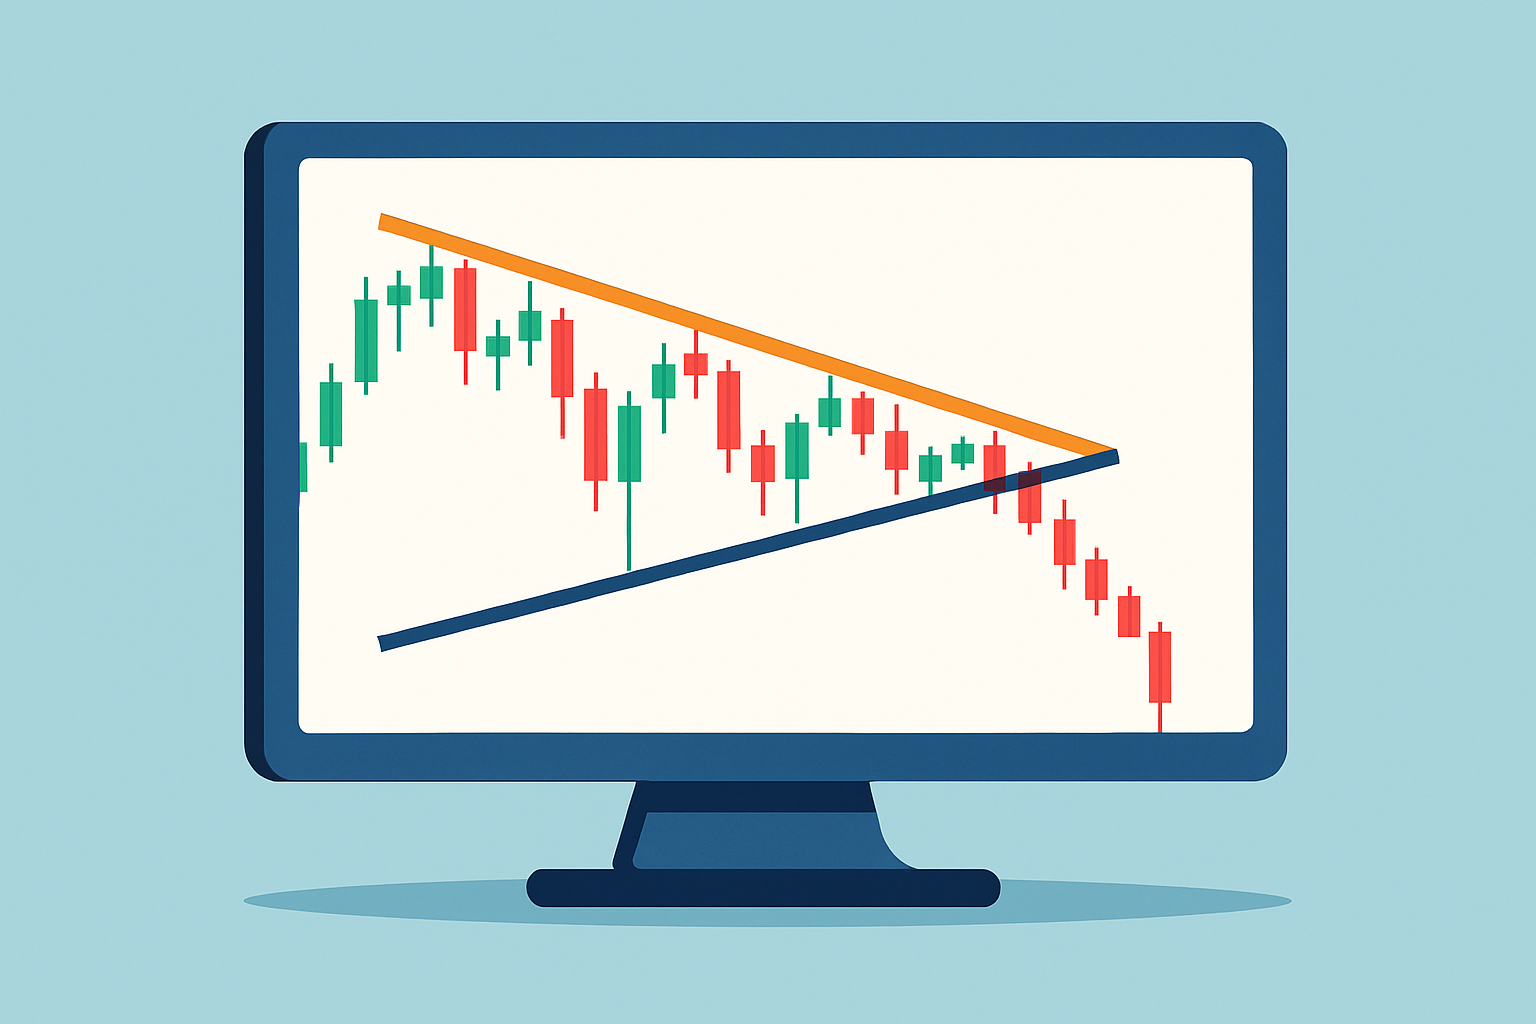
Annotated real-world examples of descending triangles highlighting formation and breakout in stock and cryptocurrency charts.

Tired of missing opportunities and making suboptimal trading decisions? TrendSpider's cutting-edge platform automates complex technical analysis, saving you time and reducing human error.
With multi-timeframe analysis, dynamic alerts, backtesting, and customizable charting, you'll gain a competitive edge in identifying trends and making informed trades across global markets.

17 posts written
Discover the doji candlestick—a powerful price action signal revealing market indecision. This begin...

Unlock the power of candle patterns to decode market psychology and improve your trading precision....

Master the hammer candlestick pattern—a key indicator for market reversals. This beginner-friendly g...

Discover the bullish harami candlestick pattern—a key technical signal that can hint at trend revers...