


Technical Analysis
Master the Bear Flag Setup
Unlock the power of the bear flag pattern with our practical, step-by-step guide. Understand market...

The ascending wedge pattern often steals the spotlight in technical analysis, quietly helping traders and investors catch whispers of potential market reversals.
Chart patterns reveal the subtle tug-of-war between supply and demand, offering traders valuable hints about where prices could be headed next.
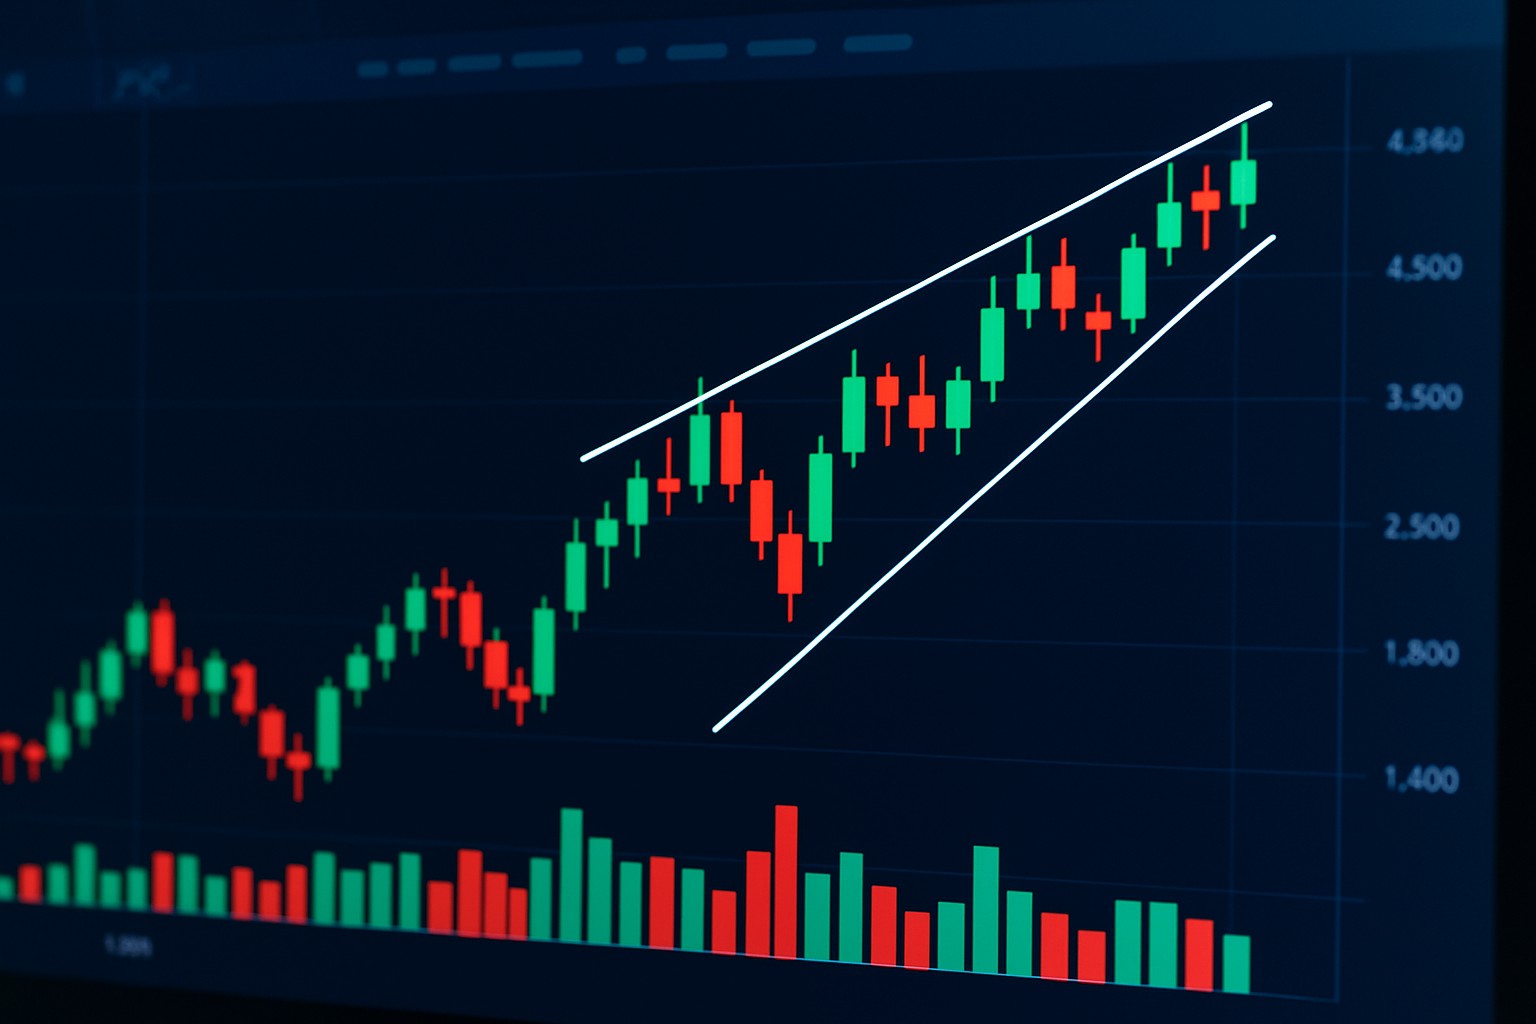
An ascending wedge pattern forms when price movements get squeezed between two upward sloping trendlines that gradually draw closer over time. The upper line hugs higher highs and the lower line latches onto higher lows. Unlike its symmetrical cousin, the ascending wedge usually rings a bearish bell especially after a solid uptrend.
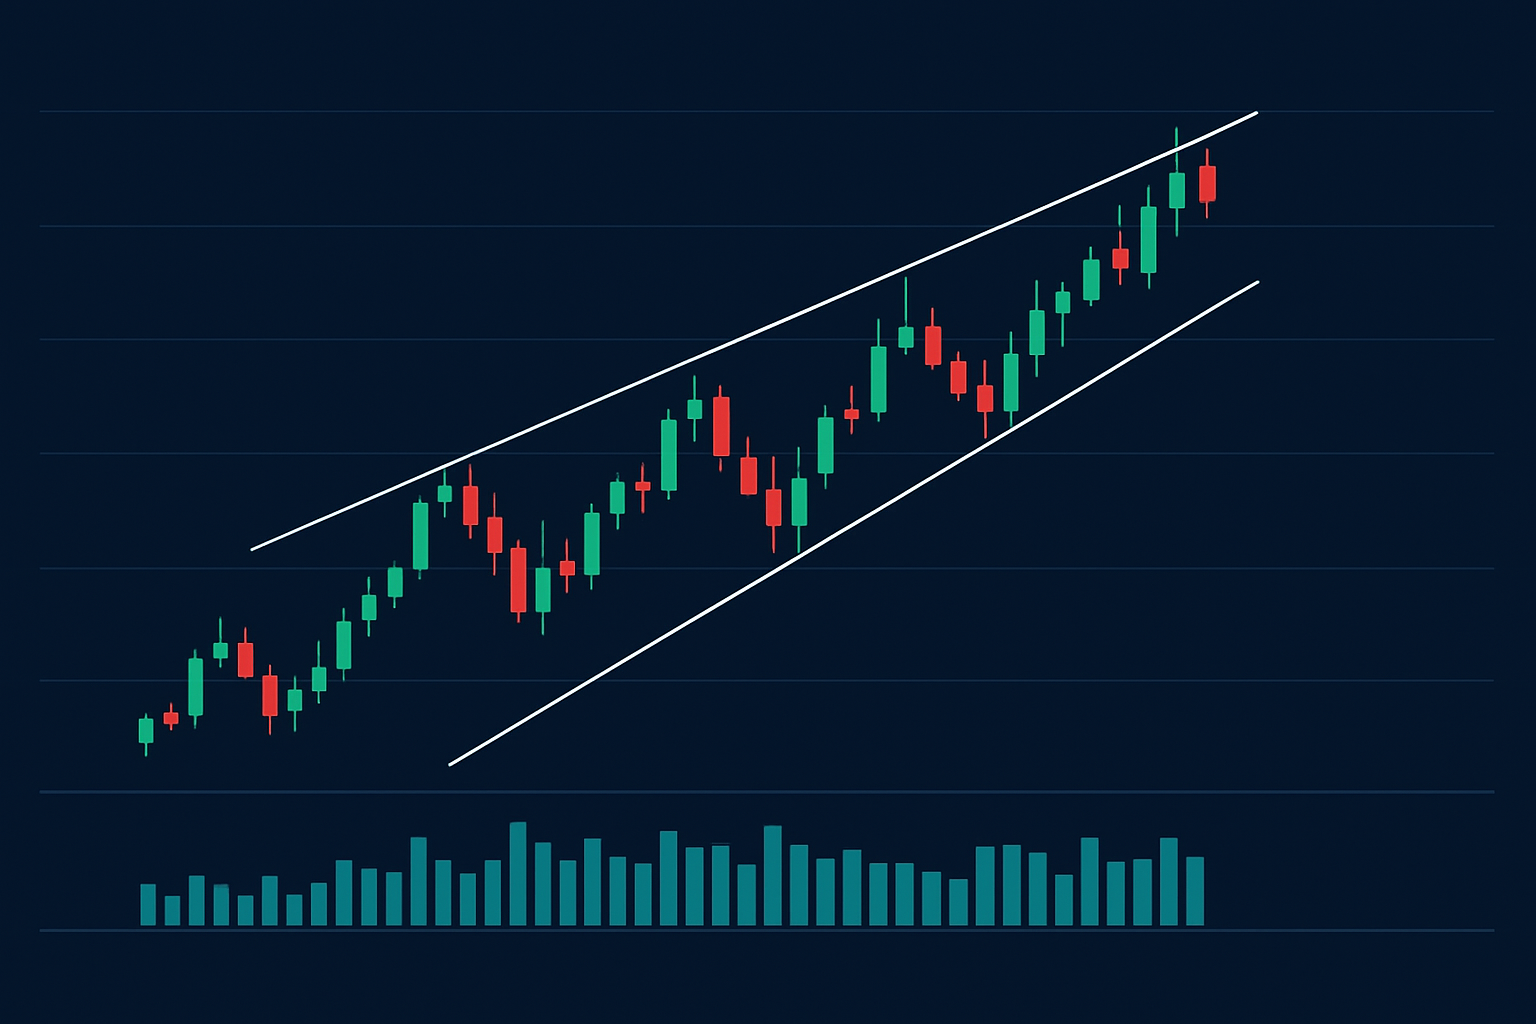
Illustration of a typical ascending wedge pattern on a price chart demonstrating converging trendlines and breakout signals.
An ascending wedge usually signals that bullish momentum is starting to lose steam. Prices keep climbing to higher highs and lows but do so with less gusto each time. It’s like buyers are slowly losing their grip while sellers sneak in quietly waiting for their moment. On top of that, volume tends to dip as the wedge takes shape, which backs up the idea that demand is drying up.
Spot a genuine ascending wedge by seeing the price steadily carving out higher highs and higher lows within trendlines that draw closer together. It’s worth being cautious when those trendlines look fuzzy or volume refuses to dip because you might be chasing a false alarm or staring at something else entirely like flags or channels playing tricks on you
Spot two upward sloping trendlines: one that connects those higher highs and another tracking the higher lows, with both gradually inching closer together over time.
Check that the price range between these lines is narrowing, a sign that momentum is starting to run out of steam.
Keep an eye on volume patterns too—they usually take a nosedive while this pattern is forming.
An ascending wedge popping up after an uptrend often signals a bearish reversal, kind of like a warning light flickering on.
Typically, you’ll see a drop below the lower trendline paired with a surge in volume before jumping in.
Taking a peek at multiple timeframes usually does wonders for dialing in accuracy when spotting ascending wedge patterns. Catching the pattern on a daily chart can really cement your understanding of the longer-term trend, while shorter timeframes like hourly charts come in handy for zeroing in on those sweet entry and exit points. I’ve found it’s super useful to lean on trendline drawing tools and volume indicators found on platforms like TradingView or TrendSpider to paint a clearer picture.
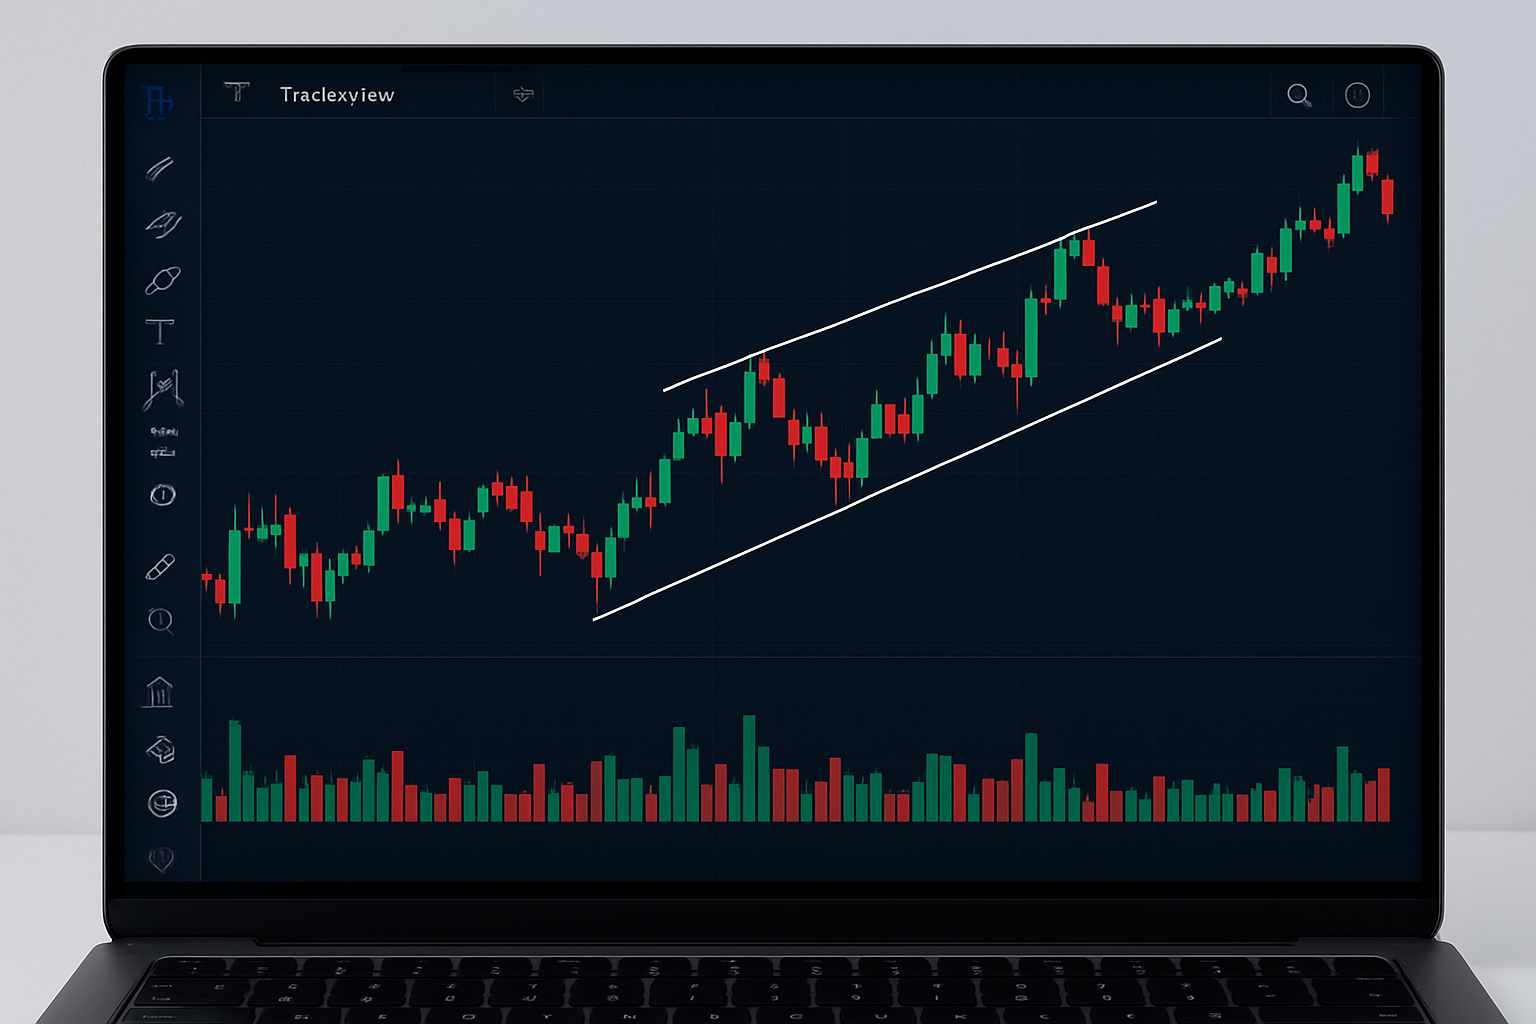
Example of identifying ascending wedge patterns on a multi-timeframe chart with supporting volume analysis.
It’s a good idea to double-check those trendlines and keep a close watch on volume trends. Take the bigger market picture into account and hold off until you see a clear breakout signal before jumping into any trades.
Traders often keep a close eye on the ascending wedge pattern, treating it as a bit of a red flag and a nudge to either jump into short positions or consider exiting trades. When you throw volume and the bigger picture of the trend into the mix, it usually sharpens risk management quite nicely.
Spot the ascending wedge early on by making it a habit to scan your charts for those classic rising converging trendlines. They tend to sneak up on you if you’re not paying close attention.
Double-check the pattern by keeping an eye out for decreasing volume and glance back at the prior trend which usually shows an upward climb. It is kind of like a warm-up act before the main event.
Plan your entry near the breakout or breakdown point and aim to sell as soon as you see a clear break below the lower trendline. Timing here can be a bit of a dance but practice makes perfect.
Always place a stop-loss just above the upper trendline to shield yourself if the breakout ends up being a false alarm. Not fun but better safe than sorry.
Set your profit targets using measured moves, for example projecting the wedge’s widest range straight down from the breakout point. It’s a neat trick I’ve found quite handy in the past.
Short-term traders often watch for the ascending wedge pattern on intraday charts to catch swift reversals before they disappear. On the flip side, longer-term investors track the same formation on daily or weekly charts to find meaningful trend shifts that stick around. Platforms like Binance offer powerful tools tailored for the active trader's fast pace.
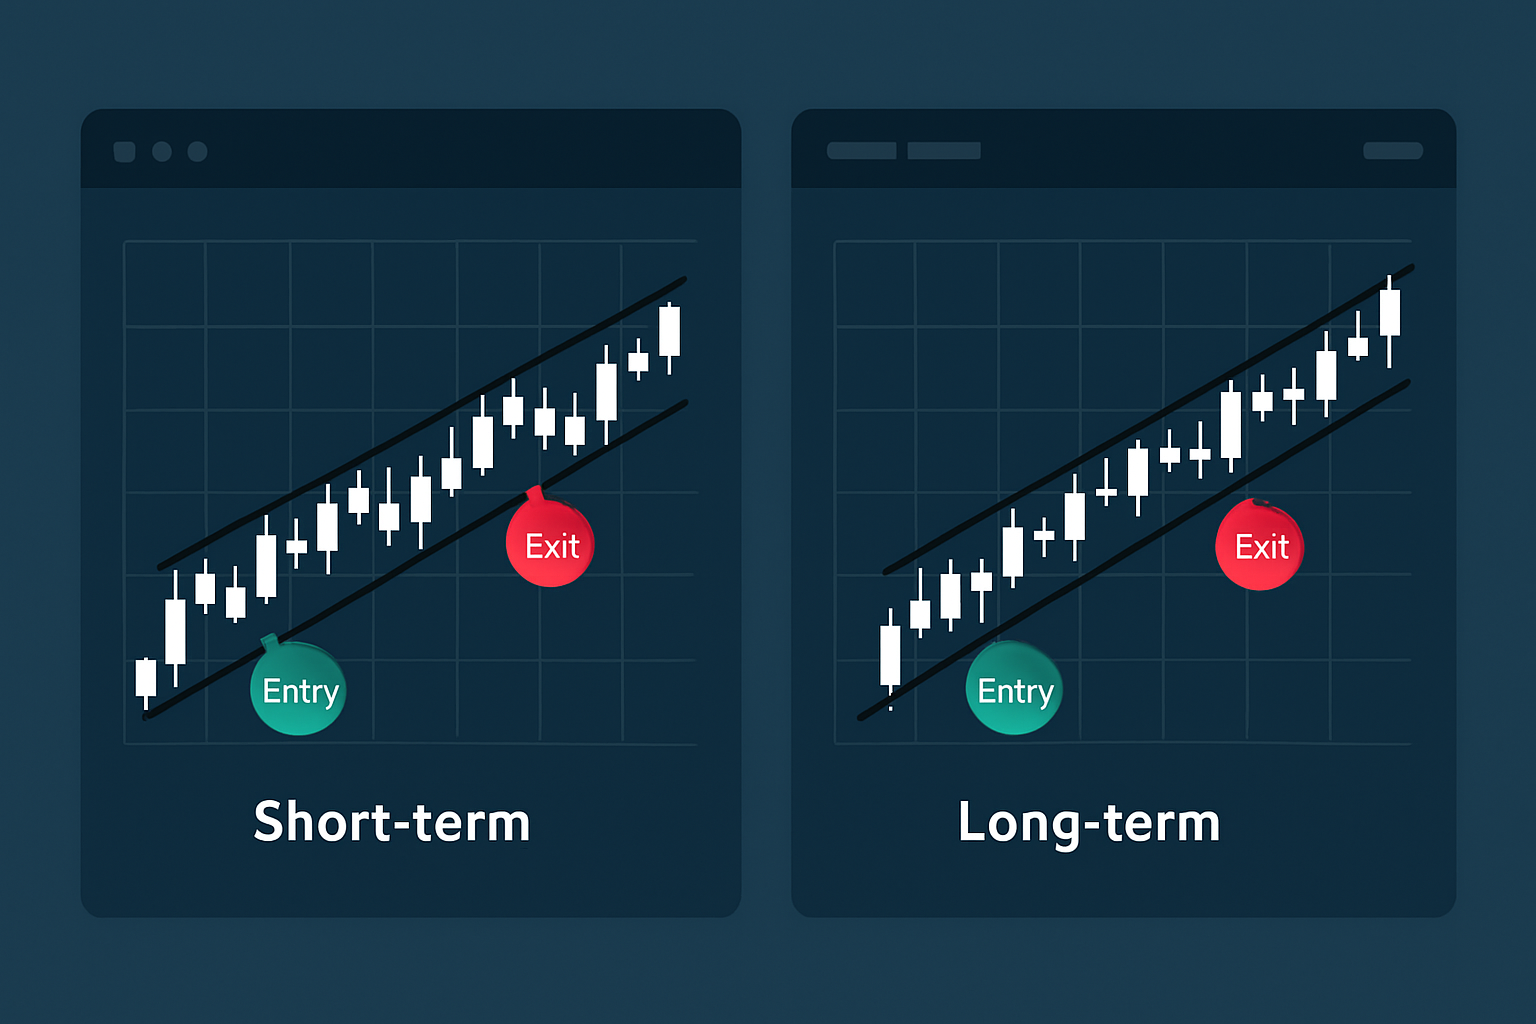
Side-by-side view of ascending wedge use in short-term day trading versus longer-term investment strategies.

Are you tired of juggling multiple tools for your trading needs? TradingView is the all-in-one platform that streamlines your analysis and decision-making.
With its powerful charting capabilities, real-time data, and vibrant community, TradingView empowers traders like you to stay ahead of the market. Join thousands who trust TradingView for their trading success.

20 posts written
Unlock the power of the bear flag pattern with our practical, step-by-step guide. Understand market...

Unlock the power of the head and shoulders pattern with this complete guide. Learn to spot, trade, a...

Master the hammer candlestick pattern—a key indicator for market reversals. This beginner-friendly g...

Discover the doji candlestick—a powerful price action signal revealing market indecision. This begin...