


Technical Analysis
How to Spot a Hammer Candlestick in Trading Charts
Master the hammer candlestick pattern—a key indicator for market reversals. This beginner-friendly g...

This article breaks down how to spot and trade symmetrical triangle patterns to help you make smarter calls with your technical analysis.
The symmetrical triangle pattern is a classic technical analysis formation that tends to pop up during moments of market indecision, right before the big breakout.
Chart patterns are those telltale shapes that pop up on price charts, giving traders a sneak peek into where the market might head next. Take the symmetrical triangle pattern for instance—it’s like the market’s way of catching its breath during a consolidation phase, often hinting at an impending breakout.
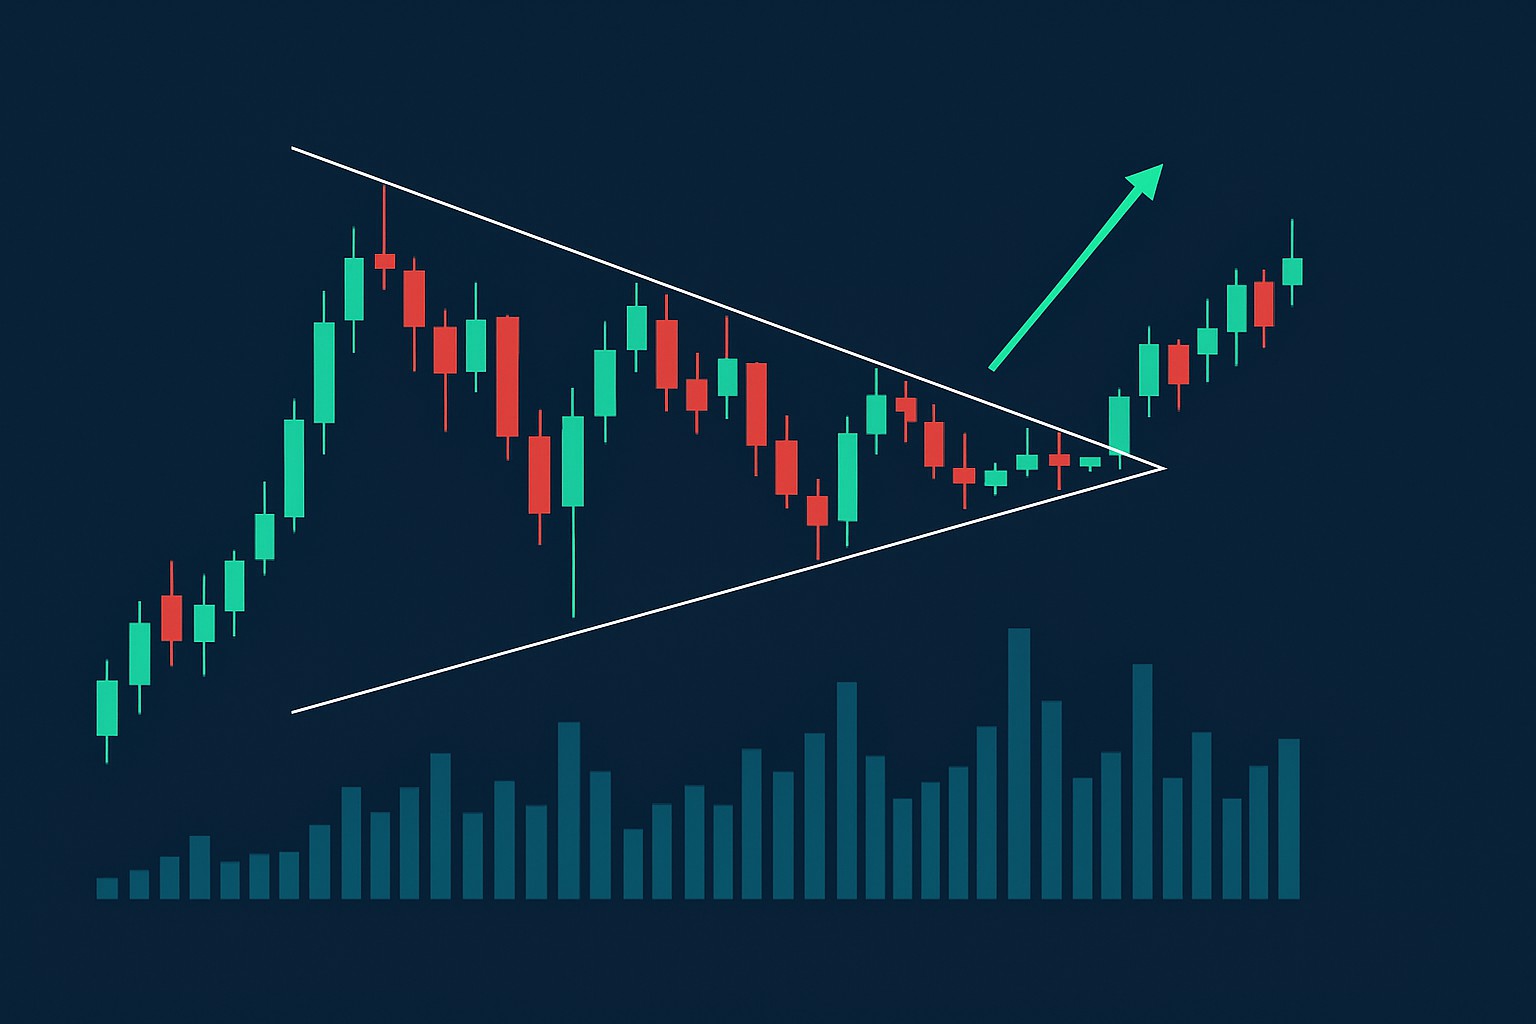
A symmetrical triangle pattern shows up when price action crafts two trendlines that gradually come together—the upper line dips downward while the lower one climbs up. It’s like a tug-of-war between buyers and sellers each holding their ground. Usually this signals a phase of consolidation, a calm before the storm.
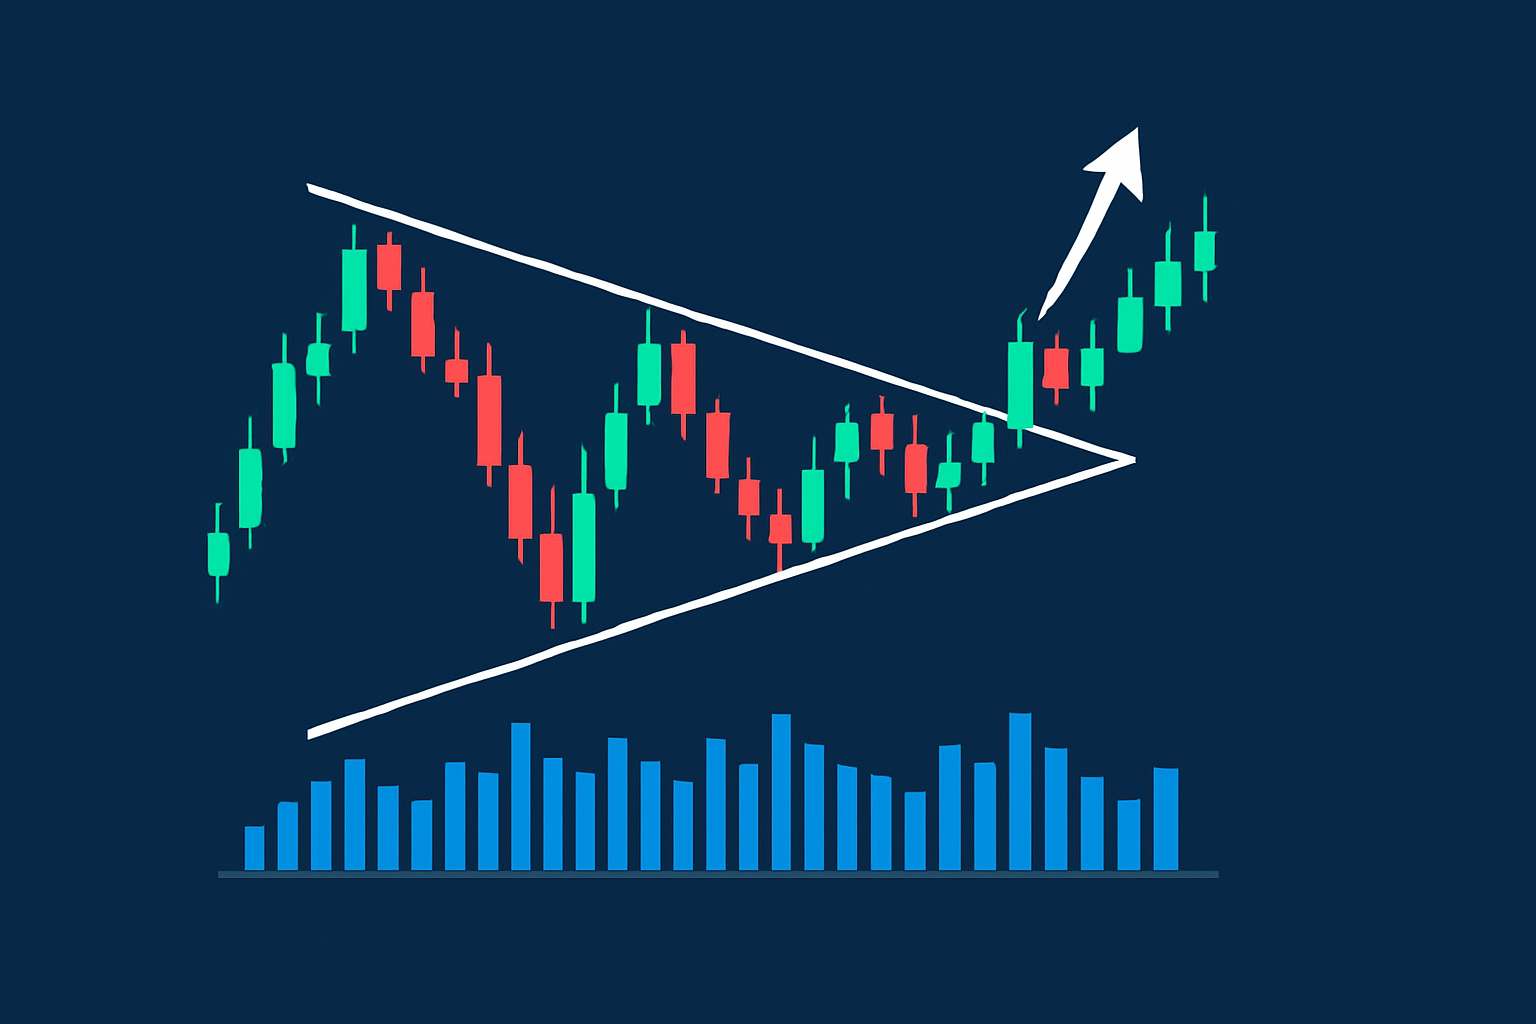
Illustration of a symmetrical triangle pattern with converging trendlines and volume contraction
Spot the prior trend to really get the lay of the land before that triangle starts to take shape.
Sketch out your trendlines by linking at least two lower highs with two higher lows—think of it like connecting the dots.
Double-check that these lines inch closer together and form a neat symmetrical triangle.
Notice how the volume tends to taper off inside the pattern; this usually hints at some calm after the storm or consolidation.
Keep a sharp eye on timing since legit patterns often unfold over several weeks and not just a quick flash in the pan.
Popular charting platforms like TradingView and TrendSpider come packed with user-friendly drawing tools and volume indicators. They also have pattern recognition features that help traders zero in on symmetrical triangle patterns with greater accuracy and speed
Beginners often get tripped up mixing symmetrical triangles with ascending or descending ones even though they usually point to quite different breakouts. To keep yourself in the clear it really pays off to watch those trendline slopes carefully. Symmetrical triangles have converging lines that lean in at roughly the same angle. Ascending triangles feature a flat resistance line with a rising support line and descending triangles flip that around.
Traders often keep a keen eye on symmetrical triangle patterns because they help spot potential breakouts and set entry points, stop-losses and profit targets.
Hold off until you see a clear breakout through one of the trendlines. Ideally, look for a noticeable jump in volume before diving into a trade.
Estimate the price target by measuring the vertical height of the triangle at its widest part, starting from that breakout point. Think of it like sizing up the jump before you leap.
Place your stop-loss orders just beyond the opposite trendline because this little safety net can save you from nasty surprises.
Keep a sharp eye on volume spikes since they are the best way to tell if your breakout has some real muscle behind it.
Adjust your trade settings based on how wild the asset's volatility is and the timeframe you prefer. There is no one-size-fits-all here, really.
Managing risk is vital when dealing with symmetrical triangles because false breakouts can cause problems. It’s a good idea to rely on stop-loss orders and resist diving into trades headfirst. Also, give some real thought to how you size your positions.
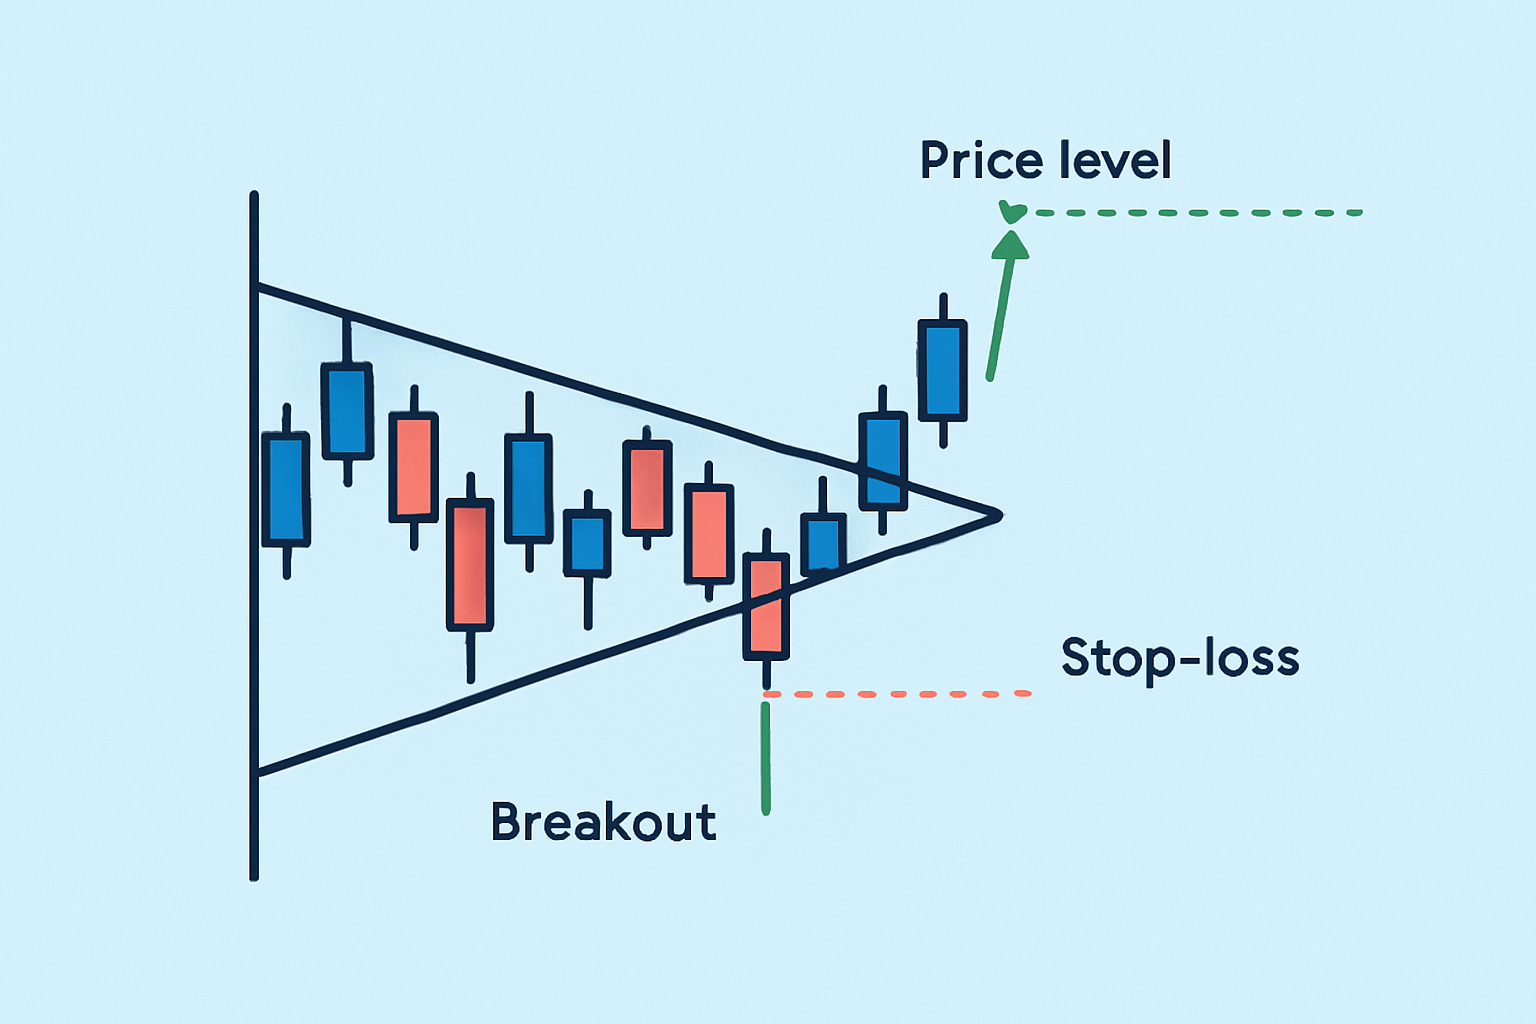
Example of a breakout trade setup using a symmetrical triangle pattern with risk management levels
With TradingView we dive into a recent stock chart by sketching trendlines that form a symmetrical triangle pattern, converging on lower highs and higher lows. Along the way we keep an eye on how volume tightens like it’s holding its breath and pinpoint the moments when a breakout makes its grand entrance.
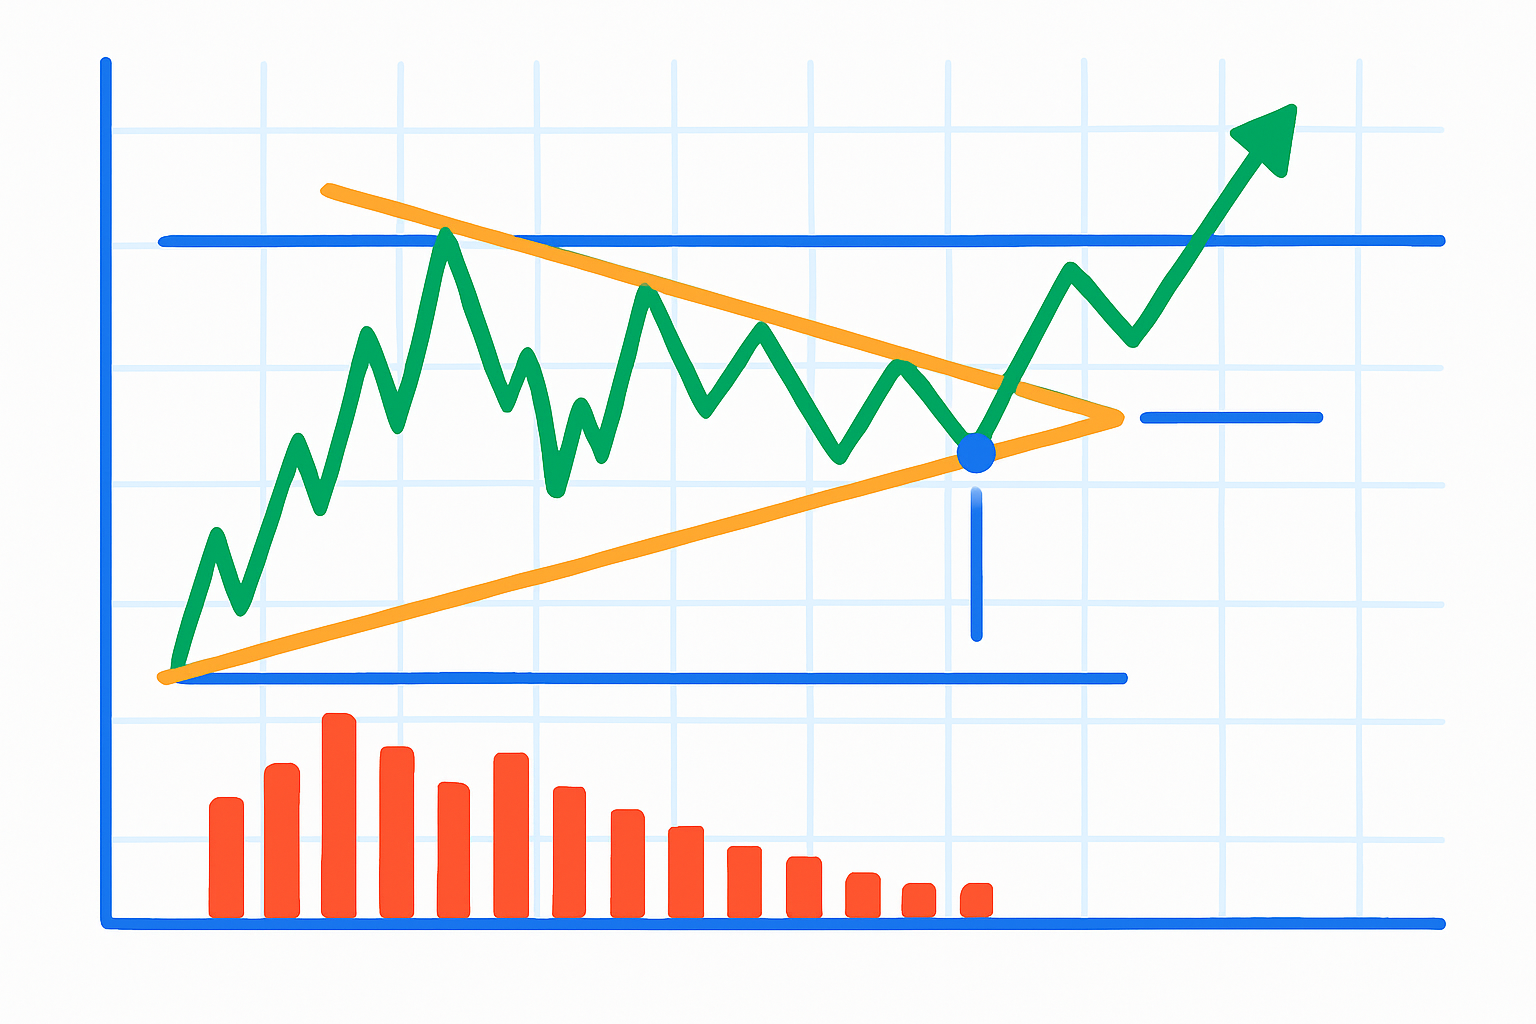
Annotated TradingView chart showing a real symmetrical triangle pattern with breakout signals
Let's dive into some of the common curiosities and head-scratchers individuals often have about symmetrical triangle patterns—because who does not love a good puzzle in the charts now and then?

Are you tired of juggling multiple tools for your trading needs? TradingView is the all-in-one platform that streamlines your analysis and decision-making.
With its powerful charting capabilities, real-time data, and vibrant community, TradingView empowers traders like you to stay ahead of the market. Join thousands who trust TradingView for their trading success.

16 posts written
Master the hammer candlestick pattern—a key indicator for market reversals. This beginner-friendly g...

Unlock the power of candle patterns to decode market psychology and improve your trading precision....

Discover the bullish harami candlestick pattern—a key technical signal that can hint at trend revers...

Learn how the harami candlestick pattern signals potential market reversals. This guide breaks down...