


Technical Analysis
Understanding the Bullish Harami Candlestick Pattern
Discover the bullish harami candlestick pattern—a key technical signal that can hint at trend revers...

Bearish candlestick patterns are quite the unsung heroes in technical analysis, often throwing up early warning flags when the market might be gearing up for a dip. Catching these subtle signals can really help traders stay one step ahead, giving them the chance to brace for a downturn or even turn the situation to their advantage by capitalizing on falling prices.
Candlestick charts display price movements over specific time frames using candles that represent the open, high, low and close prices. Bearish candlestick patterns are valuable because they do more than track price shifts—they capture trader psychology and shifting market mood.
Bearish candlestick patterns reveal a few telltale signs: the shape and size of the candle body, the position of the wicks or shadows and how the opening and closing prices stack up against each other.
For traders on the lookout for potential dips before they really hit, familiarizing themselves with the most reliable bearish candlestick patterns is absolutely vital.
When sellers come in like a tidal wave, swallowing up the buyers' gains
A gloomy sign bulls might be losing their grip, casting a shadow over the day’s optimism
The market’s way of saying "That’s enough upside for now," hinting that a top might be near
A quick rise followed by a sharp fall, like the market shooting for the stars but burning out fast
Looks like a harmless fellow hanging around, but beware—it often signals trouble brewing beneath the surface
The bearish engulfing pattern shows up when a large bearish candle completely swallows the previous smaller bullish candle, waving a pretty clear flag for a reversal in buyer control. It’s important because it signals a sudden momentum shift—usually backed by a surge in volume—and hints at some serious selling pressure that could lead to a noticeable dip.
Spotting the dark cloud cover pattern is all about watching for a bearish candle that kicks off above the previous day's high but then closes below the midpoint of the earlier bullish candle, almost like a plot twist. This kind of intraday reversal often waves a red flag hinting at a sudden drop in buying enthusiasm and a growing mood of bearishness.
Ah, the Evening Star—such a poetic name for that bright speck that twinkles steadfastly in the twilight. It’s like the sky's little night light, guiding wanderers and dreamers alike as day makes its graceful exit.
The evening star pattern unfolds across three candles. It starts with a robust bullish candle followed by a small-bodied candle that signals market hesitation. It ends with a bearish candle that seals the reversal, often accompanied by a noticeable uptick in volume as things head south.
Sometimes, life surprises you like a shooting star blazing across a quiet night sky—brief, dazzling, and impossible to ignore.
Telling a genuine shooting star apart from false signals takes a keen eye and a bit of patience, paying close attention to its position and the surrounding context. This pattern features a small real body nestled near the period’s low, paired with a long upper shadow that’s at least twice the size of the body—a classic sign that the price tried to shoot higher but got held back. You’ll usually spot it after an uptrend and hovering near resistance levels, suggesting that buyers made a solid effort but just couldn’t push prices any further.
The hanging man pattern tends to show up after a solid run-up and features a small body perched near the top of the price range, accompanied by a long lower wick. It reveals that sellers did their best to push prices down during the session, but buyers staged a comeback to claw back most of the losses. When you see this pattern backed up by higher volume and a weak candle following it, it often hints at a fading bullish momentum and can act as a heads-up for a potential dip ahead.
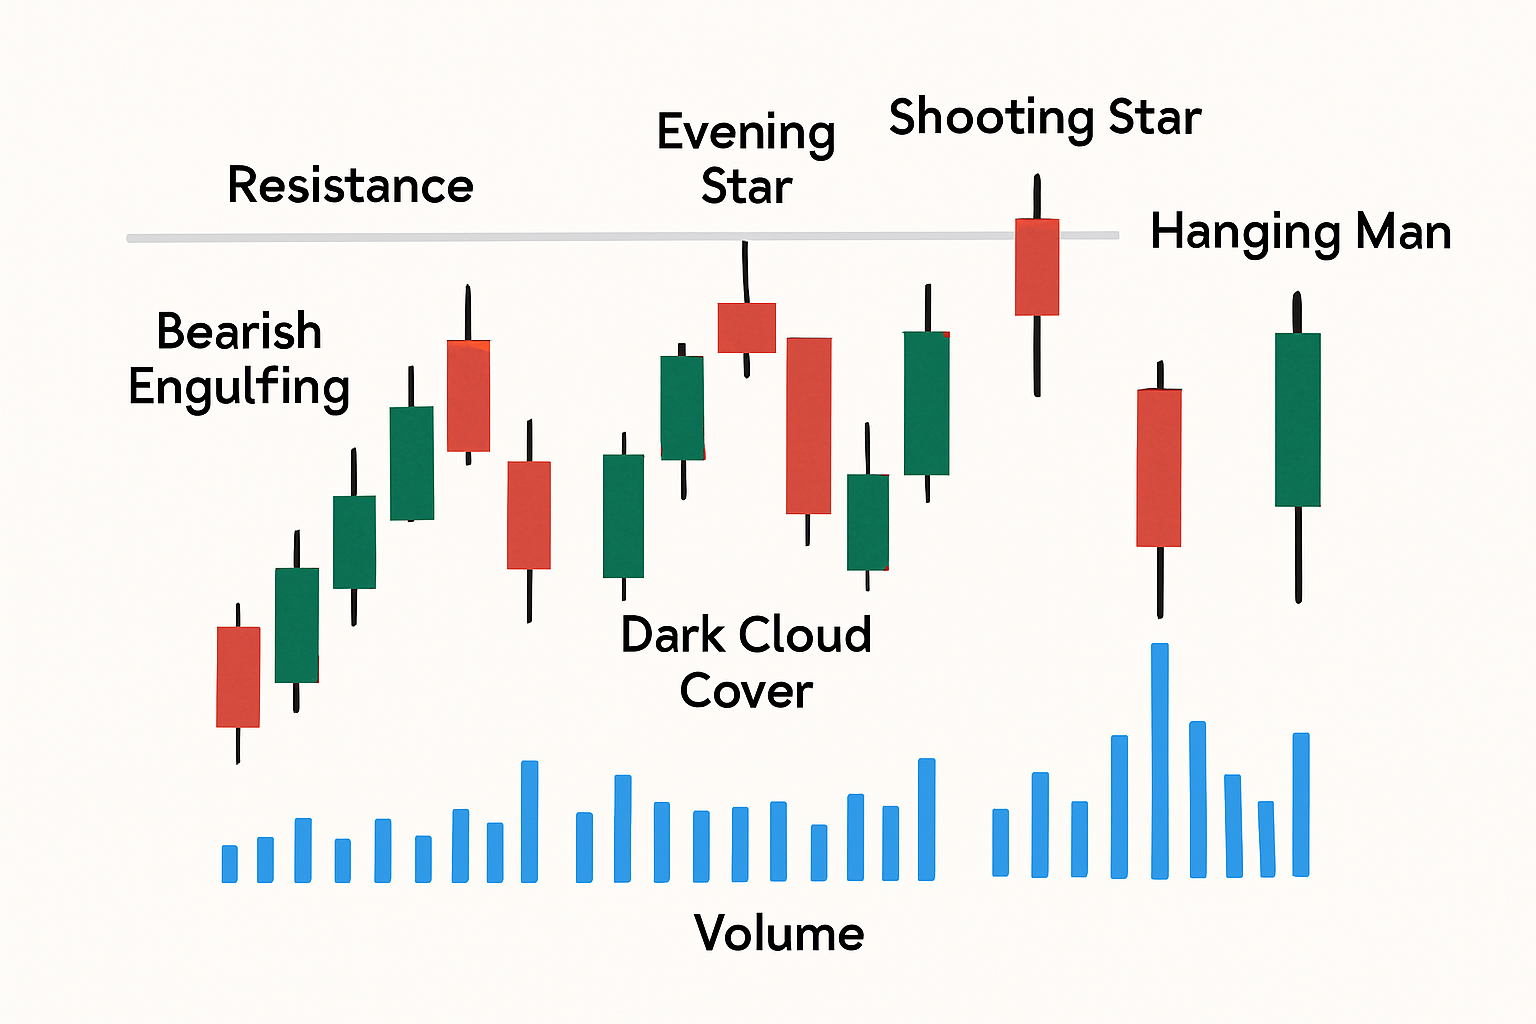
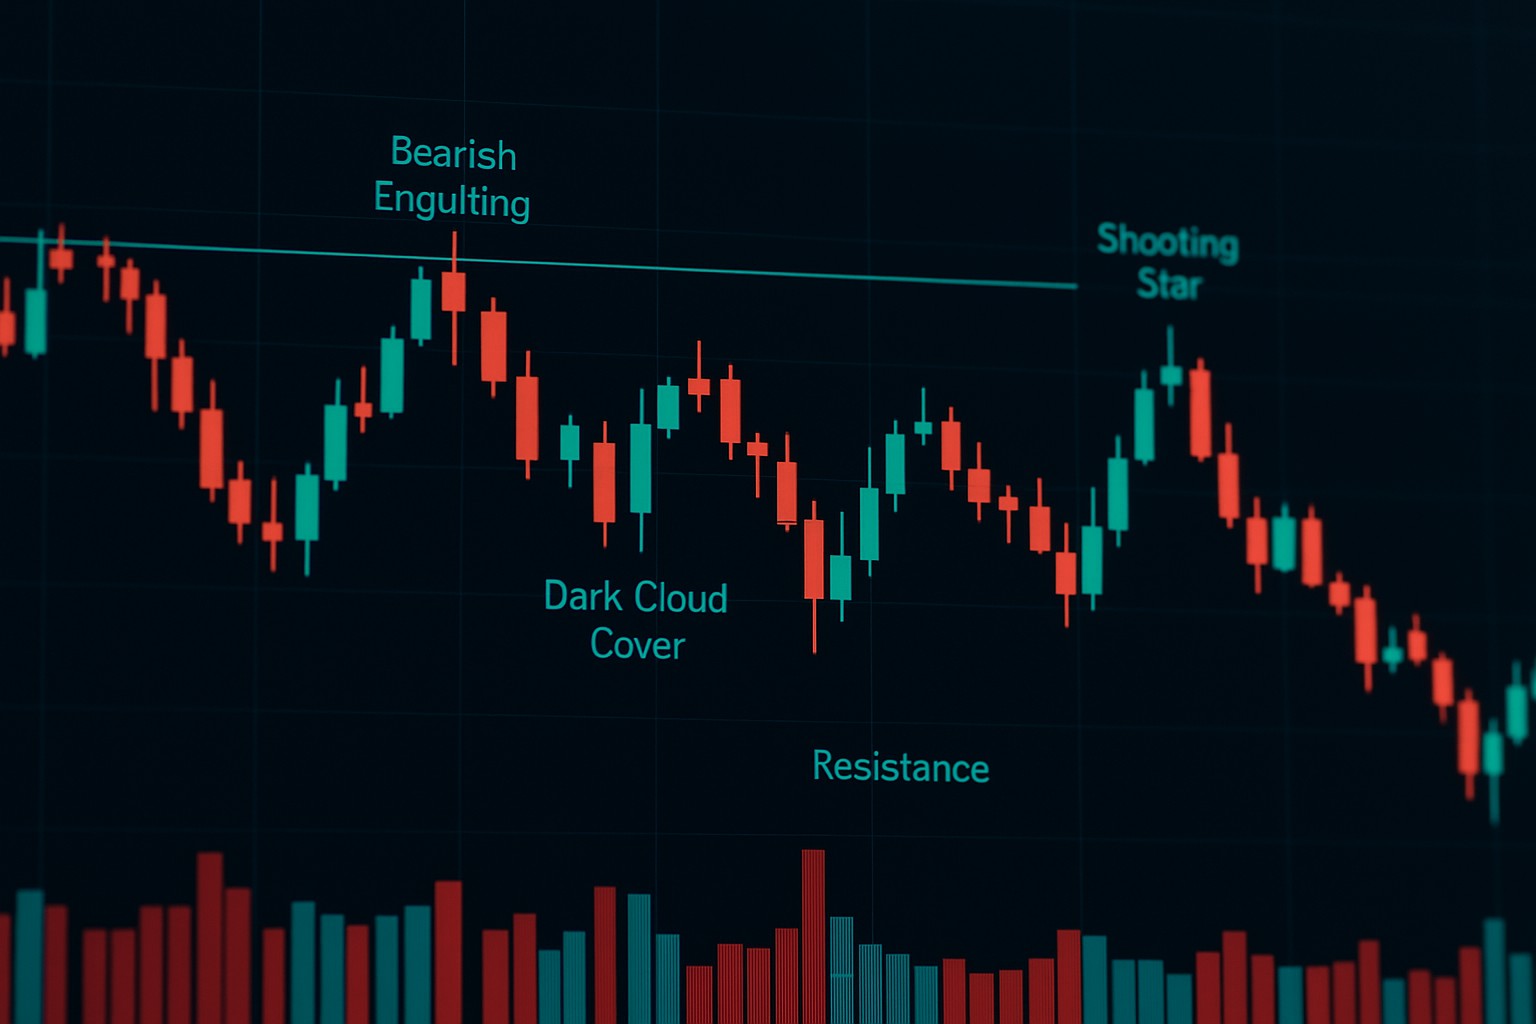
Visual examples of key bearish candlestick patterns alongside volume confirmation and resistance levels
Bearish candlestick patterns tend to hold more weight when you don’t look at them in isolation but pair them with other technical indicators and the bigger picture of the chart. Combining these patterns with trend analysis, volume data and support or resistance levels usually helps cut through the noise and reduce false signals.
Successfully using bearish candlestick patterns in your trading takes a fair share of discipline and a solid, clear-cut strategy. Leaning on approaches like confirming signals across multiple timeframes and keeping an eye on volume can really up your game when it comes to anticipating those inevitable dips.
It’s always a smart move to double-check bearish patterns on higher timeframes before jumping in—helps steer clear of those pesky false signals that can trip you up.
Take a good look at the volume trends to confirm if the selling pressure really has some muscle behind that bearish setup.
Keep a watchful eye on market news or events because these can shake things up and throw the reliability of the pattern out the window.
Be diligent with your risk management—placing stop-loss orders just above the pattern highs can save you from nasty surprises.
Think of bearish candlestick patterns as just one piece of the puzzle in a well-rounded trading plan that also weighs in other technical and fundamental factors.
Putting your bearish candlestick strategy to the test against historical market data is a key step. It not only boosts your confidence but also hones the way you read patterns, while helping you nail down the timing of your trades for better results
Even seasoned traders can occasionally find themselves tripping up when they lean too heavily on bearish candlestick patterns alone. It’s important to keep an eye out for common pitfalls, like missing the bigger picture of the overall market or misreading volume signals.

Tired of missing opportunities and making suboptimal trading decisions? TrendSpider's cutting-edge platform automates complex technical analysis, saving you time and reducing human error.
With multi-timeframe analysis, dynamic alerts, backtesting, and customizable charting, you'll gain a competitive edge in identifying trends and making informed trades across global markets.

23 posts written
Discover the bullish harami candlestick pattern—a key technical signal that can hint at trend revers...

Discover what IOUs mean in finance, their role as informal debt acknowledgments, and how understandi...

Master the hammer candlestick pattern—a key indicator for market reversals. This beginner-friendly g...

Unlock the power of candle patterns to decode market psychology and improve your trading precision....