


Technical Analysis
Understanding the Bullish Harami Candlestick Pattern
Discover the bullish harami candlestick pattern—a key technical signal that can hint at trend revers...

This article breaks down how to use trading patterns effectively and offers actionable strategies to boost your market analysis.
Grasping trading patterns is a must-have skill for traders, and having a trading patterns cheat sheet can help whether you're just starting out or have been around the block a few times.
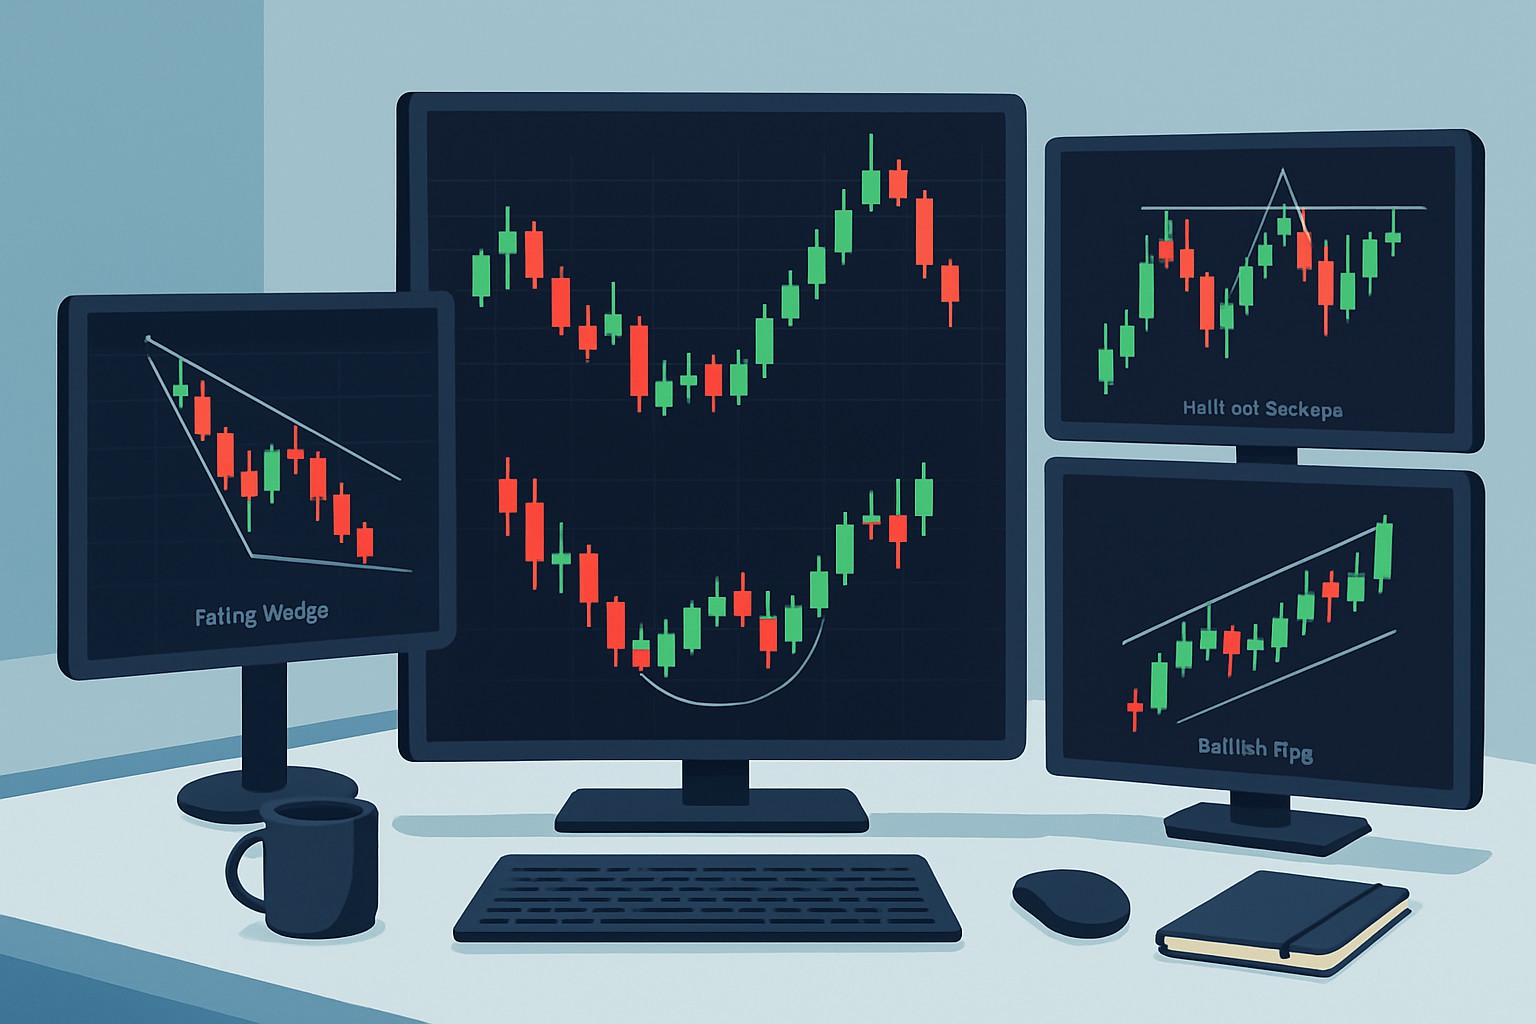
Trading patterns appear as distinct shapes on price charts like a secret code that reveals how investors feel and hints at what might come next. Rooted in technical analysis, these patterns help traders predict trends, reversals, and continuations based on past price moves. Whether you’re a day trader hustling every minute or a long-term investor playing the waiting game, spotting these patterns can sharpen your timing for entry and exit, keep risk in check, and help you ride momentum like a pro catching the perfect wave.
Kick off your daily routine by pulling up your charts and scanning for those trusty familiar patterns. Before you jump on any obvious signals, it’s a good idea to double-check them with volume or other indicators
Various trading patterns often hint at possible market trends, giving traders a helpful nudge on when to jump in or cash out based on how prices are expected to move.
| Category | Pattern Name | Visual Shape | Typical Market Context | Trading Signal | Example Use |
|---|---|---|---|---|---|
| Reversal | Head and Shoulders | Three peaks with the middle peak standing tall as the highest point | Usually pops up after a nice run-up in the market | Often hints that the trend might be tipping over to the downside | Time to think about closing long positions or maybe even flirting with short entries |
| Reversal | Double Top/Bottom | Two peaks or troughs roughly matching each other in level | Shows up after a solid uptrend or downtrend | Many traders take this as a sign that the trend’s ready to turn around | A good moment to pocket profits or flip your position to the opposite side |
| Continuation | Triangles | Trendlines that converge, forming a neat little triangle shape | Commonly spotted in markets that have some direction | A pretty strong clue that the current trend is likely to stick around | Jump in when price breaks out in the trend’s favor—timing is everything here |
| Continuation | Flags and Pennants | Small rectangles or pennants trailing a sharp price move | Usually appear right after a big price jump or plunge | Generally a signal that the trend’s got more steam left | Best to confirm momentum before diving in |
| Continuation | Cup and Handle | A U-shaped cup with a tiny consolidation handle just after | Classic sign that the bulls aren’t ready to quit | When price breaks above the handle’s resistance, a new upward push is on deck | Time to go long once that breakout is confirmed |
| Reversal/Continuation | Wedges | Sloping trendlines that come together nicely | These patterns can play both ways—reversal or continuation | The direction really hinges on which side the price decides to break out | Keep your game flexible and adapt based on how the breakout shakes out |
| Bilateral | Rectangles | Parallel horizontal lines marking support and resistance | Often found when the market’s stuck in a range without clear direction | Breakouts from these boxes usually lead to powerful moves | Choose your side based on which way price breaks—no free lunches here |
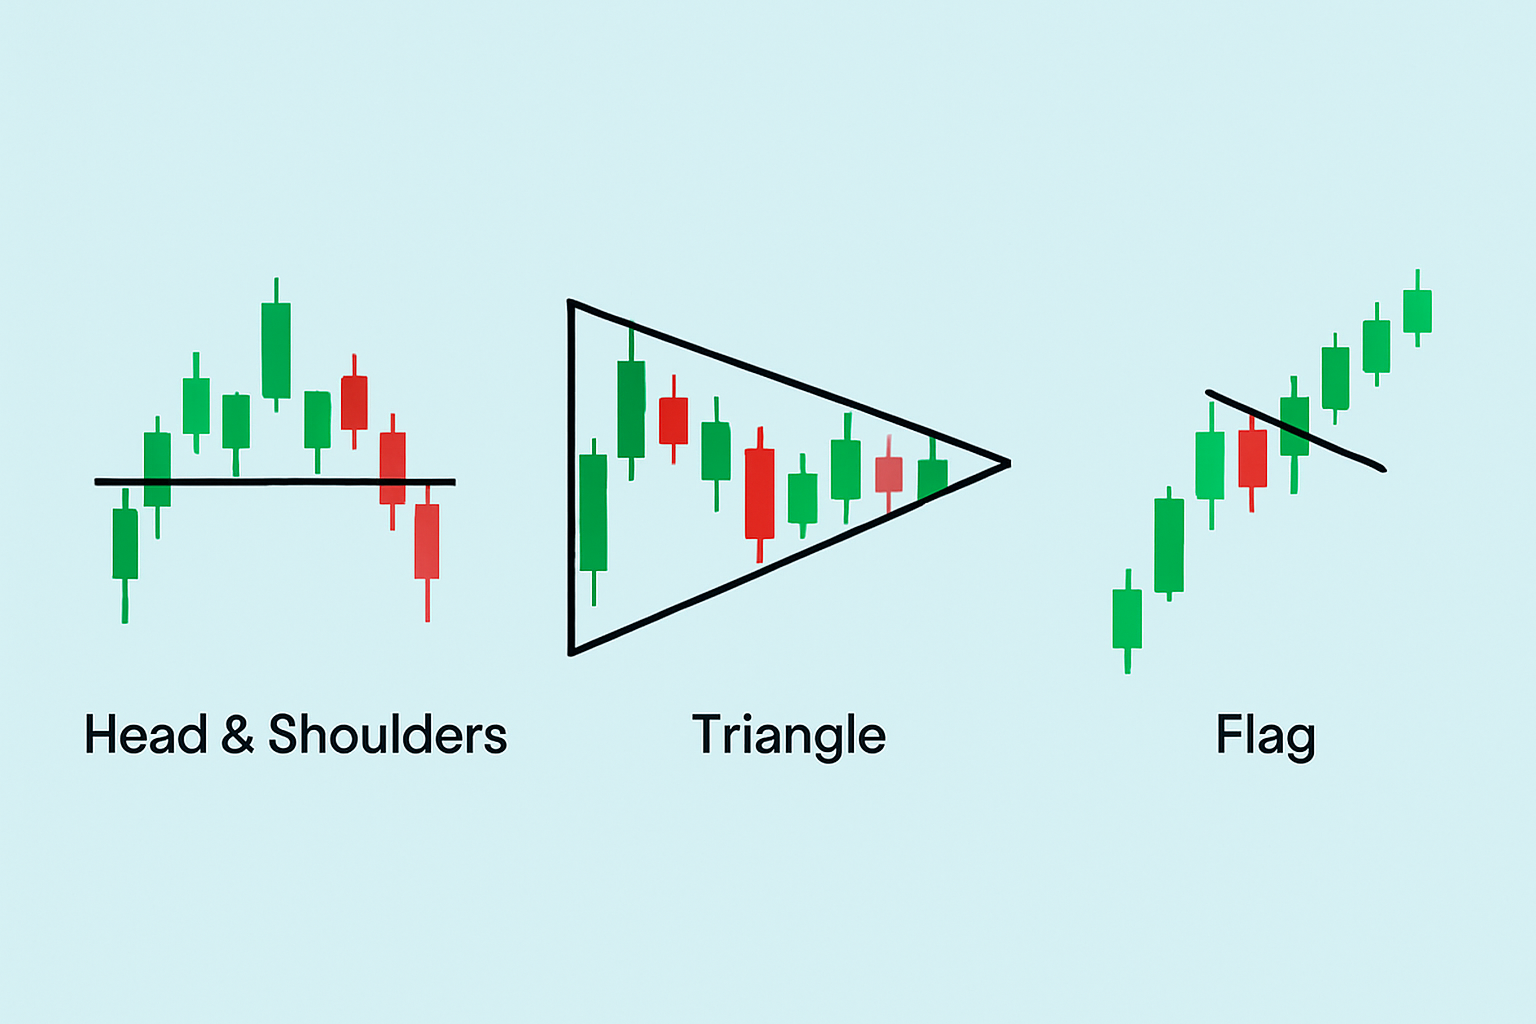
Visual diagram showing a few key trading patterns from the cheat sheet (e.g., Head & Shoulders, Triangle, Flag)
Keep an eye on recent price movements to really get a feel for the current momentum and overall context. Think of it as tuning into the market’s mood.
Zero in on major support and resistance levels because they often act like invisible walls that set the boundaries for the pattern’s dance.
Hunt for distinct shapes or formations that match the patterns on your trusty cheat sheet like a detective spotting clues.
Double-check the pattern’s reliability by looking at volume trends. Usually volume picks up steam when breakouts happen giving you a nice heads-up.
Bring in other trusty indicators like RSI, MACD or moving averages to back up your findings and really confirm the signal’s strength. It’s a bit like getting second opinions before making the call.
Watch out for those sneaky false breakouts where the price pokes its head beyond a pattern only to quickly retreat like it got cold feet.
Racking up more experience, tweaking your trading patterns cheat sheet to mirror what you actually observe will really hone your analytical skills and boost your confidence. You’ll start to catch those subtle market shifts and little details that most generic guides simply overlook.
Traders often find themselves tangled in confusing patterns and mistimed entries and those pesky emotional biases that throw a wrench into clear decision-making.
It really helps to stay disciplined in your analysis and double-check signals with multiple indicators, especially when using a trading patterns cheat sheet as your reference. Also, keep a trusty trading journal where you jot down both your slip-ups and victories.

Struggling to improve your trading performance? Edgewonk's advanced analytics tools are designed to give you the edge you need.
With detailed trade journaling, robust strategy analysis, and psychological insights, you'll gain a comprehensive understanding of your strengths and weaknesses. Don't miss out on this game-changing opportunity.

20 posts written
Discover the bullish harami candlestick pattern—a key technical signal that can hint at trend revers...

Learn how the harami candlestick pattern signals potential market reversals. This guide breaks down...

Discover what IOUs mean in finance, their role as informal debt acknowledgments, and how understandi...

Unlock the power of the head and shoulders pattern with this complete guide. Learn to spot, trade, a...