


Technical Analysis
Understanding the Bullish Harami Candlestick Pattern
Discover the bullish harami candlestick pattern—a key technical signal that can hint at trend revers...

The Three Black Crows pattern is a classic bearish candlestick formation that many traders watch for potential market reversals. We break down what it looks like, how to spot it, and the best ways to use it in your trading.
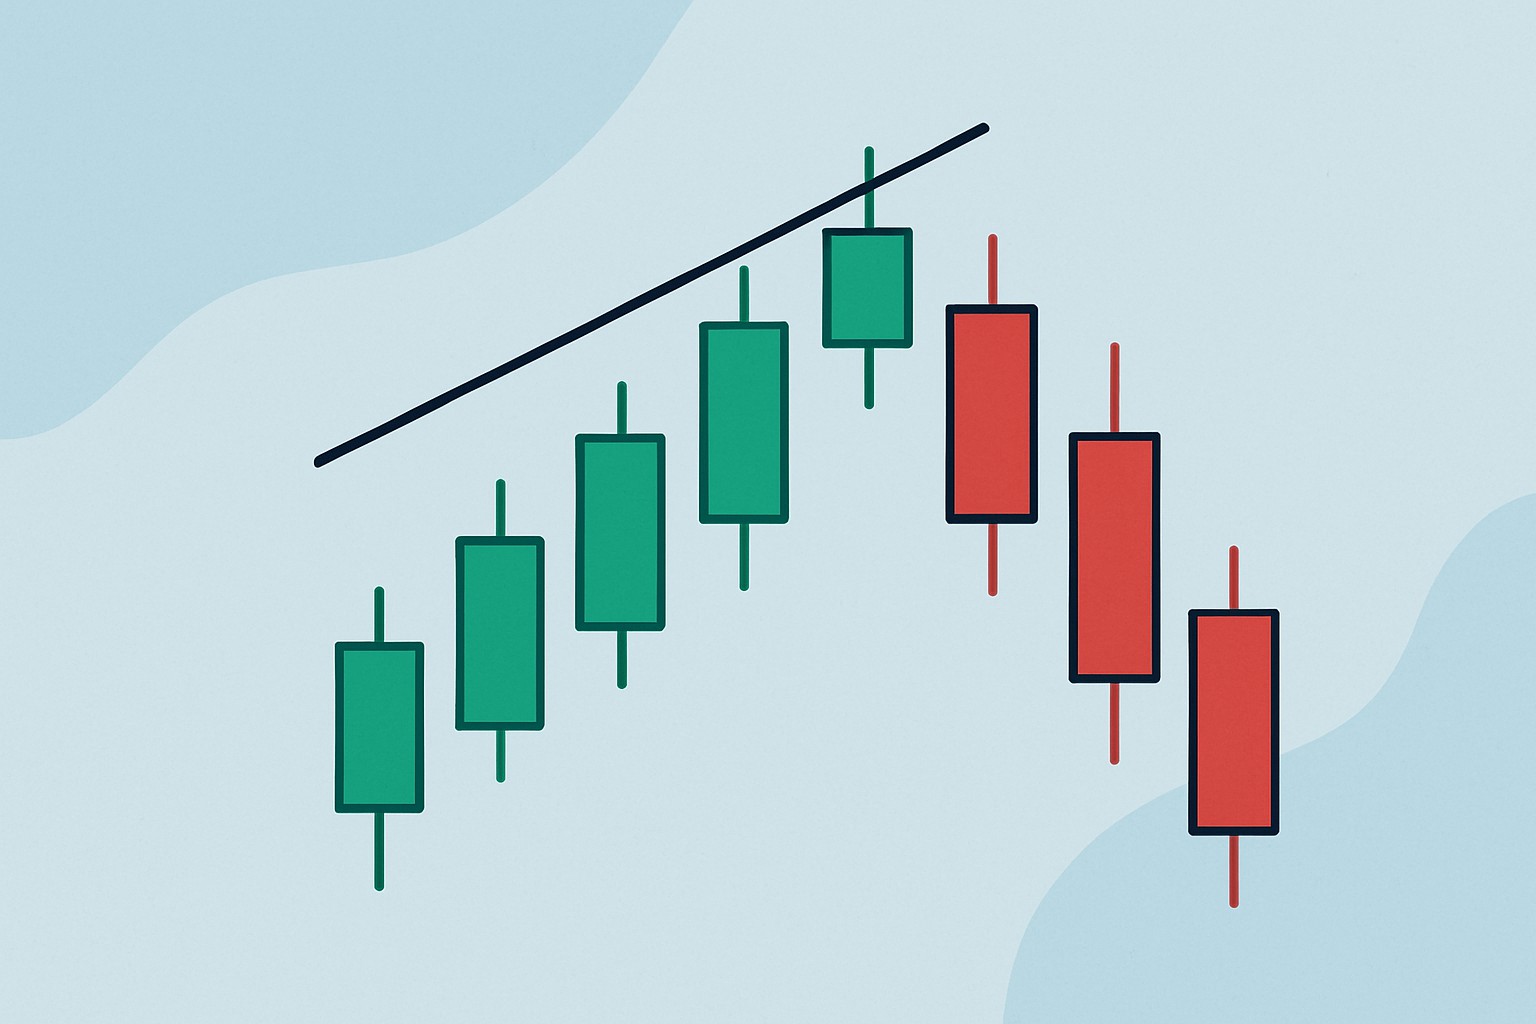
The Three Black Crows pattern pops up as three long bearish candlesticks lined up one after another, usually following a steady uptrend. Each candle typically opens within the range of the one before it and ends up closing near its low, hinting at some pretty relentless selling pressure.
The Three Black Crows pattern isn’t a sure-fire sign that the market will take a nosedive right away. It often hints that sellers might be quietly slipping into the driver's seat.
Spotting the Three Black Crows pattern on a price chart means you need to keep a keen eye on the candlesticks and recent price action. You’re looking for three bearish candles in a row. Each candle is roughly the same size and has very short or almost nonexistent lower shadows. Ideally, each candle opens within the body of its predecessor like stepping stones across a stream.
Visual example of the Three Black Crows pattern on a price chart
The Three Black Crows pattern really stands out but every now and then it can be a bit tricky since it sometimes gets confused with other bearish candlestick patterns like the Evening Star or Three Falling Soldiers.
| Pattern Name | Key Features | How It Differs from Three Black Crows |
|---|---|---|
| Evening Star | A three-candle pattern featuring a small middle candle | The middle candle sports a tiny body (like a doji or spinning top), hinting at indecision and a brief pause in the action |
| Three Falling Soldiers | Shares the bearish vibe with similar candles but usually flaunts longer lower shadows | It points to steeper drops with more pronounced lower wicks, adding a bit more drama |
| Bearish Engulfing | Just one big bearish candle that swallows up the previous one entirely | This duo of candles tends to suggest less drawn-out selling pressure compared to the Three Black Crows, making it a quicker signal |
The Three Black Crows pattern is a classic sign the market mood is taking a sharp turn from cheerful optimism to gloomy pessimism. Over three days, sellers keep the pressure on and steadily push prices down, leaving barely any room for buyers to jump back in. This relentless downward push usually hints that the confidence fueling the earlier rally is fading fast and sellers are fully calling the shots. More often than not, this leads to a bearish reversal or a noticeable pullback.
Picture a bustling marketplace buzzing with eager buyers, the kind of scene that feels alive and full of hope. Then, out of nowhere, three cautious groups of sellers step up one after another, gradually nudging prices downward like clockwork. This subtle but unmistakable change in behavior often signals a shift in sentiment—kind of like the Three Black Crows stepping in to tell us the bulls are taking a breather and the bears are starting to call the shots.
Traders often watch the Three Black Crows pattern to catch potential bearish reversals and find the best moments to jump in or bail out of trades. Once they confirm the pattern, they often open a short position and set a stop loss just above the first black crow's high—because safety comes first. They aim for profits near previous support levels.
Make sure the market is clearly cruising upwards. You want that uptrend in place so the reversal setup doesn’t feel like it’s coming out of left field.
Keep an eye out for the Three Black Crows pattern: that’s three bearish candles lined up back-to-back that meet all the usual criteria.
Double-check with volume spikes or trusty indicators like RSI and MACD which should be flashing growing selling pressure to back up the story.
Consider jumping into a short trade as soon as the third candle shuts its eyes signaling the uptrend might be running low on steam.
Place your stop loss just above the high of the first candle in the pattern. It’s a neat little risk management trick that’s saved me plenty of headaches.
Aim your profit targets at established support levels or shoot for a solid risk-reward ratio of 2 to 1 or better so your gains feel worth the effort.
Managing risk is absolutely key when trading the Three Black Crows pattern. It is far smarter to hold back and wait for those confirming signals rather than diving headfirst into a trade the moment you spot the pattern.
The Three Black Crows pattern can be pretty handy but it’s far from a crystal ball. Every now and then it pops up during strong downward trends without hinting at a reversal and can definitely throw you off. It also tends to mislead when the market is as quiet as a mouse—think low volume or thin liquidity.
Traders often improve their accuracy by pairing the Three Black Crows pattern with technical indicators like the Relative Strength Index (RSI) which helps flag overbought conditions or the Moving Average Convergence Divergence (MACD) to catch momentum shifts. Trend lines also help double-check breakout points and add confidence. Using a platform with solid technical analysis tools—like TradingView or TrendSpider—makes a real difference.
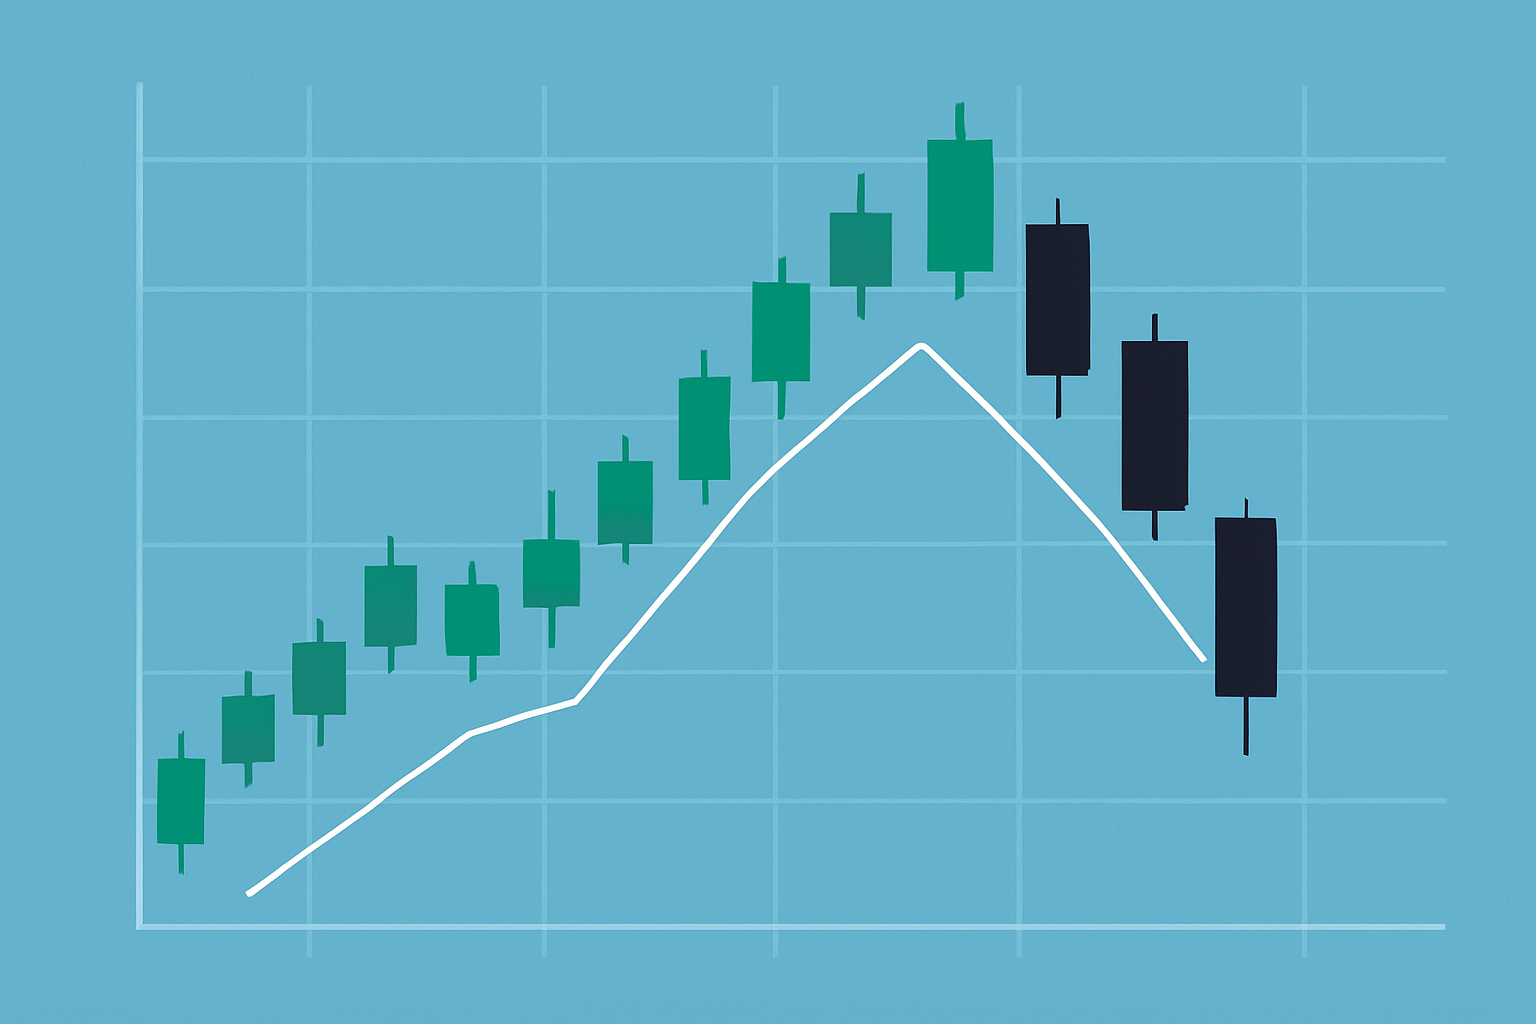
Take a good look at the historical daily price chart of Stock XYZ which had been climbing steadily for a few weeks like it was on a mission. Then out of the blue traders spotted the first black crow after a strong close—almost like a warning sign waving at them. That was quickly followed by two more candles in the same vein. Each one opened snugly within the previous day's body and closed near the day's lows which was hardly a comforting sight. Volume kicked up noticeably, clearly signaling serious selling pressure. After the third candle appeared many traders did not hesitate. They jumped into short positions and carefully placed stop losses just above the first crow's high almost like setting a safety net.
Example of the Three Black Crows pattern forming on a real stock chart with annotations for trade execution
This example with the three black crows pattern really drives home how handy it can be for spotting early bearish reversals, and it underscores why it's absolutely vital to consider candlestick signals together with volume and solid risk management.

Are you tired of juggling multiple tools for your trading needs? TradingView is the all-in-one platform that streamlines your analysis and decision-making.
With its powerful charting capabilities, real-time data, and vibrant community, TradingView empowers traders like you to stay ahead of the market. Join thousands who trust TradingView for their trading success.

17 posts written
Discover the bullish harami candlestick pattern—a key technical signal that can hint at trend revers...

Unlock the power of candle patterns to decode market psychology and improve your trading precision....

Unlock the power of the head and shoulders pattern with this complete guide. Learn to spot, trade, a...

Master the hammer candlestick pattern—a key indicator for market reversals. This beginner-friendly g...