


Technical Analysis
Understanding the Bullish Harami Candlestick Pattern
Discover the bullish harami candlestick pattern—a key technical signal that can hint at trend revers...

The bid-ask spread is a important trading concept that touches everyone in the game whether you’re just starting out or you have been around the block a few times. Understanding the relationship between the bid rate vs ask rate is crucial because this gap directly influences trading costs, market liquidity and how prices get set on the fly.
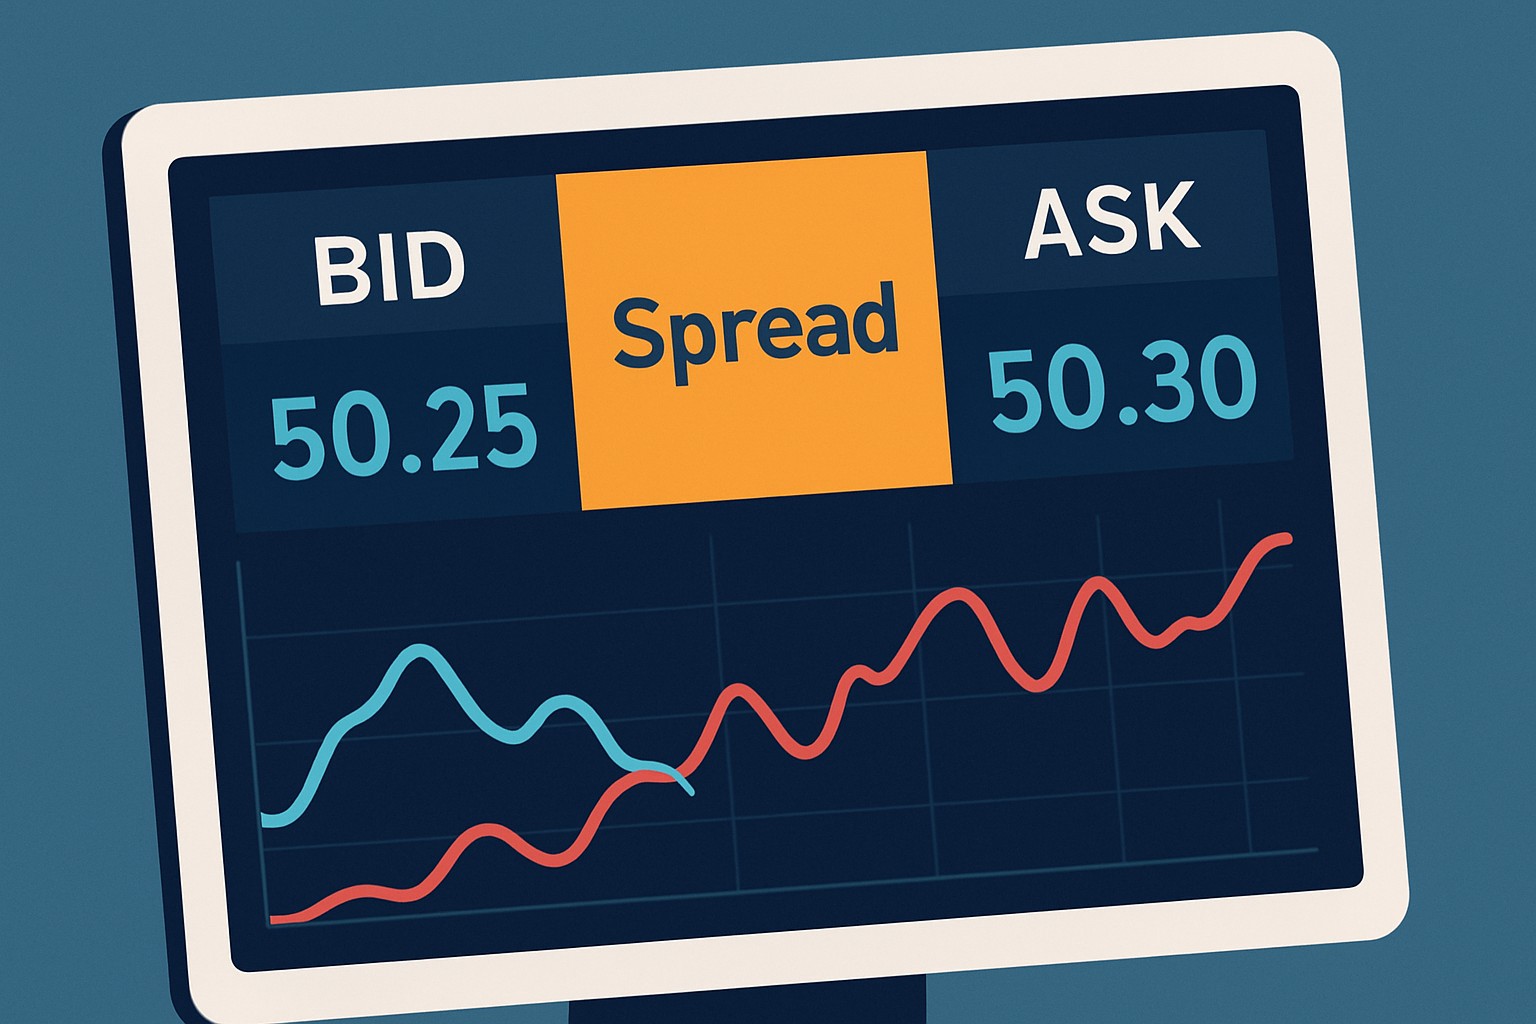
The bid rate is basically the top dollar a buyer is ready to throw down for an asset, while the ask rate shows the lowest price a seller is willing to settle for. Picture a bustling market scene: a buyer throws out $10 for an item (that is the bid), but the seller’s holding out for at least $12 (the ask).
Many new traders often get a bit tangled up when it comes to bid and ask rates because they mistakenly think they’re set in stone. These rates are always on the move, changing with market activity. When many buyers suddenly get interested in an asset, you’ll usually see the bid rate climb higher. Conversely, if sellers flood the market with more supply the ask rate tends to dip down.
The bid-ask spread is simply the gap between the bid price and the ask price. It mostly boils down to the costs and risks that market makers and traders shoulder when they step in to match buy and sell orders. You can think of the spread as a handy little barometer for market liquidity
| Asset Type | Typical Bid Rate Example | Typical Ask Rate Example | Bid-Ask Spread | Notes on Spread Variation |
|---|---|---|---|---|
| Stocks | $50.00 | $50.05 | $0.05 | Stocks with strong liquidity usually keep those spreads nice and tight, which is a relief for many traders |
| Forex Pairs | 1.1200 | 1.1202 | 0.0002 (2 pips) | When it comes to major currency pairs, you can often count on ultra-narrow spreads—it's like the market’s way of saying "let’s keep it fair" |
| Commodities | $70.25 | $70.35 | $0.10 | Commodities spreads can stretch out a bit, especially when the market gets a little jumpy |
| Cryptocurrencies | $30,000 | $30,100 | $100 | Crypto spreads tend to swing quite a bit; lucky for us, Binance usually keeps them on the low side thanks to solid liquidity |
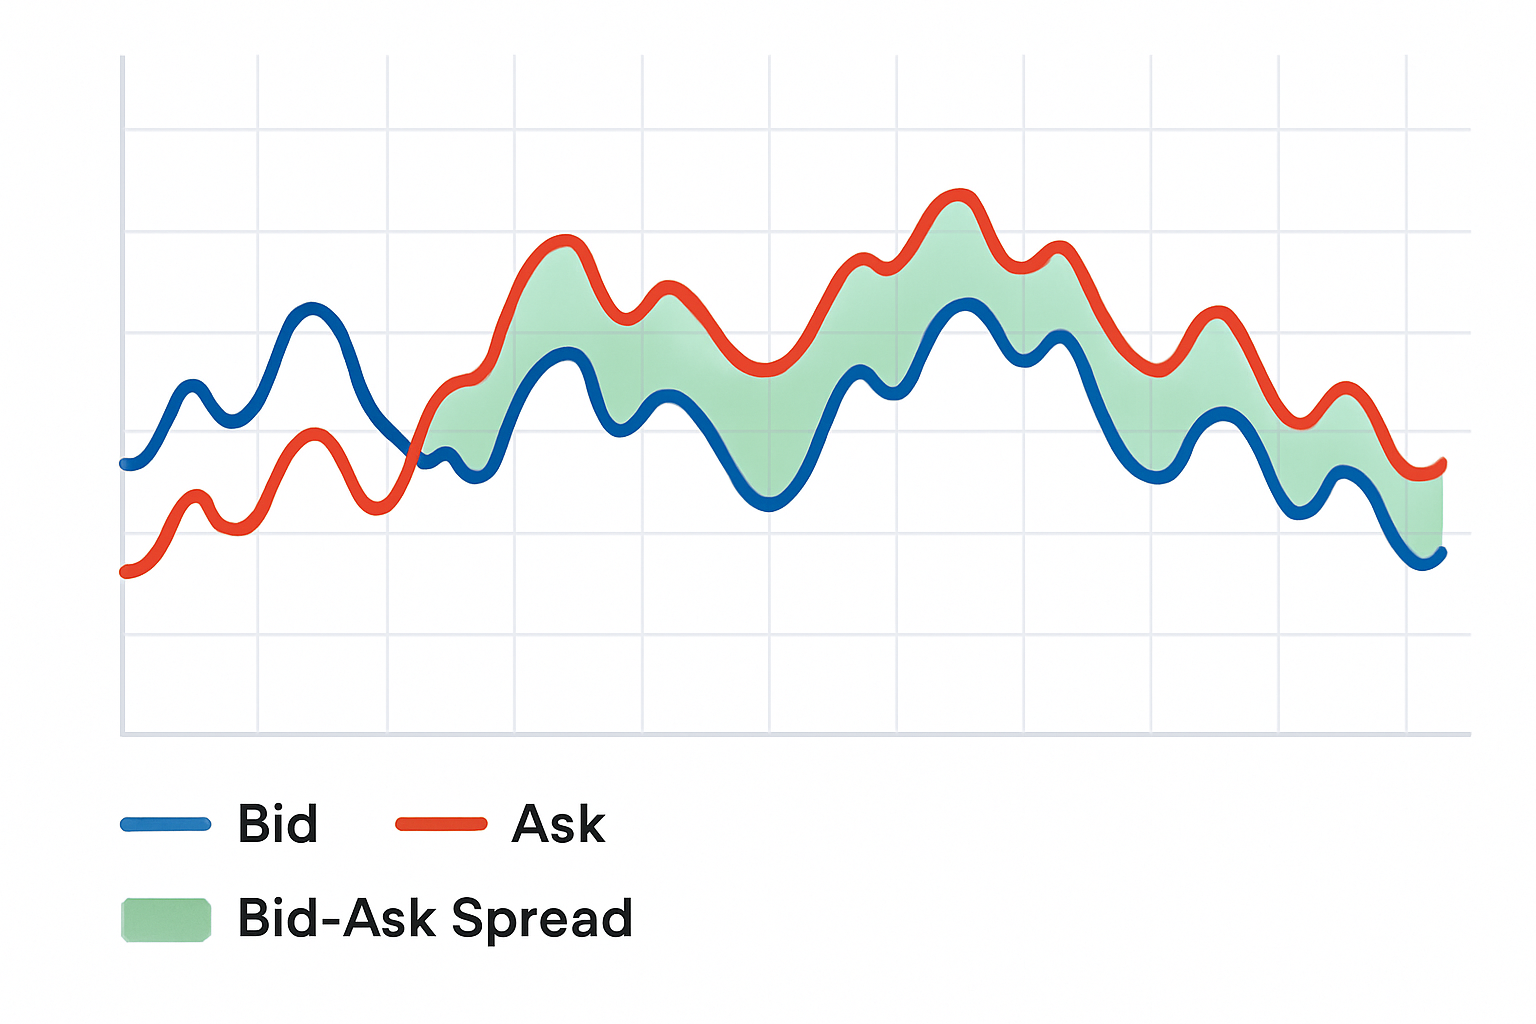
Visual representation of bid and ask rates, illustrating the spread between them over time.
The size of the spread tends to swing quite a bit depending on market and economic factors. Getting a handle on these can give traders a leg up when sizing up potential costs and spotting opportunities. Usually, spreads cozy up and get tighter when markets are humming along smoothly and liquidity is flowing. But they can loosen up and spread out during turbulent times or when trading slows to a crawl.
Market liquidity: When a market is bustling with plenty of buyers and sellers, you usually find those spreads getting nice and tight.
Trading volume: Heavily traded assets tend to boast narrower spreads, which is great news for keeping transaction costs down.
Volatility: If prices start doing a quick dance up and down, spreads tend to stretch out because market makers are juggling more risk.
Market maker competition: When more market makers jump into the ring, that friendly rivalry typically squeezes spreads lower.
Economic and news events: Sudden news or surprising economic data can make spreads shoot up quickly, as everybody scrambles to figure out what’s going on.
When markets are calm and steady, bid-ask spreads usually tighten up reflecting a smoother ride with more confidence and plenty of liquidity. On the flip side, during nail-biting moments like earnings announcements or geopolitical headaches and surprise economic data drops, spreads tend to balloon as traders scramble for bigger premiums to hedge against the extra risk.
The bid-ask spread tends to impact different market players in their own unique ways. Retail traders usually feel it as a straightforward cost whenever they open or close positions—kind of like a toll you pay each time. Day traders and high-frequency traders keep a hawk’s eye on spreads since they’re executing trades so rapidly and often—every penny counts in their world.
The bid-ask spread is like a tiny toll every trader ends up paying when jumping between buying and selling — a quiet little nudge that subtly tugs at the cost of every single trade.
Let us dive into how bid and ask rates pop up in the real world whether you are dealing with stocks, forex or cryptocurrencies. Getting a grip on these differences can shed light on how the spread influences your trading decisions and the costs you might face in various markets.
| Market | Bid Price | Ask Price | Spread | Trader's Decision Insight |
|---|---|---|---|---|
| Stock XYZ | $100.00 | $100.10 | $0.10 | Buying at $100.10 means you’re paying a tiny premium upfront. Sellers usually hold out for at least this price, so it’s kind of the going rate. |
| EUR/USD Forex | 1.1050 | 1.1052 | 0.0002 | Forex spreads are famously tight here, letting traders hop in and out without bleeding much cash on fees. |
| Bitcoin (BTC) | $30,000.00 | $30,100.00 | $100.00 | Crypto spreads can swing quite a bit, but working with big platforms like Binance tends to keep those costs in check. |
| Gold Commodity | $1,800.50 | $1,800.70 | $0.20 | Commodity spreads give you a glimpse into the market’s mood—volatile and risky, as the price difference usually shows. |
These examples nicely illustrate just how the link between bid and ask rates can really shape trading costs and give market dynamics a nudge.
Seasoned traders often have a few tricks to cut down costs that come with spreads and sometimes even turn those spreads to their advantage. By getting a solid feel for when spreads shift and the reasons behind those moves they can choose the smartest execution tactics and time their trades like pros.
Keeping an eye on the bid-ask spread during daily trading can really save you from sneaky extra costs and steer you toward smarter decisions. Tools like TradingView make it a breeze to spot spreads right alongside your favorite technical indicators.
There are a few common myths about the bid-ask spread that trip up traders more often than you would think. Some believe the spread is fixed or just noise that does not impact long-term investing. Others confuse the bid rate vs ask rate, mixing one for the other. Clearing up these confusions can help you make smarter and more confident trading and investing decisions.

Are you tired of juggling multiple tools for your trading needs? TradingView is the all-in-one platform that streamlines your analysis and decision-making.
With its powerful charting capabilities, real-time data, and vibrant community, TradingView empowers traders like you to stay ahead of the market. Join thousands who trust TradingView for their trading success.

19 posts written
Discover the bullish harami candlestick pattern—a key technical signal that can hint at trend revers...

Master the hammer candlestick pattern—a key indicator for market reversals. This beginner-friendly g...

Discover the doji candlestick—a powerful price action signal revealing market indecision. This begin...

Learn how the harami candlestick pattern signals potential market reversals. This guide breaks down...