


Technical Analysis
IOU Meaning in Finance
Discover what IOUs mean in finance, their role as informal debt acknowledgments, and how understandi...

The ADX indicator plays a pretty important role in technical analysis by helping traders get a solid read on whether the market is trending or just drifting sideways.
The Average Directional Index (ADX) was cooked up by J. Welles Wilder Jr. back in the late 1970s with a pretty neat goal in mind: to gauge just how strong a trend really is, no matter if it is heading up or down. Rather than playing the guessing game on direction, ADX focuses on the sheer muscle behind the moves—whether they are climbing or falling—which makes it super handy for giving trends a solid thumbs-up.
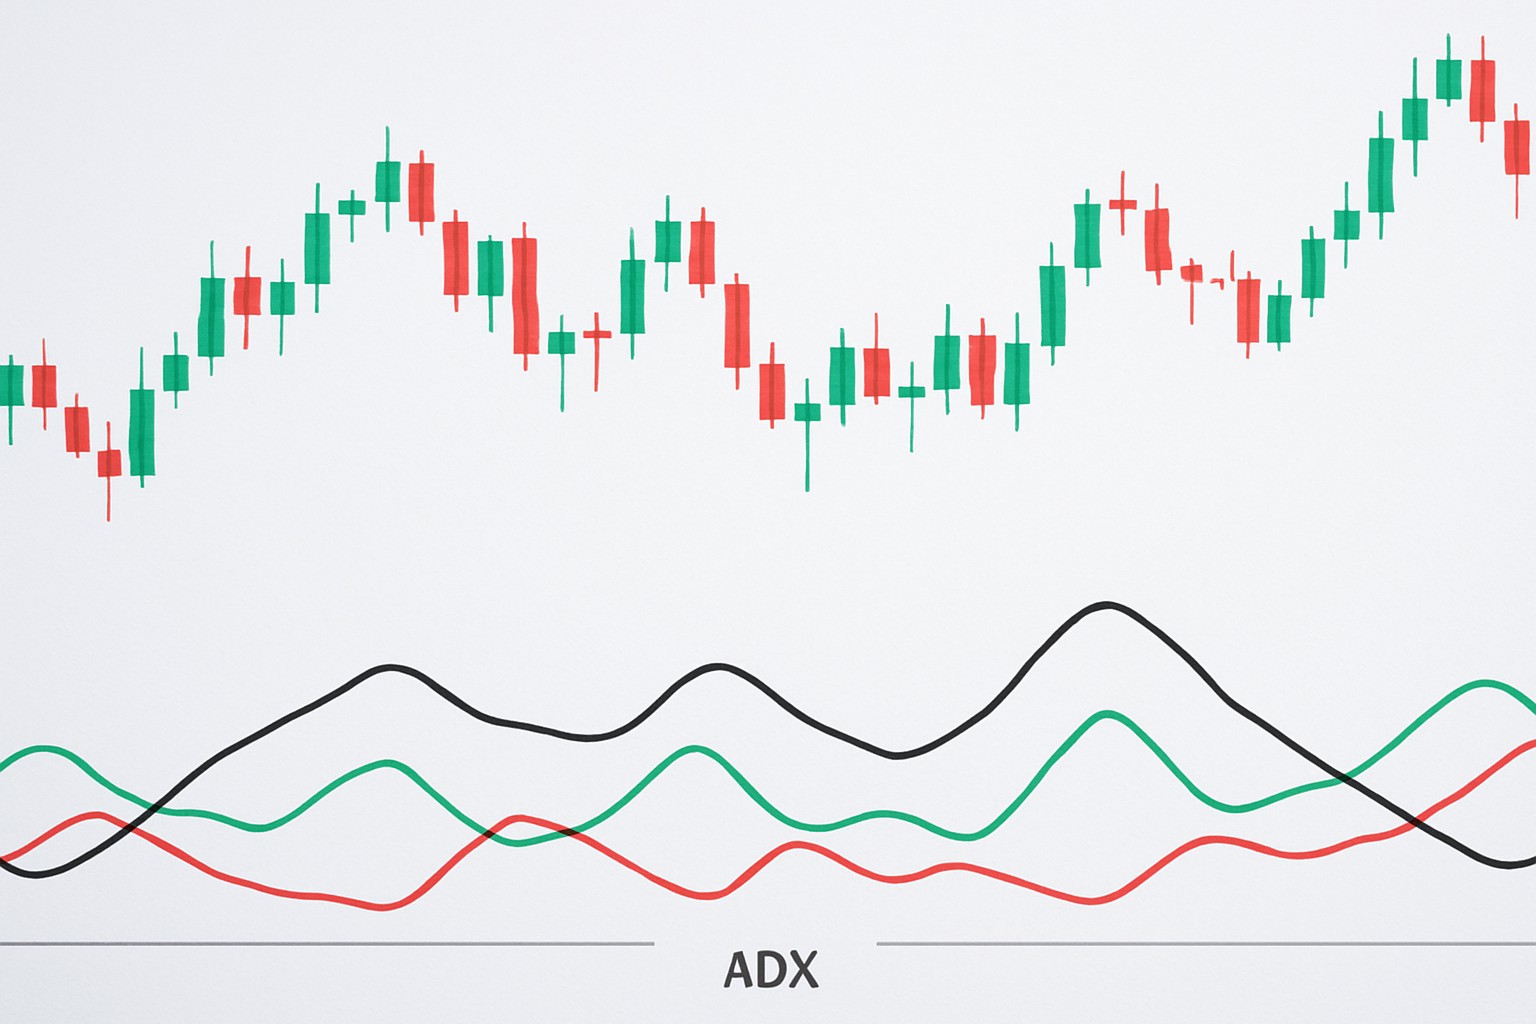
The ADX gauges how strong a trend really is by smoothing the difference between the positive directional indicator +DI and the negative directional indicator -DI. Think of the +DI as the tracker of upward price moves showing how much bulls are flexing. The -DI keeps an eye on the downward movement giving a nod to the bears. The ADX line is created by smoothing the absolute difference between these two figures. It reveals the underlying momentum behind price shifts no matter which side of the fence they fall on.
| Step | Calculation / Explanation |
|---|---|
| 1. Calculate True Range | Find the largest value among (High minus Low), (High minus Previous Close), and (Previous Close minus Low) — essentially capturing the full price swing for the day |
| 2. Compute +DM and -DM | +DM is the Current High minus Previous High, but only if it’s positive and bigger than -DM; similarly, -DM is the Previous Low minus Current Low, taken if positive and larger than +DM. It’s a bit like deciding who’s winning the directional tug-of-war |
| 3. Smooth values | Apply Wilder's smoothing method over your chosen period, usually |
14 It’s a clever way to keep things steady without losing the bigger picture |
Think of it as the intensity meter for directional movement |
Understanding ADX values is important for making smart trading decisions. Generally, when values dip below 20 it’s a sign the market is drifting sideways or lacks clear direction so price movements don’t pack much strength. Once the ADX enters the 20 to 40 range the market usually starts to trend with decent muscle behind it. If values exceed 40 strong trends are in play and price moves tend to be more decisive, cutting through noise like a hot knife through butter.
Using the ADX well means looking beyond just the ADX line itself. You have to keep an eye on how its components play off each other to figure out if the market is really trending or just meandering sideways.
When values rise above 25, it usually means a trend is starting. On the other hand, anything below 20 often indicates the trend is not strong enough to pay much attention to.
If +DI is positioned higher than -DI, the market is likely in an uptrend. If the situation is reversed and -DI is ahead, a downtrend is probably underway.
This confirms that momentum is really building up.
Be cautious if you rely only on the ADX when it is low or flatlining. During those quiet sideways market phases, it can sometimes give false signals. Experienced traders have seen this happen.
The key is to find the right balance between spotting genuine moves and ignoring the noisy chatter.
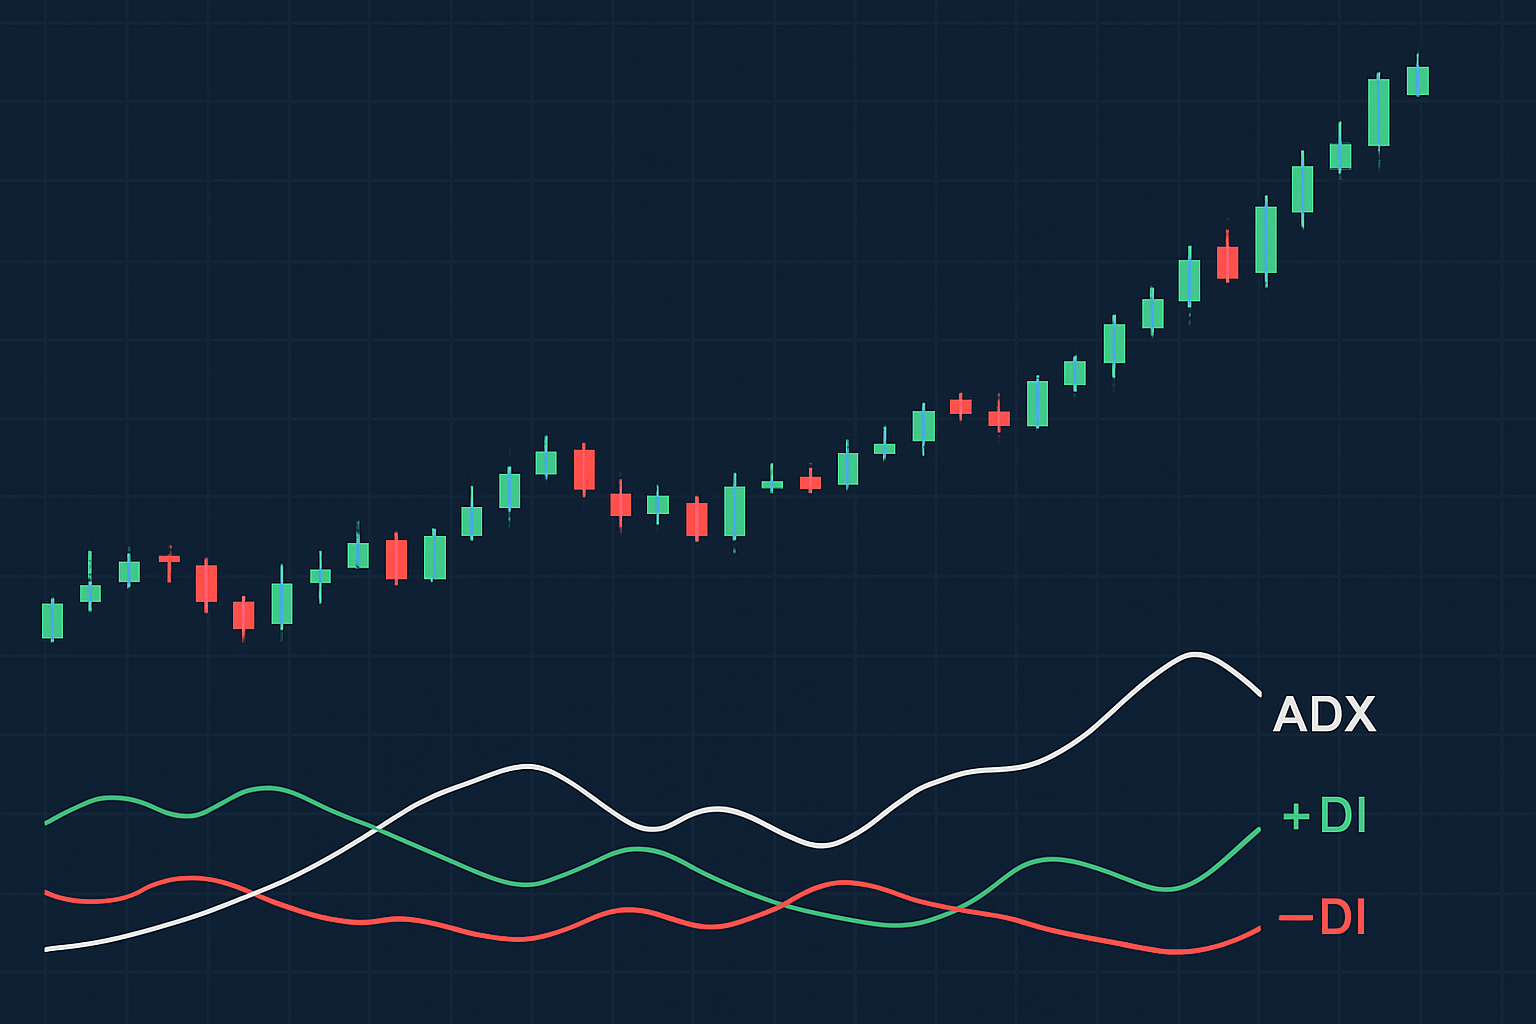
Illustration of ADX indicator applied on a price chart showing trend identification using DI+ and DI- lines.
Traders often keep a close eye on specific ADX threshold levels to gauge when the market has enough momentum to make trend-following strategies worthwhile. Nailing these thresholds can be a bit of an art but when done right it helps cut through the noise and avoid false signals.
Using the ADX indicator works best when you team it up with solid reliable trading strategies. Tweak the settings to match your style and keep a close eye on how the market behaves at any moment.
Traders often lean on the ADX along with familiar indicators like moving averages and RSI or MACD to beef up the reliability of their signals.
The ADX indicator is a go-to tool in forex, stocks and commodities markets when it comes to spotting trending phases that often lead to juicy profit opportunities.
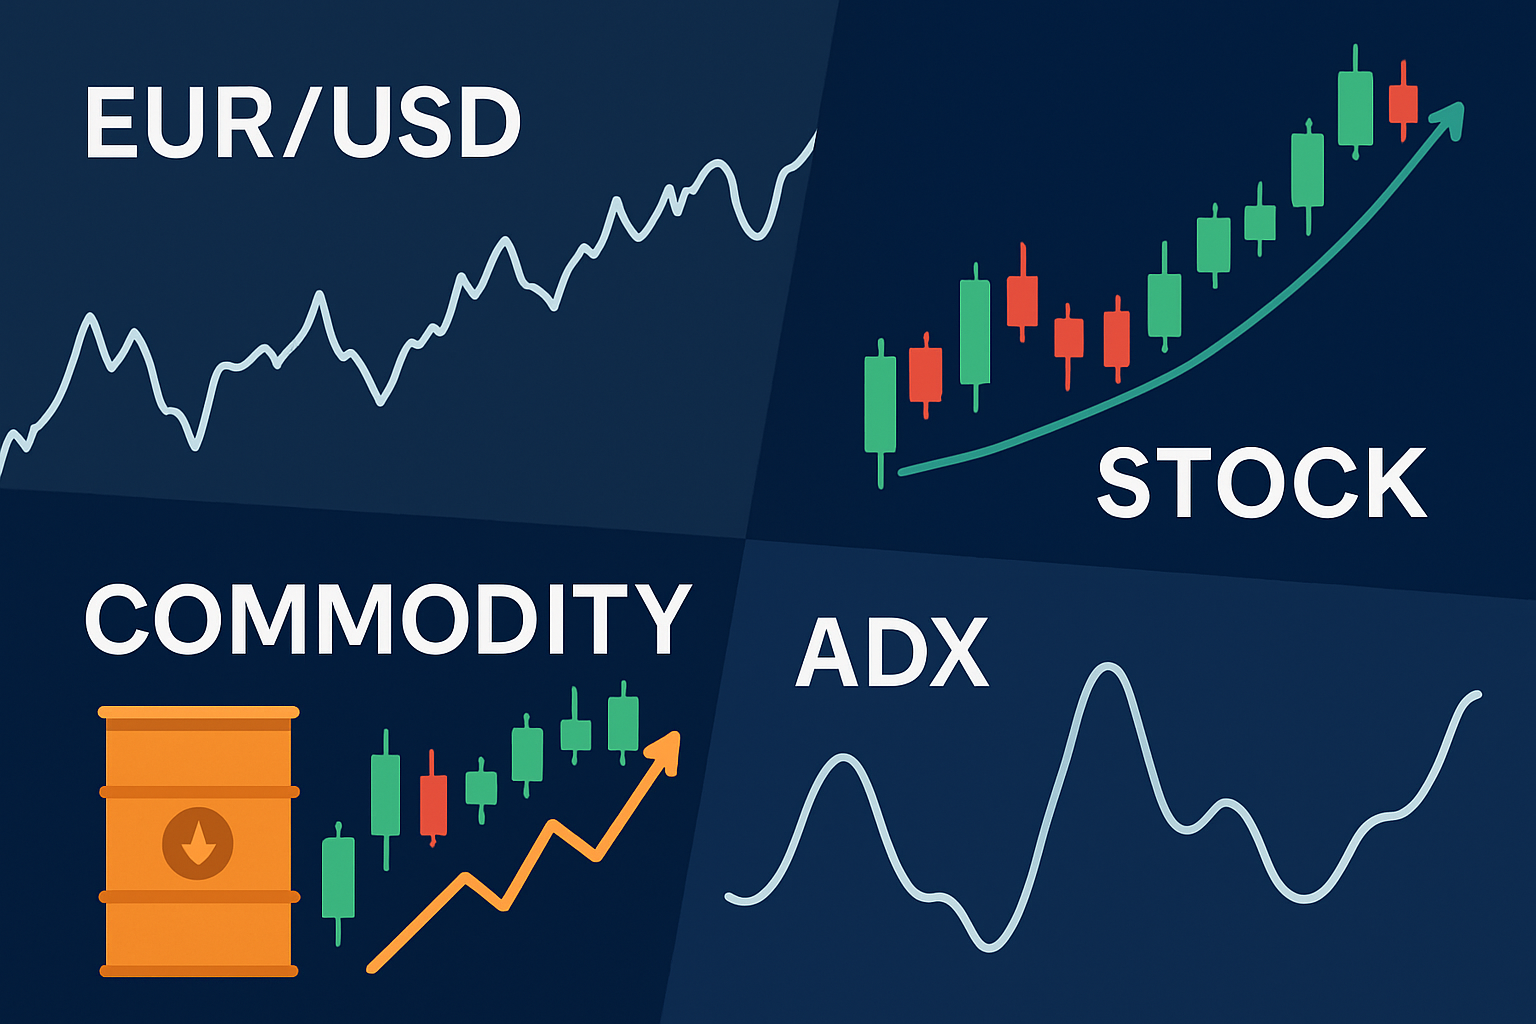
Composite image showing ADX usage across various markets including forex, stock, and commodities.
You’ll often spot a strong uptrend once the ADX pushes above 30 and the +DI sneaks past the -DI. Jumping into the trade as the ADX climbs lets you ride the momentum wave, and keeping a close watch on these indicators can really help you handle stop losses and trail profits a bit more smoothly.
A stock that was initially drifting sideways showed ADX readings below 20 signaling there wasn’t much of a trend. Then the ADX climbed above 25 and past 40 while the +DI crossed over the -DI, confirming a strong uptrend. Traders who caught this signal could comfortably step in and hold their positions, tweaking stops as the trend unfolded.
ADX is a handy tool but it does have its quirks. It can lag a bit due to smoothing and occasionally throw out false signals when the market is volatile. By itself it won’t tell you which way the trend is headed.
"The ADX usually shines brightest as a trusty sidekick rather than a solo act. When you pair it thoughtfully with other indicators and price action, it can really help tighten up your trading calls—kind of like adding that secret sauce everyone talks about." — Professional Technical Analyst
Adding the ADX indicator on popular platforms like MetaTrader and TradingView is actually quite straightforward. Traders can tweak the indicator’s settings to suit various market moods or their own unique trading style.
Pick the chart and timeframe that suit your trading groove.
Head over to the platform's list of indicators or studies—it's your toolkit.
Search for "ADX" or "Average Directional Index" and add it to your chart.
The default 14-period setting works well but you can tweak it to catch every move.
Play with the display colors for the ADX, +DI and -DI lines so they pop and you don’t squint.
Finally, dive into interpreting those signals with price action and your favorite indicators.

Are you tired of juggling multiple tools for your trading needs? TradingView is the all-in-one platform that streamlines your analysis and decision-making.
With its powerful charting capabilities, real-time data, and vibrant community, TradingView empowers traders like you to stay ahead of the market. Join thousands who trust TradingView for their trading success.

17 posts written
Discover what IOUs mean in finance, their role as informal debt acknowledgments, and how understandi...

Unlock the power of candle patterns to decode market psychology and improve your trading precision....

Unlock the power of the bear flag pattern with our practical, step-by-step guide. Understand market...

Discover the doji candlestick—a powerful price action signal revealing market indecision. This begin...