IOU Meaning in Finance
Discover what IOUs mean in finance, their role as informal debt acknowledgments, and how understandi...

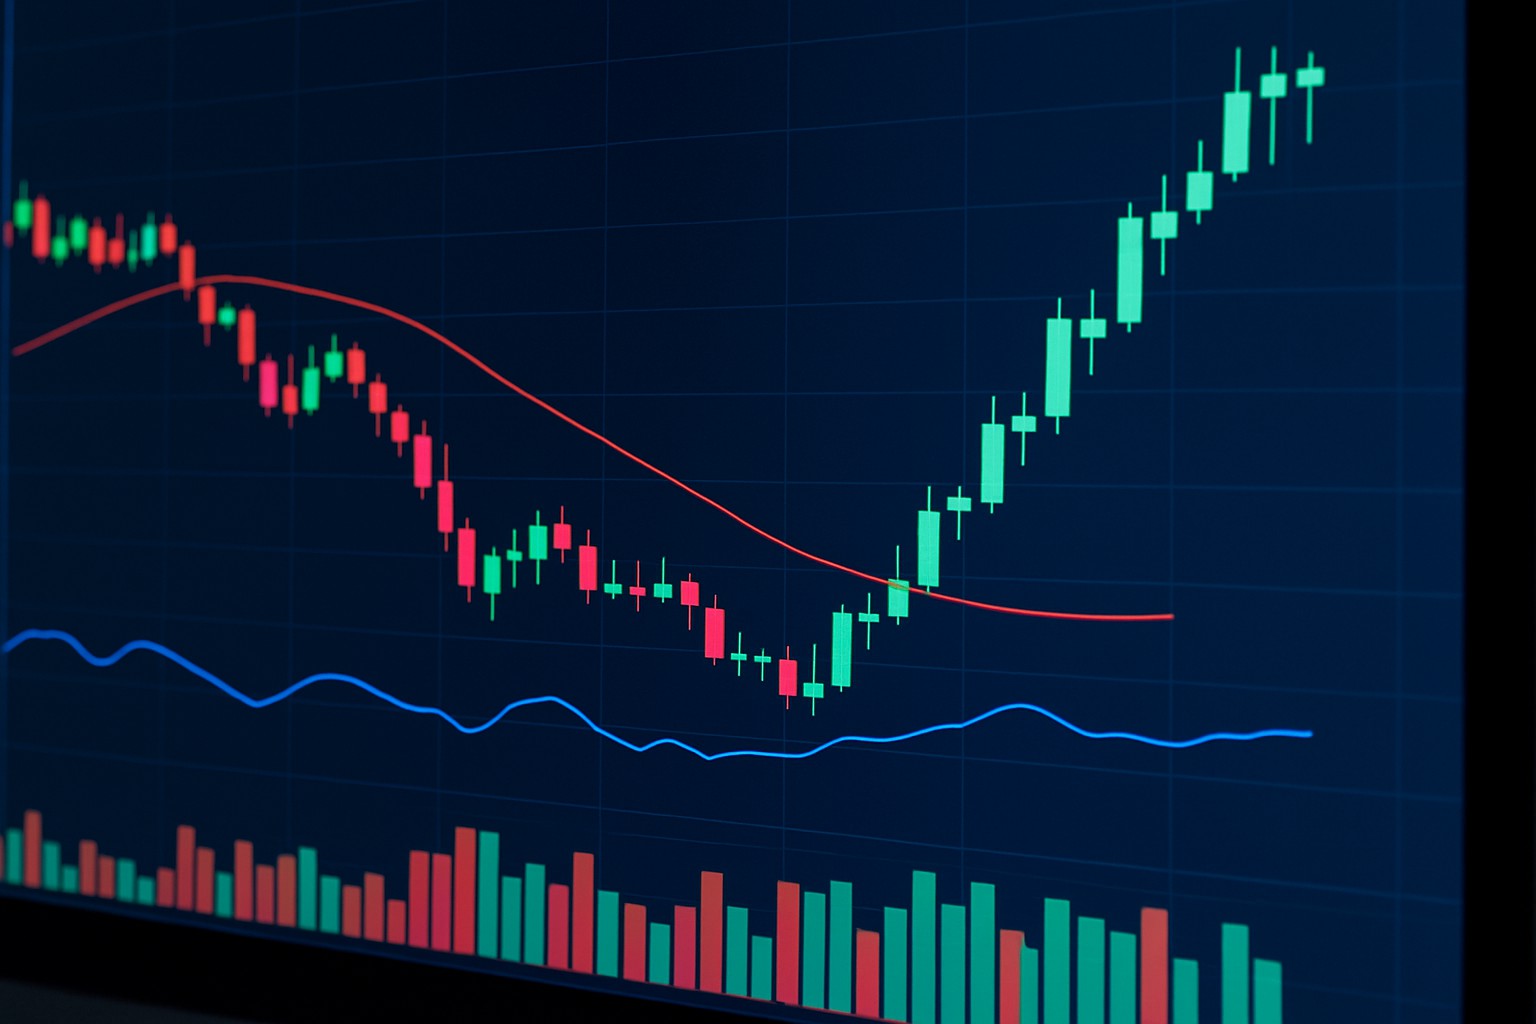
The three white soldiers candlestick pattern is a well-known staple in technical analysis and a clear sign of strong buying momentum in the markets. It is made up of three consecutive long-bodied bullish candles that show sellers handing over the reins to eager buyers. Many traders watch for this pattern after a rough patch like a downtrend or a lull in the action to catch promising buying opportunities.
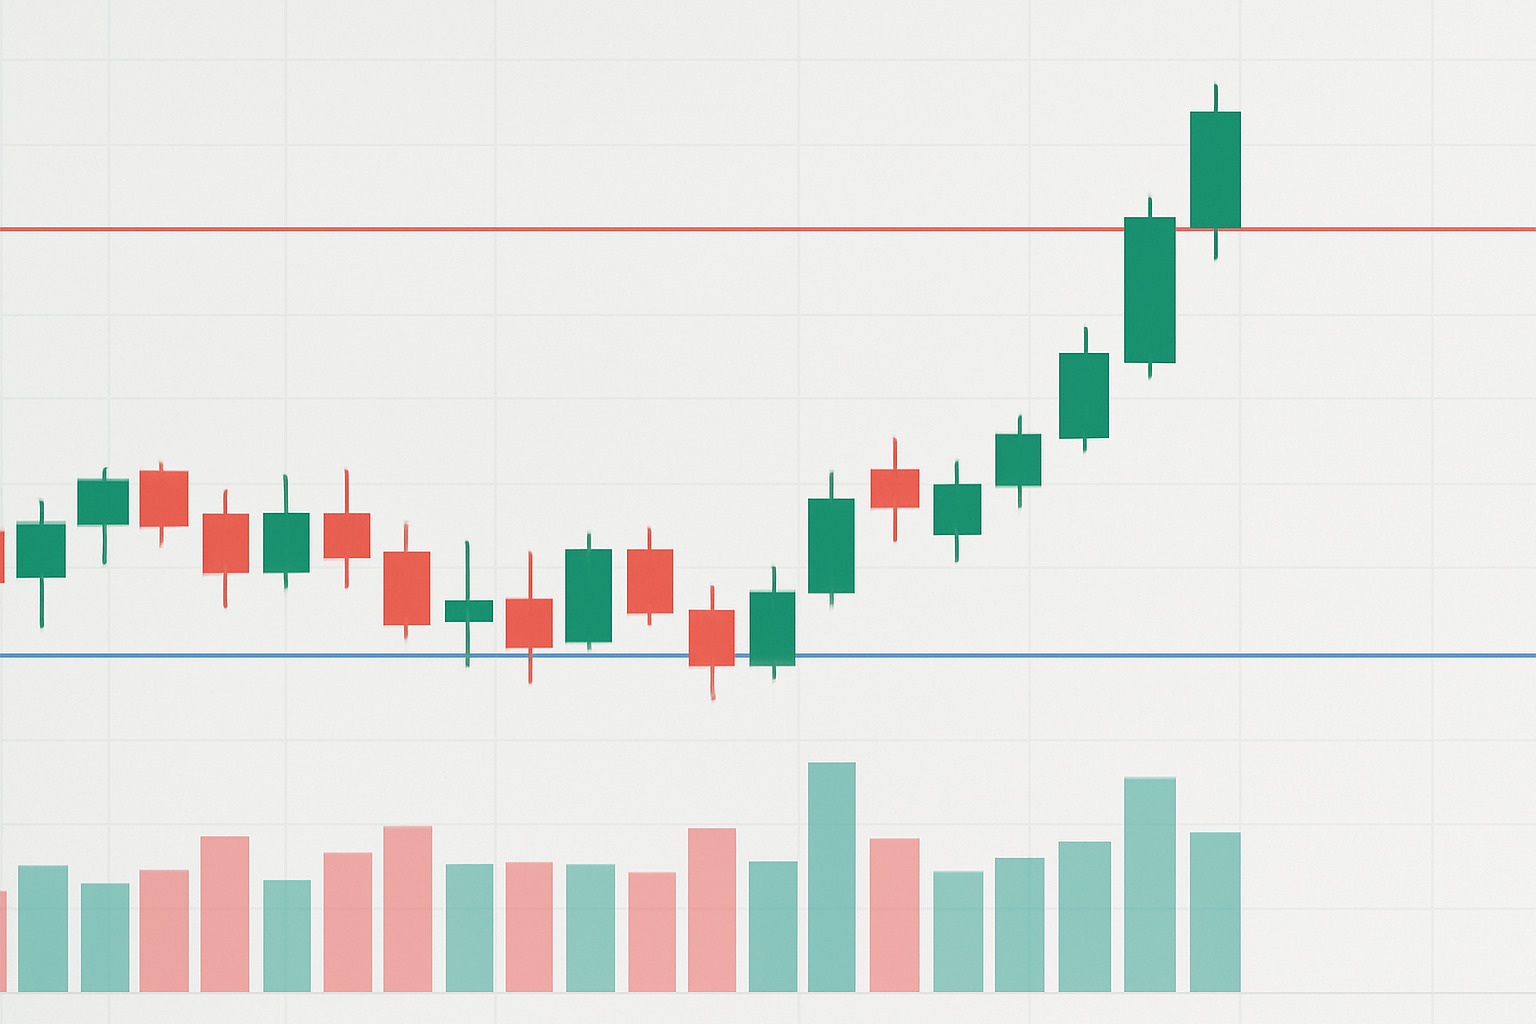
The three white soldiers pattern shows up when three bullish candlesticks make a neat little appearance one after another, each boasting a long body that pretty much screams strong price gains. Each candle opens somewhere inside the previous candle’s body—often around the middle—and then closes near its high, like it’s barely letting up. This setup hints at steady buying pressure and not much selling, often pointing to a confident kickoff or a solid continuation of an uptrend in the market.
It’s important to really nail down the difference between the three white soldiers pattern and your everyday bullish continuations or just random green candles popping up. This pattern isn’t your run-of-the-mill bullish engulfing or a simple steady climb.
The psychology behind the three white soldiers pattern boils down to buyers stepping up to the plate and steadily growing more confident in the market. Over three consecutive sessions, these buyers push prices higher with hardly a hiccup or major pullback in sight. This shift in sentiment is a clear sign that buyers are starting to take the reins from sellers, and it often marks the turning point—the curtain call—of a downtrend or a lull in the market. Many traders swear by this pattern as a pretty reliable hint that a trend reversal is happening or that bullish momentum is quietly but surely gaining steam. Catching this pattern early can seriously boost your chances of jumping in before prices really start to run.
The three white soldiers pattern signals a solid and steady climb in prices over several days, often a sign that the bulls are really flexing their muscles and gaining momentum.
Keep an eye out for three bullish candlesticks lined up one after the other each closing a bit higher than the last like a little staircase climbing up.
Make sure each candle opens inside the previous candle’s body, ideally near the middle. This usually hints at steady confident buying rather than a wild swing.
Shadows or wicks on these candles are short or barely there. This tells you prices stuck close to their highs without much hesitation.
Check the trading volume during this pattern. When volume is picking up the signal tends to carry extra weight.
Put this pattern into context by looking back at the earlier trend or if the price was consolidating. This helps confirm you’re seeing a reasonable spot for a reversal or breakout rather than just a random blip.
Cut down on false positives by keeping an eye on the bigger market picture. Think nearby support and resistance zones, the broader trend and any sudden volume spikes that might catch your eye. When you catch the pattern close to key support levels or after a drawn-out downtrend the signals usually pack more punch and feel more trustworthy.

Illustration of the three white soldiers candlestick pattern on a stock chart, highlighting consecutive bullish candles and confirming volume.
Traders often lean on the three white soldiers pattern when timing their entries into buy positions, trying to keep risk as low as reasonably possible. They jump in near the close of the third candle, hoping to ride that early burst of momentum. Stop-loss orders are usually tucked just below the low of the first candle in the pattern, a handy way to keep potential losses in check.
After a long stretch of falling prices in the crypto market, spotting the three white soldiers pattern on Binance's spot trading charts often signals a likely recovery just around the corner. When this pattern pops up alongside rising volume and favorable RSI readings, it usually gives a nice little confidence boost for buying decisions and helps nail better timing.
The three white soldiers pattern is generally reliable but like most things in trading it’s not foolproof and can stumble under certain market conditions. Its punch tends to fade when prices get overbought and stretched to the limit and often results in sudden jaw-dropping reversals. It’s also known to throw up false alarms in assets that are either wildly volatile or thinly traded where a quick price jump might just be noise rather than a real shift in trend.
Sound risk management is absolutely key when dealing with the three white soldiers pattern. Traders often lean on platforms like Edgewonk to keep a sharp eye on their trade performance and manage risk exposure, which really helps fine-tune those all-important entry and exit points. On top of that, combining this candlestick signal with other technical tools usually offers stronger confirmation and helps chop down on those pesky false signals.
Traders often like to back up the reliability of the three white soldiers pattern by pairing it with other candlestick patterns and technical indicators. These extra tools usually help confirm whether the bullish signal is genuinely strong and likely to stick around.
Struggling to improve your trading performance? Edgewonk's advanced analytics tools are designed to give you the edge you need.
With detailed trade journaling, robust strategy analysis, and psychological insights, you'll gain a comprehensive understanding of your strengths and weaknesses. Don't miss out on this game-changing opportunity.
Traders, it's time to elevate your game. Edgewonk is the ultimate trading journal software designed to empower you with data-driven insights and personalized strategies. Take control of your trading journey and maximize your potential.
14 posts written
Born in a family of traders, Emily Leroux combines inherited wisdom with modern approaches, seamlessly bridging the gap between traditional and innovative trading methodologies.
Read Articles
Discover what IOUs mean in finance, their role as informal debt acknowledgments, and how understandi...

Unlock the power of candle patterns to decode market psychology and improve your trading precision....

Learn how the harami candlestick pattern signals potential market reversals. This guide breaks down...

Discover the doji candlestick—a powerful price action signal revealing market indecision. This begin...
