


Technical Analysis
Master the Bear Flag Setup
Unlock the power of the bear flag pattern with our practical, step-by-step guide. Understand market...


Candlestick patterns are essential tools in technical analysis giving us a peek behind the curtain to understand market sentiment and suggesting where prices might be headed next. The 3 white soldiers pattern in particular tends to stand out as a pretty reliable indicator of a bullish market turnaround providing traders with some well-needed insight into possible upward moves.
Think of a series of pictures snapping a stock’s price moves each day. Candlestick charts do exactly that each candle lays out how the price danced over a specific stretch of time.
Candlesticks typically signal a bullish trend when the closing price sneaks above the opening price, and a bearish one when it slips below it.
The 3 white soldiers pattern is a bullish candlestick formation made up of three consecutive long green or white candles. It’s often seen as a sign of strong upward momentum, typically popping up after a downtrend or a phase of sideways movement.

Illustration of the 3 white soldiers candlestick pattern with three consecutive bullish candles
You’ll often notice this pattern popping up across different markets whether it’s stocks, forex or cryptocurrencies. It doesn’t discriminate by timeframe—you might catch it on daily charts or even hourly ones. This makes it handy for both quick-draw day traders and slow-and-steady long-term investors.
When the 3 white soldiers make their grand entrance, it is usually a solid sign of a bullish reversal or a continuation of the upward trend. This pattern shines a spotlight on strong buying pressure and often signals a mood swing from bearish gloom to bullish optimism.
Traders often lean on this pattern to time their entries for long positions, hoping the upward momentum will stick around for the short to medium term.
The 3 white soldiers pattern features three sturdy candles striding upward, each one nudging the price higher with clear intent and muscle, signaling a steady and confident shift toward bullish momentum.
Confirmation really steps into the spotlight when it comes to avoiding pesky false signals. Traders usually keep an eye out for volume spikes and mull over the bigger picture with the overall trend. They also lean on trusty sidekicks like the RSI or MACD to back up the bullish vibes that the 3 white soldiers give off.
One classic slip-up is mixing up a flimsy trio of green candles during a strong market rally with the sturdier 3 white soldiers pattern. To dodge those pesky false signals, aim for candles that stand tall with just a hint of wick. It’s also a smart move to double-check whether the volume’s got the muscle to back up the momentum.
Examining real market examples can really shine a light on just how powerful this pattern tends to be. Take for instance when a stock’s price takes a tumble and then you spot 3 white soldiers marching across the daily chart—it’s often a pretty solid sign that a strong upward rally is just around the corner.
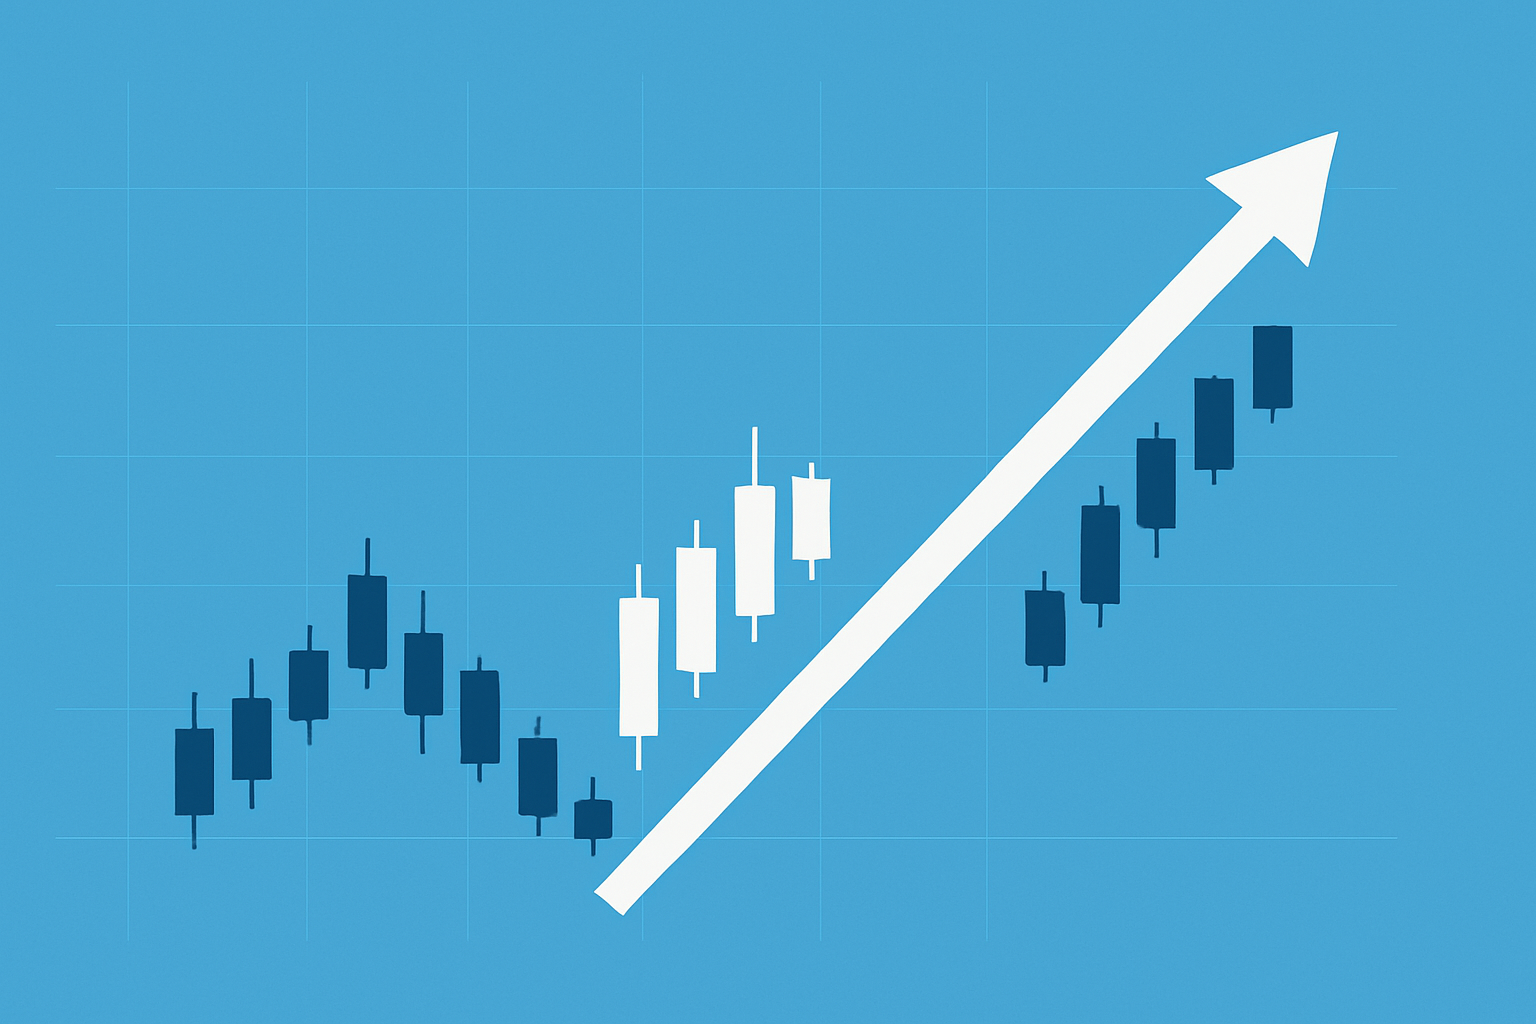
Example of the 3 white soldiers pattern on a stock chart leading to a price increase
A technology stock lit up the charts with three consecutive long green candles. Each opened snugly within the previous body and closed a bit higher than the last. Volume did not just rise—it practically soared alongside these candles while the RSI pushed past the 50 mark, quietly shouting that momentum was building.
The 3 white soldiers pattern is often seen as a solid indicator but it’s far from a sure bet. It can throw off false signals now and then, especially when the market’s feeling volatile or caught up in behind-the-scenes maneuvering. Unexpected events or sudden shifts in sentiment have a knack for steamrolling over what the pattern might be hinting at.
To really squeeze the best insights from the 3 white soldiers pattern, it’s wise to slot it into a broader trading game plan that juggles risk management and other technical indicators along with solid fundamental analysis.
Traders usually squeeze the most juice out of the 3 white soldiers pattern when they team it up with other trusty tools like trendlines and moving averages. They also use support and resistance levels and oscillators. This layered approach acts like a filter for all the market noise and helps to double-check how solid those bullish signals really are.
Platforms such as TradingView offer some seriously robust charting tools and a whole bunch of indicators that make it a breeze to mix and match different elements. Thanks to features like multiple overlays and custom scripts, traders can really tailor their analysis to get a better grip on the strength of the 3 white soldiers pattern.

Are you tired of juggling multiple tools for your trading needs? TradingView is the all-in-one platform that streamlines your analysis and decision-making.
With its powerful charting capabilities, real-time data, and vibrant community, TradingView empowers traders like you to stay ahead of the market. Join thousands who trust TradingView for their trading success.

16 posts written
Unlock the power of the bear flag pattern with our practical, step-by-step guide. Understand market...

Learn how the harami candlestick pattern signals potential market reversals. This guide breaks down...

Master the hammer candlestick pattern—a key indicator for market reversals. This beginner-friendly g...

Unlock the power of the head and shoulders pattern with this complete guide. Learn to spot, trade, a...