


Technical Analysis
Understanding the Bullish Harami Candlestick Pattern
Discover the bullish harami candlestick pattern—a key technical signal that can hint at trend revers...

The morning star candle pattern is a cornerstone in price action trading, often signaling a bullish reversal after a downtrend has run its course. This little pattern usually pops up when selling pressure starts to take a breather, giving the bulls a chance to step back in and move the market higher.
This article dives into what a morning star candle really signals and shows you how to spot it clearly on price charts without guesswork. It uncovers the psychology behind its bullish vibe and walks you through practical ways traders lean on it in their strategies across various markets and timeframes.
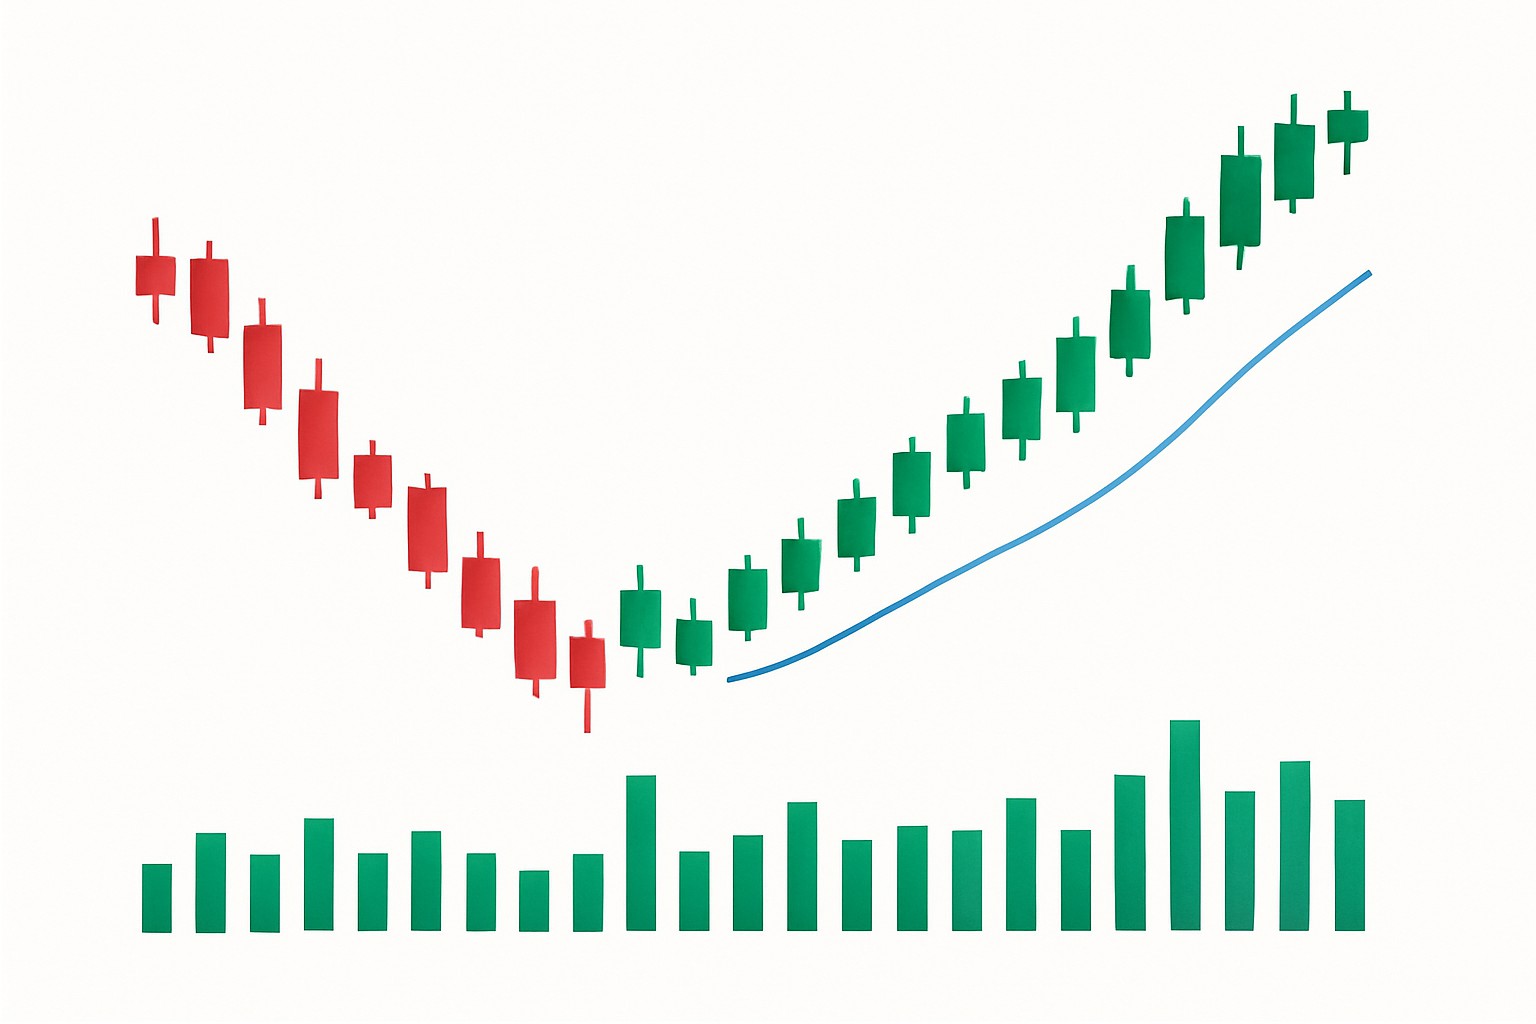
A morning star candle is a pattern made up of three candles you’ll often spot on candlestick charts. It’s generally a sign that the market mood might be shifting from bearish gloom to bullish optimism. Each candle plays its part in flagging this potential turnaround.
Picture this sequence as a story unfolding before your eyes: the market kicks off with intense selling like a dark cloud stubbornly hanging overhead. Then things settle down as traders catch their breath and take stock, kind of like the stillness of a calm dawn. At last, buyers step onto the stage and brighten the whole scene much like a sunrise breaking through the gloom.
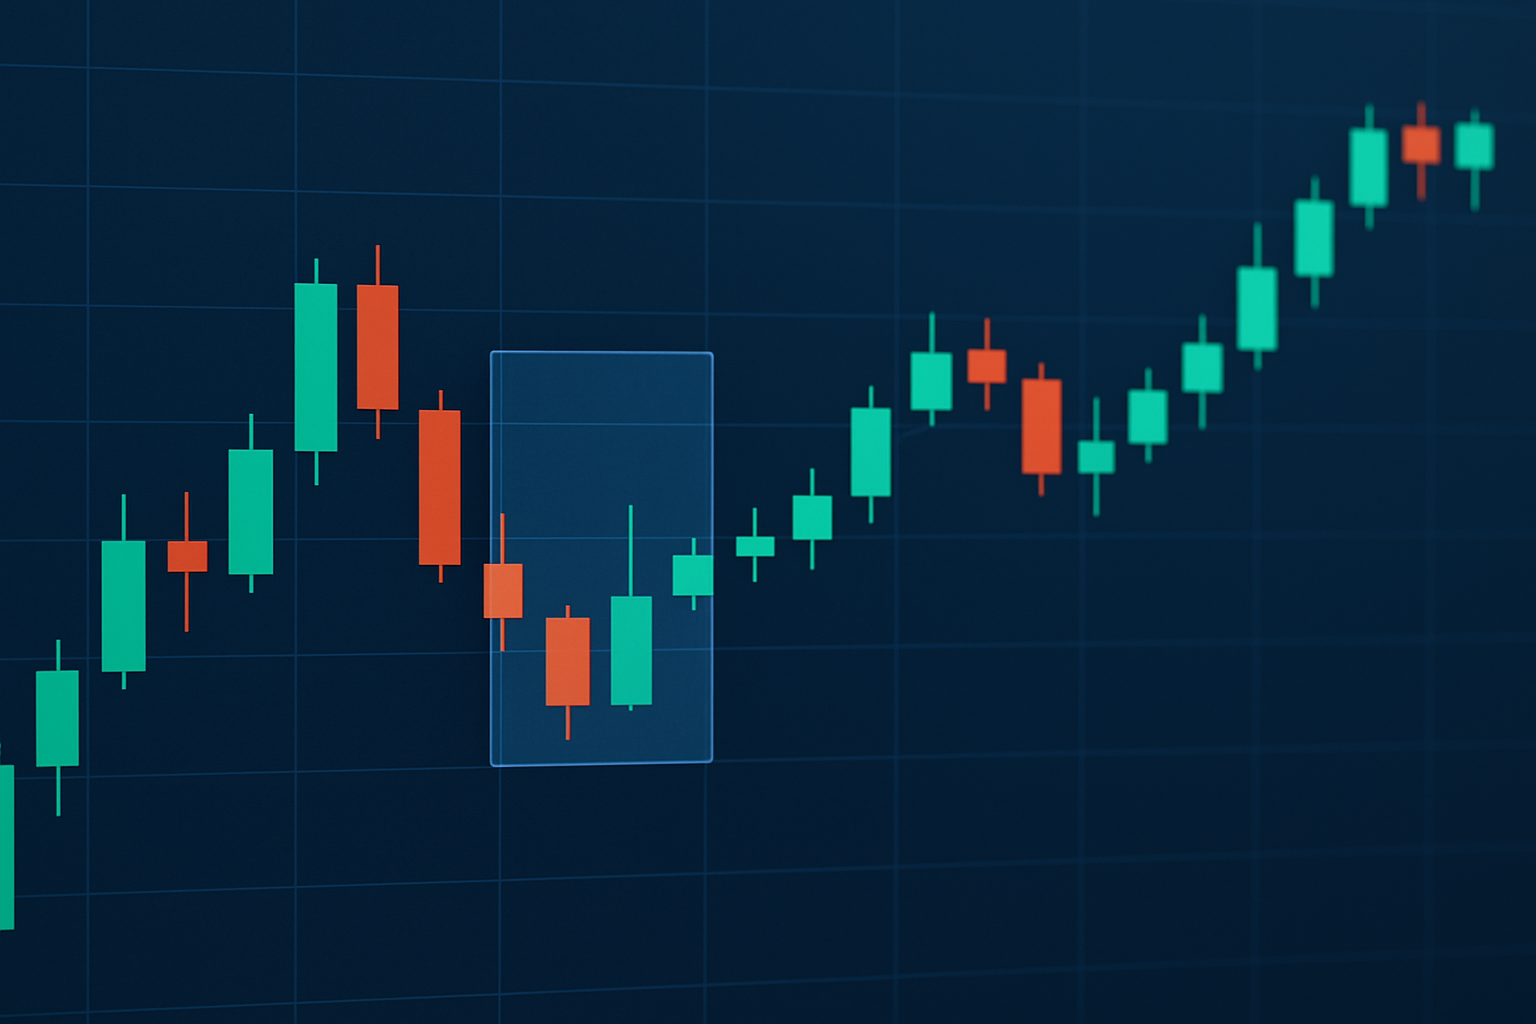
Illustration of the morning star candle pattern showing the three distinct candles and their price action implications.
To really get why the morning star candle holds such weight, it’s helpful to wrap your head around price action. Basically, keep an eye on how prices move on a chart over time without leaning on any fancy indicators.
Breaking down these terms gives beginners a handy starting point to track price movements with a bit more confidence. The morning star candle plays a key role in this approach and often pops out as a neat visual cue that a downtrend might be running out of gas.
The morning star candle paints a vivid picture of shifting trader sentiment. That first bearish candle is the sellers flexing their muscles and clearly calling the shots. Then the second candle appears, throwing a curveball as hesitation creeps in while the market takes a moment to catch its breath.
Volume really pulls its weight here. When volume jumps above average on the third candle it tends to back up the bullish reversal signal nicely. Conversely, if the volume is dragging its feet the signal might be a bit weak.
The morning star pattern often feels like that first glimmer of dawn after a bit of a cloudy spell, the moment when hesitation finally gives way and traders begin to catch a whiff of prices climbing higher.
Spotting a morning star candle calls for a keen eye and some patience—it's all about reading the context just right. Traders really have to make sure the pattern ticks off every key box.
Spot a sizable bearish candle that screams strong selling momentum.
The second candle should have a small real body or look like a doji. This usually hints at market indecision and the calm before the storm.
The third candle should come bursting in as a big bullish candle closing well above the midpoint of that first bearish candle's body. Talk about a turnaround.
Make sure this pattern shows up after a clear downtrend. If possible, it should be backed by higher volume, which seals the deal by confirming buyers are stepping up their game.
One common slip-up is confusing the morning star candle with other small-bodied candle patterns, or the ones that lack that key bullish close to seal the deal. New traders often overlook volume or forget to consider the bigger trend picture, which can throw a wrench into the reliability of their signals.
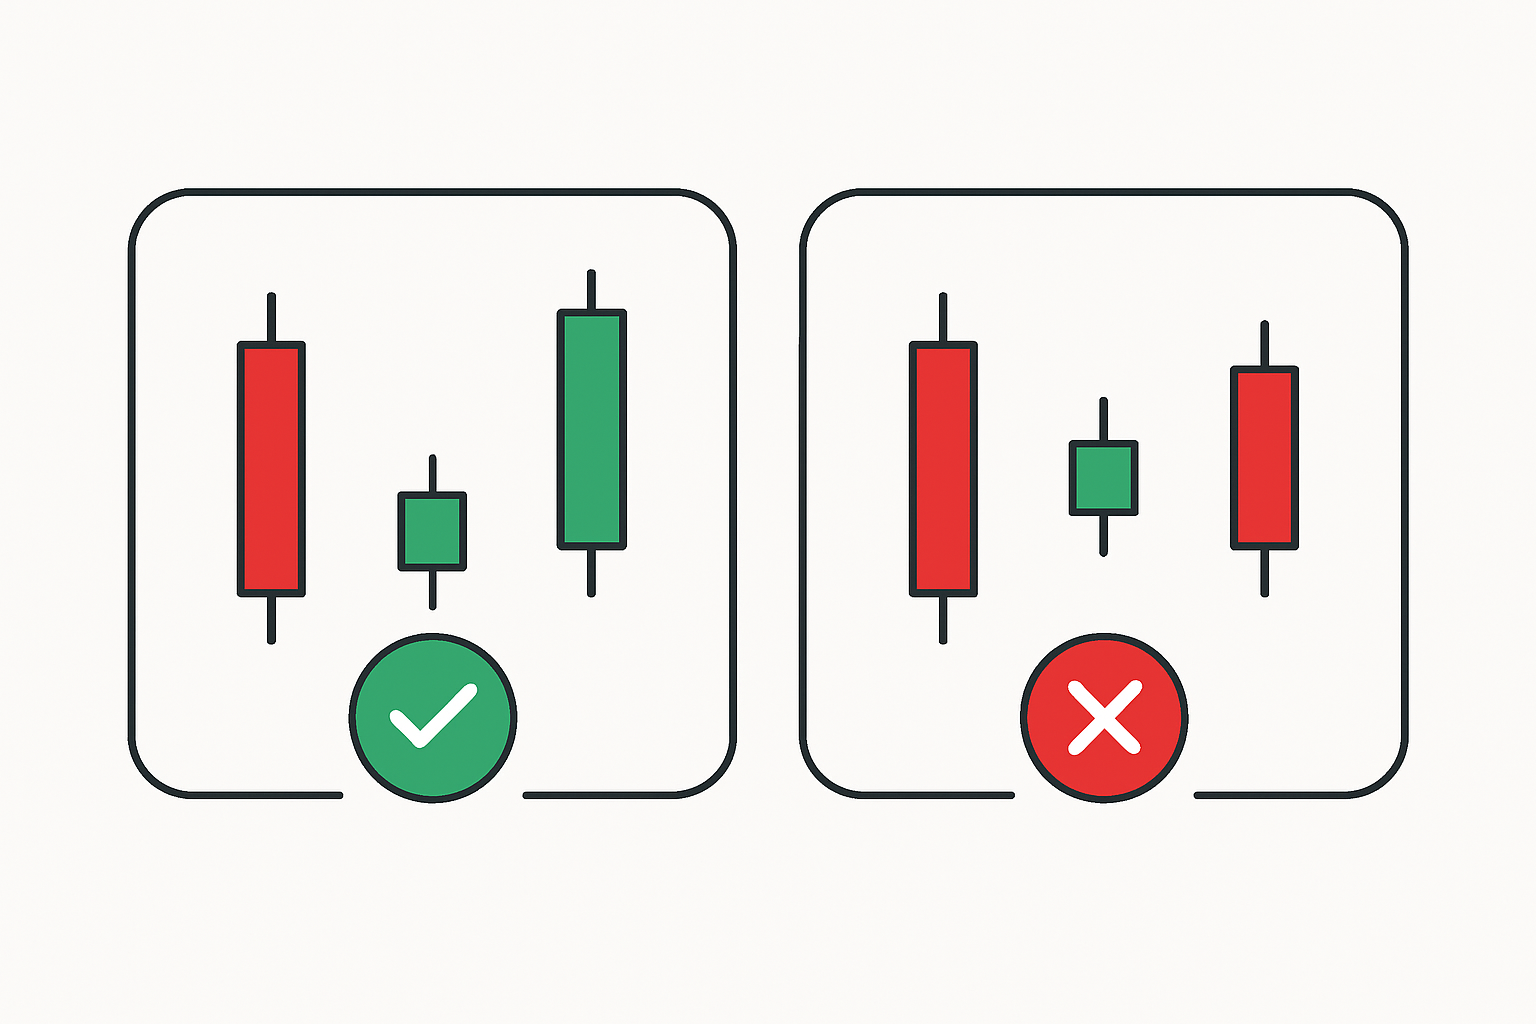
Visual guide showing correct morning star candle identification versus common mistakes to avoid.
It really helps to glance at the morning star candle alongside other bullish reversal patterns like the evening star, hammer and bullish engulfing candles.
| Pattern Name | Candle Count | Formation Characteristics | Typical Market Context | Reliability Level |
|---|---|---|---|---|
| Morning Star | 3 | Kicks off with a hefty bearish candle, followed by a tiny candle that leaves you guessing, then wraps up with a strong bullish close | Usually pops up during downtrends and hints at a bullish turnaround | High |
| Evening Star | 3 | Starts strong with a big bullish candle, then a small indecisive one, and finishes with a solid bearish close | Often spotted in uptrends, signaling a bearish reversal ahead | High |
| Hammer | 1 | Sports a small body and a long lower wick, generally bullish if it shows up after a downtrend | Shows up after downtrends and suggests the market is shying away from lower prices | Moderate to high |
| Bullish Engulfing | 2 | A tiny bearish candle gets completely swallowed by a bigger bullish one | Indicates buyers are stepping up their game after a downtrend | High |
Grasping these subtle yet vital differences gives traders an edge when choosing patterns that match their strategy and the twisty turns of market conditions. Take the morning star for instance. Its unique three-candle lineup is a lifesaver that helps you avoid the rookie mistake of mistaking it for simpler signals like the hammer.
Traders often spot the morning star candle as a pretty reliable nudge to kick off long positions, while keeping a close eye on risk by using stop-loss orders and setting profit targets.
Following these steps can really help traders take the morning star signal from just another idea and turn it into meaningful trades. Platforms like Binance provide a trading environment that combines competitive fees and solid liquidity, which in my experience are important for pulling off these strategies successfully in the fast-paced world of cryptocurrency markets.
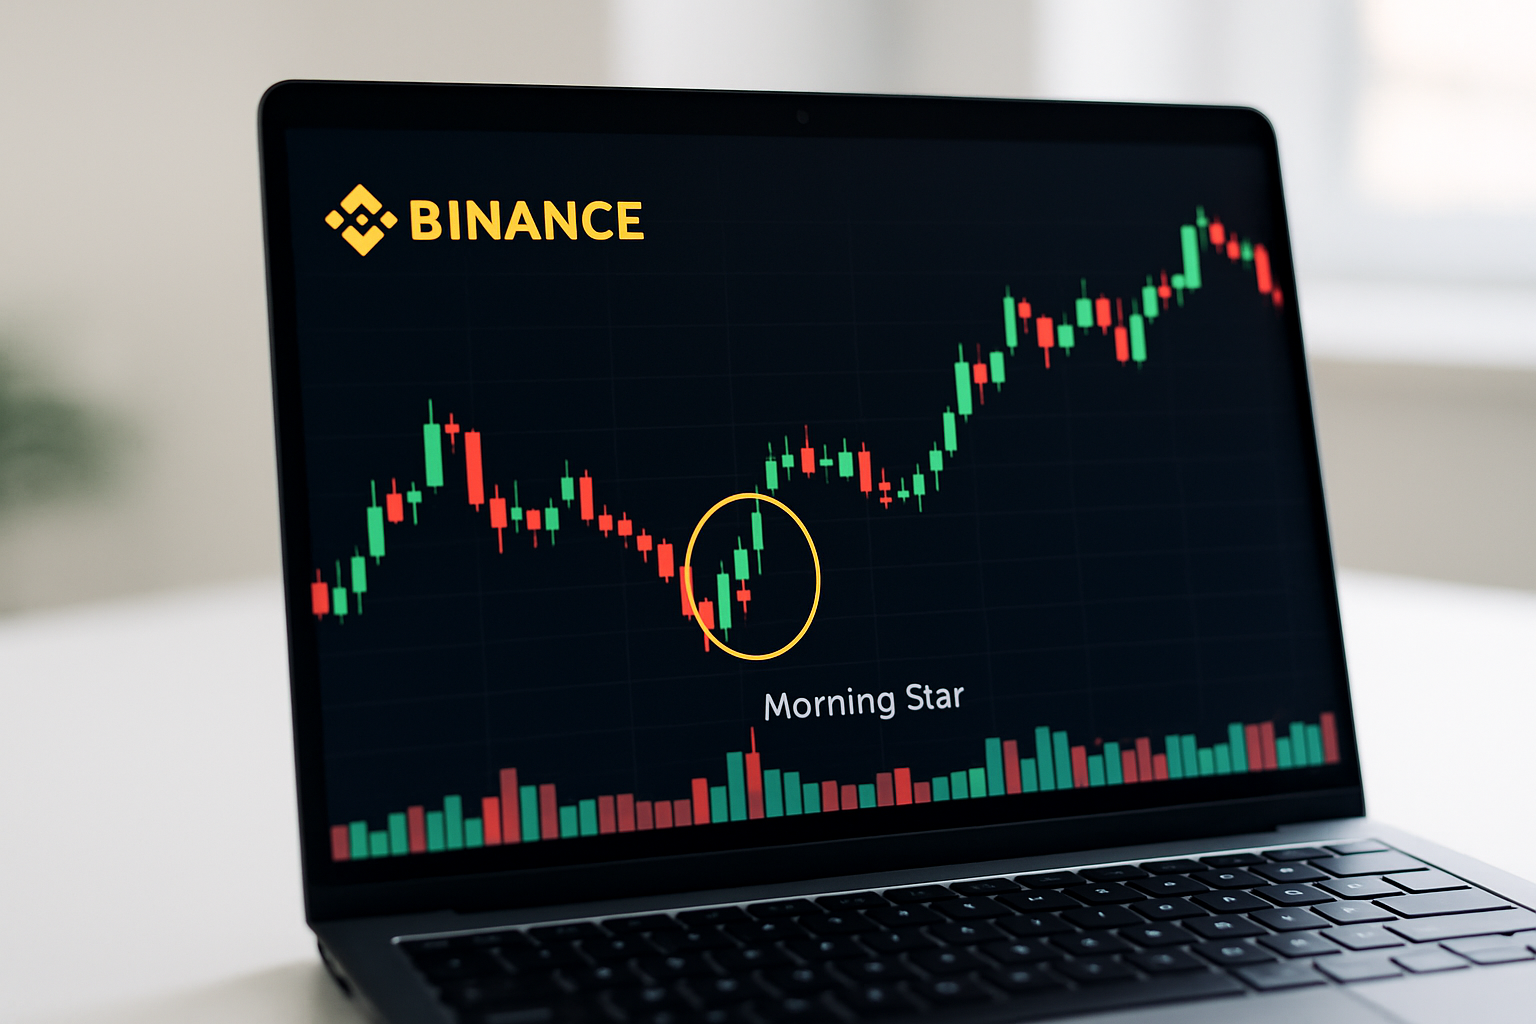
Example of a morning star candle occurring on a live Binance trading platform chart with volume confirmation.
Morning star candles can definitely be a handy tool in a trader’s toolkit but it’s important to remember they’re not the whole story. Leaning on them too heavily without stepping back to see the bigger picture often leads to pesky false signals and of course losses that nobody wants knocking at the door.
Traders usually mix morning star signals with trend analysis and volume studies. They also use handy tools like TradingView's detailed charting and community insights to boost reliability. This multi-layered strategy tends to weed out the weaker setups.
Historical charts often paint a pretty reliable picture. The morning star pattern usually signals that a trend reversal is coming across various asset classes. Take stock markets, for example. Morning star formations often appear right before strong rallies begin following exhausting sell-offs. Forex markets are similar. You’ll often see currency pairs make a neat about-turn when these patterns show up during downtrends.
These case studies nicely illustrate how the morning star candle pattern slips seamlessly across various timeframes from daily to hourly charts and covers different types of assets. Traders on platforms like Binance tend to lean on these patterns day in and day out to make the most of the exchange's robust liquidity and wallet-friendly fees.
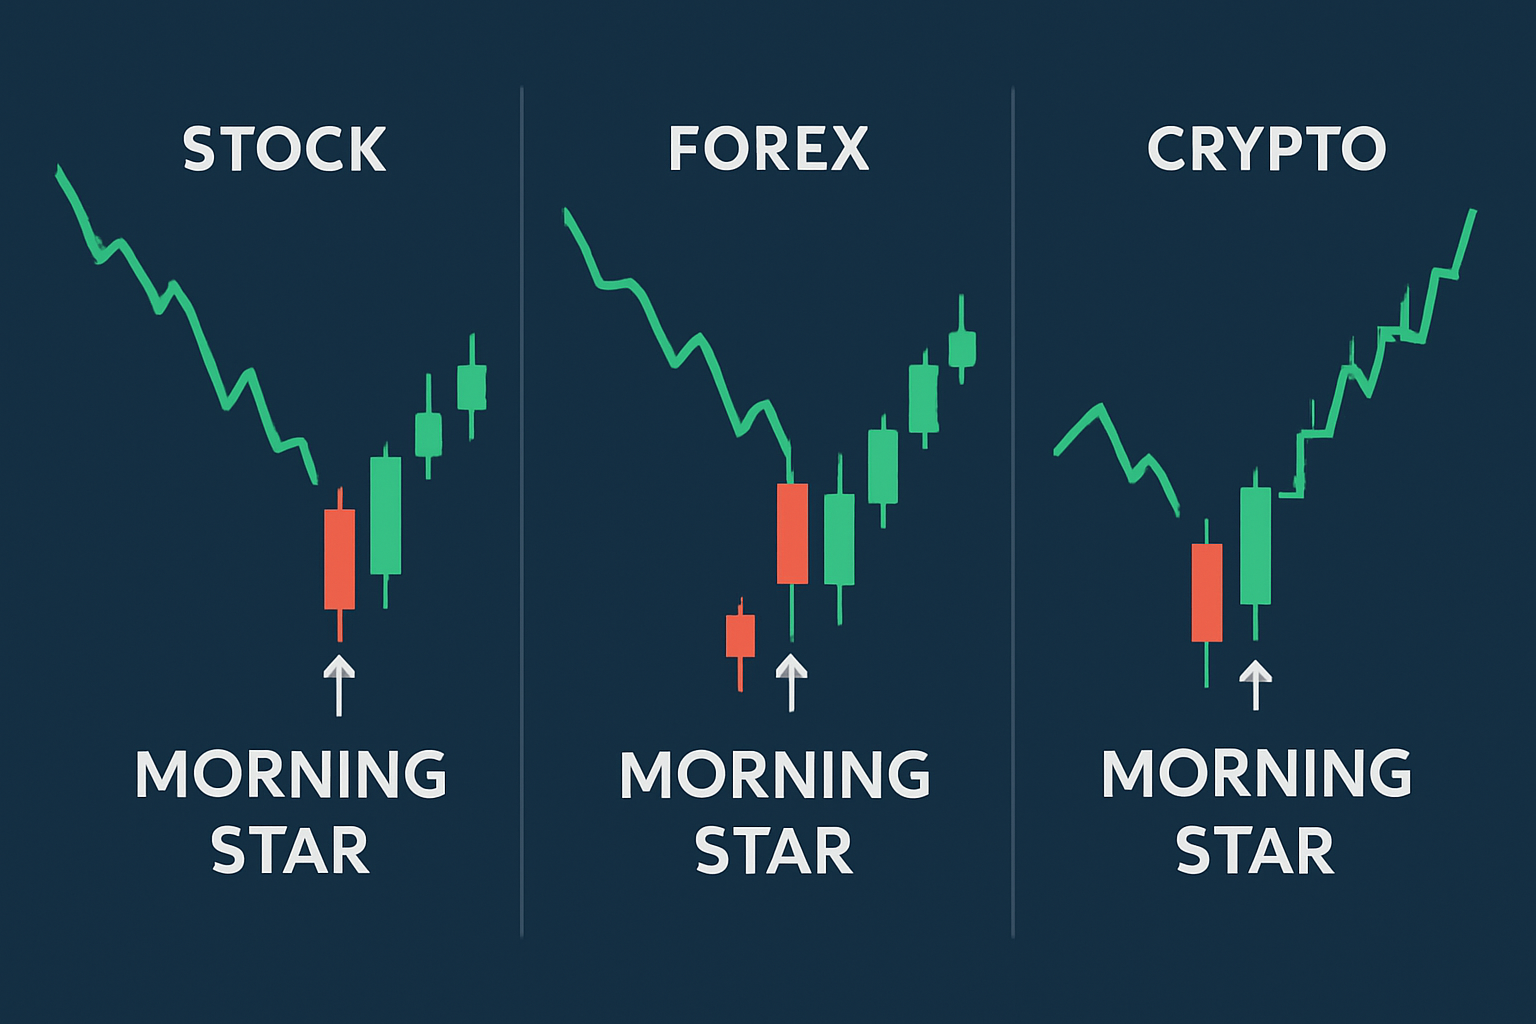
Comparative visual examples of morning star candle patterns across stock, forex, and cryptocurrency markets.

Are you tired of juggling multiple tools for your trading needs? TradingView is the all-in-one platform that streamlines your analysis and decision-making.
With its powerful charting capabilities, real-time data, and vibrant community, TradingView empowers traders like you to stay ahead of the market. Join thousands who trust TradingView for their trading success.

20 posts written
Discover the bullish harami candlestick pattern—a key technical signal that can hint at trend revers...

Learn how the harami candlestick pattern signals potential market reversals. This guide breaks down...

Unlock the power of candle patterns to decode market psychology and improve your trading precision....

Unlock the power of the bear flag pattern with our practical, step-by-step guide. Understand market...