


Technical Analysis
Understanding the Bullish Harami Candlestick Pattern
Discover the bullish harami candlestick pattern—a key technical signal that can hint at trend revers...

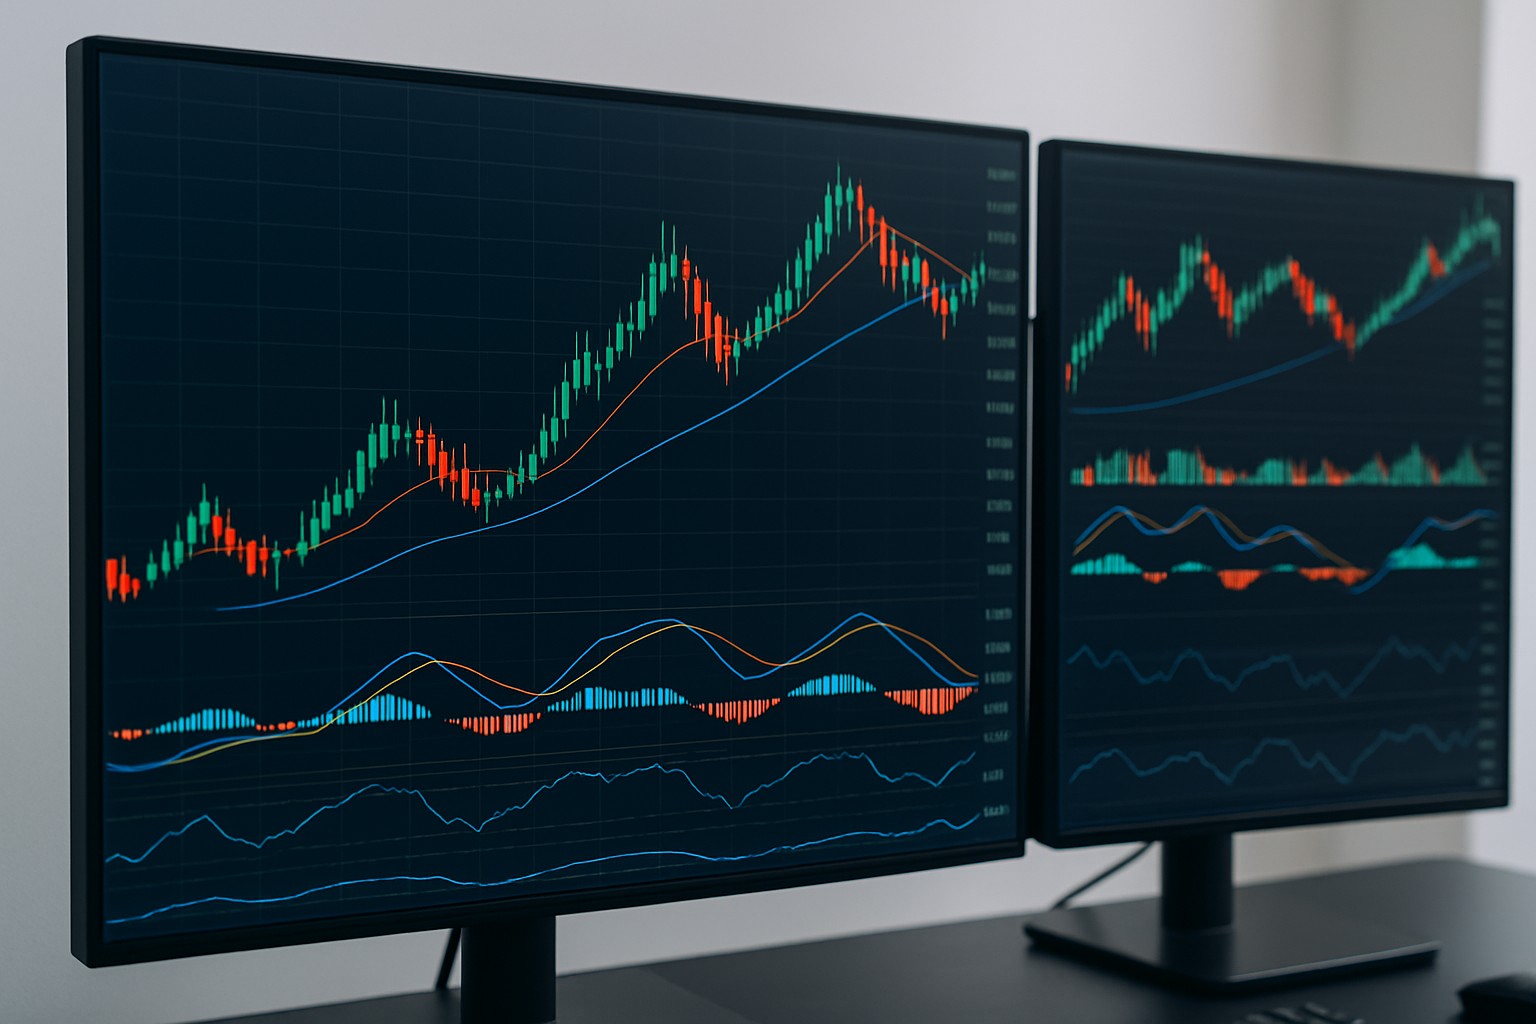
Heikin Ashi is a popular charting technique that’s pretty handy for smoothing out price movements, making it much easier to spot market trends than your usual candlestick charts.
Unlike traditional candlestick charts that lay out raw price data like open, high, low and close in black and white, Heikin Ashi candles take a clever detour by using a special formula that averages prices over time.
Heikin Ashi candles rely on a clever formula that smooths out the usual price chaos and makes the chart look more polished and easier on the eyes. They find the "Close" by averaging the open, high, low and close prices of the current period—kind of like taking a group vote on where the price really ended up. The "Open" is a look back, calculated as the midpoint of the previous Heikin Ashi candle’s open and close by adding them and dividing by two. For the high and low values, the formula picks the absolute highest and lowest points from the current period's high, low and the just-calculated open and close.
Timing is everything, they say, and when it comes to Heikin Ashi charts in trading, that could not be more true. These charts are not your everyday candlesticks; they have got a knack for smoothing out the noise and showing you the bigger picture. I have found that the best moments to rely on Heikin Ashi are during clear trends, when you want to dodge the usual market chatter and focus on the underlying momentum. In my experience, using them during sideways or choppy markets can be like trying to find a needle in a haystack—it gets a bit messy and less reliable. So, when the market is doing its usual dance with a steady rhythm, Heikin Ashi steps in as a trusty partner to help you ride the waves with a bit more confidence and clarity.
Heikin Ashi really shines in markets and trading styles where catching clear trends is the name of the game like trend following or swing trading. It smooths out pesky emotional ups and downs during choppy or volatile price swings and offers a calmer steadier view of momentum.
Use Heikin Ashi to cut through the usual market chatter during trending phases, helping you hang onto trades a bit longer without getting jittery.
Keep an eye out for shifts in candle color and size—these little changes can really shine a light on potential trend reversals, making your life a whole lot easier.
Good things come to those who wait. Sharpen your timing for entries and exits by waiting patiently for clear Heikin Ashi signals before jumping in.
Lean on it to get a better handle on your swing trades by zooming in on those smoother, steadier trend patterns that tend to keep things less crazy.
When the market’s throwing curveballs, Heikin Ashi can be your best friend to dial down emotional reactions and stick faithfully to your trading plan.
Setting up Heikin Ashi charts on platforms like TradingView or Binance is usually straightforward. Once you have them running, watching candle colors and sizes can give you a good feel for the strength of a trend and when a reversal might be near.
Kick things off by opening your favorite trading platform like TradingView and choose the asset you want to analyze.
Change the chart type from candlestick to Heikin Ashi in the chart settings because it offers a clearer perspective.
Pay close attention to the color and shape of the Heikin Ashi candles since they reveal the current trend.
Watch for trend changes when the candles switch colors from green to red or the other way around since this usually signals a warning.
Don’t rely solely on the candles; verify the momentum with other reliable indicators like moving averages or the RSI.
Consider entering trades when the Heikin Ashi candles display a strong, steady color and be ready to plan your exit as soon as the trend shows signs of weakening.
Try pairing Heikin Ashi with well-known indicators like Moving Averages to help smooth out the trend direction. Use RSI to catch overbought or oversold moments and MACD to double-check the trend momentum.
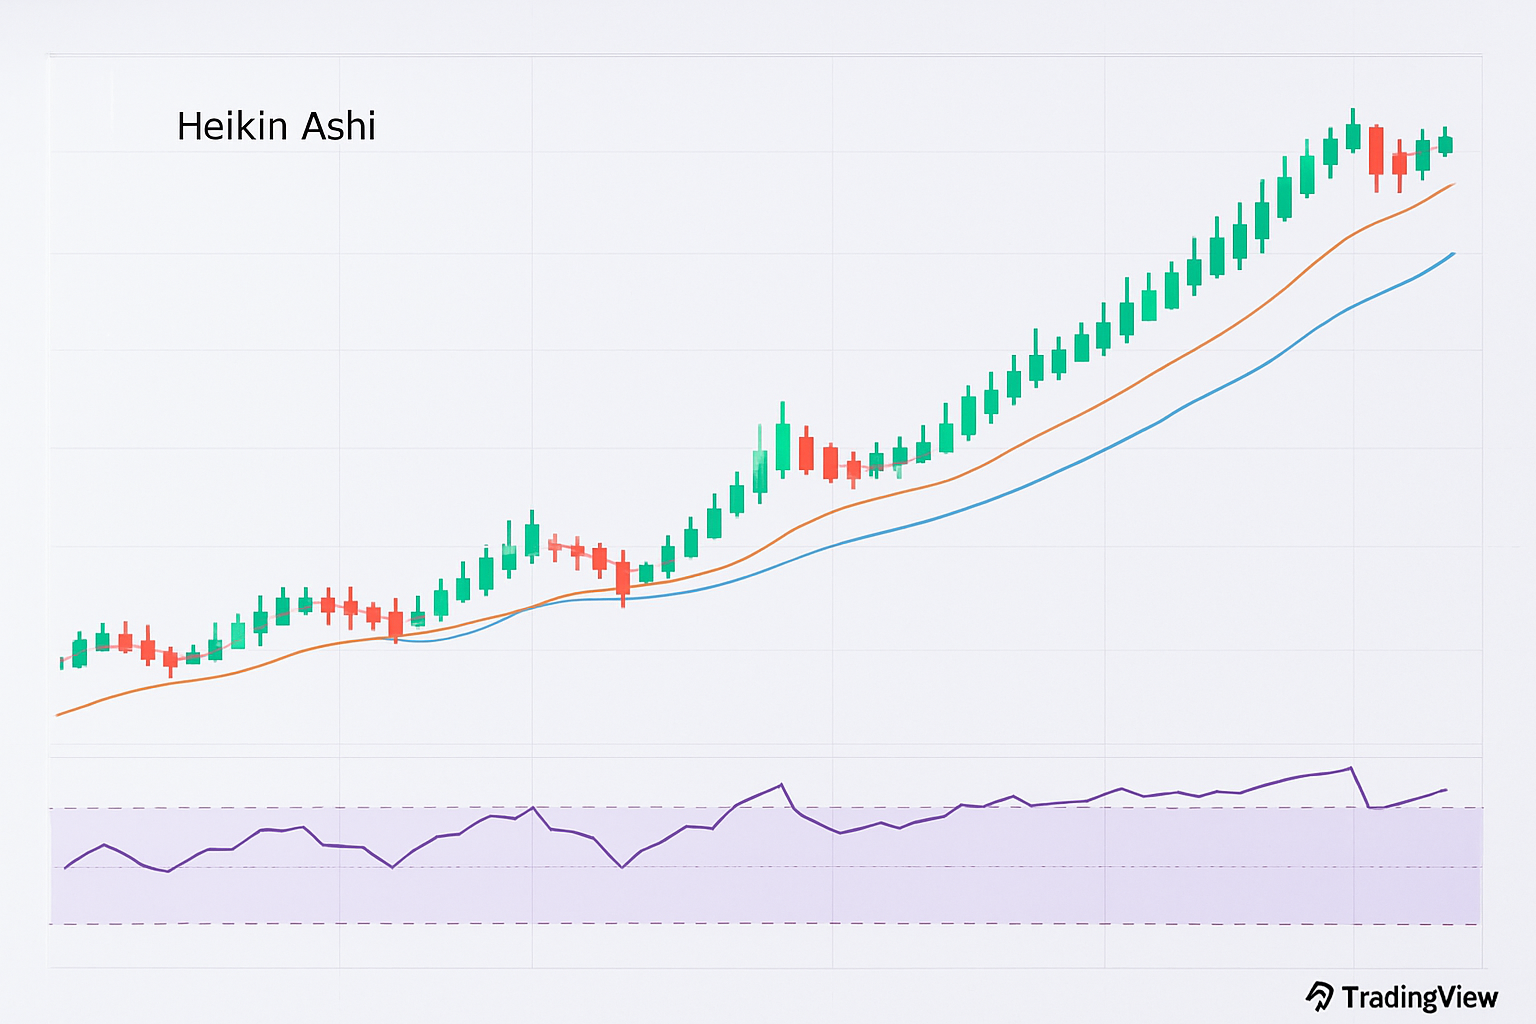
Example of a Heikin Ashi chart on TradingView showing a clear uptrend confirmed by RSI and moving average indicators.
You can sidestep these common pitfalls by pairing Heikin Ashi with rock-solid risk management techniques and leaning on a few trusty tools to double-check your analysis. You should also really get to grips with different market phases.
Really squeeze the most out of Heikin Ashi by playing around with your chart's timeframe or even dipping your toes into multi-timeframe analysis—this way, signals from the higher timeframes back up what you’re seeing on the lower ones. Tinkering with the sensitivity of your indicators alongside those Heikin Ashi charts can also give your entry and exit points that extra polish.

Are you tired of juggling multiple tools for your trading needs? TradingView is the all-in-one platform that streamlines your analysis and decision-making.
With its powerful charting capabilities, real-time data, and vibrant community, TradingView empowers traders like you to stay ahead of the market. Join thousands who trust TradingView for their trading success.

23 posts written
Discover the bullish harami candlestick pattern—a key technical signal that can hint at trend revers...

Discover the doji candlestick—a powerful price action signal revealing market indecision. This begin...

Learn how the harami candlestick pattern signals potential market reversals. This guide breaks down...

Discover what IOUs mean in finance, their role as informal debt acknowledgments, and how understandi...