


Technical Analysis
What is a Harami Pattern? Breaking It Down
Learn how the harami candlestick pattern signals potential market reversals. This guide breaks down...

The descending wedge pattern is a handy tool that traders lean on in technical analysis to catch glimpses of possible shifts in asset prices. It might sound a bit technical at first glance but basically, this pattern paints a picture of a price range that squeezes tighter and tighter between two downward-sloping trend lines that eventually meet. Beginners often scratch their heads over it because the pattern can hint at two very different things either the trend is set to keep chugging along or it might just flip in the opposite direction, depending on the context.
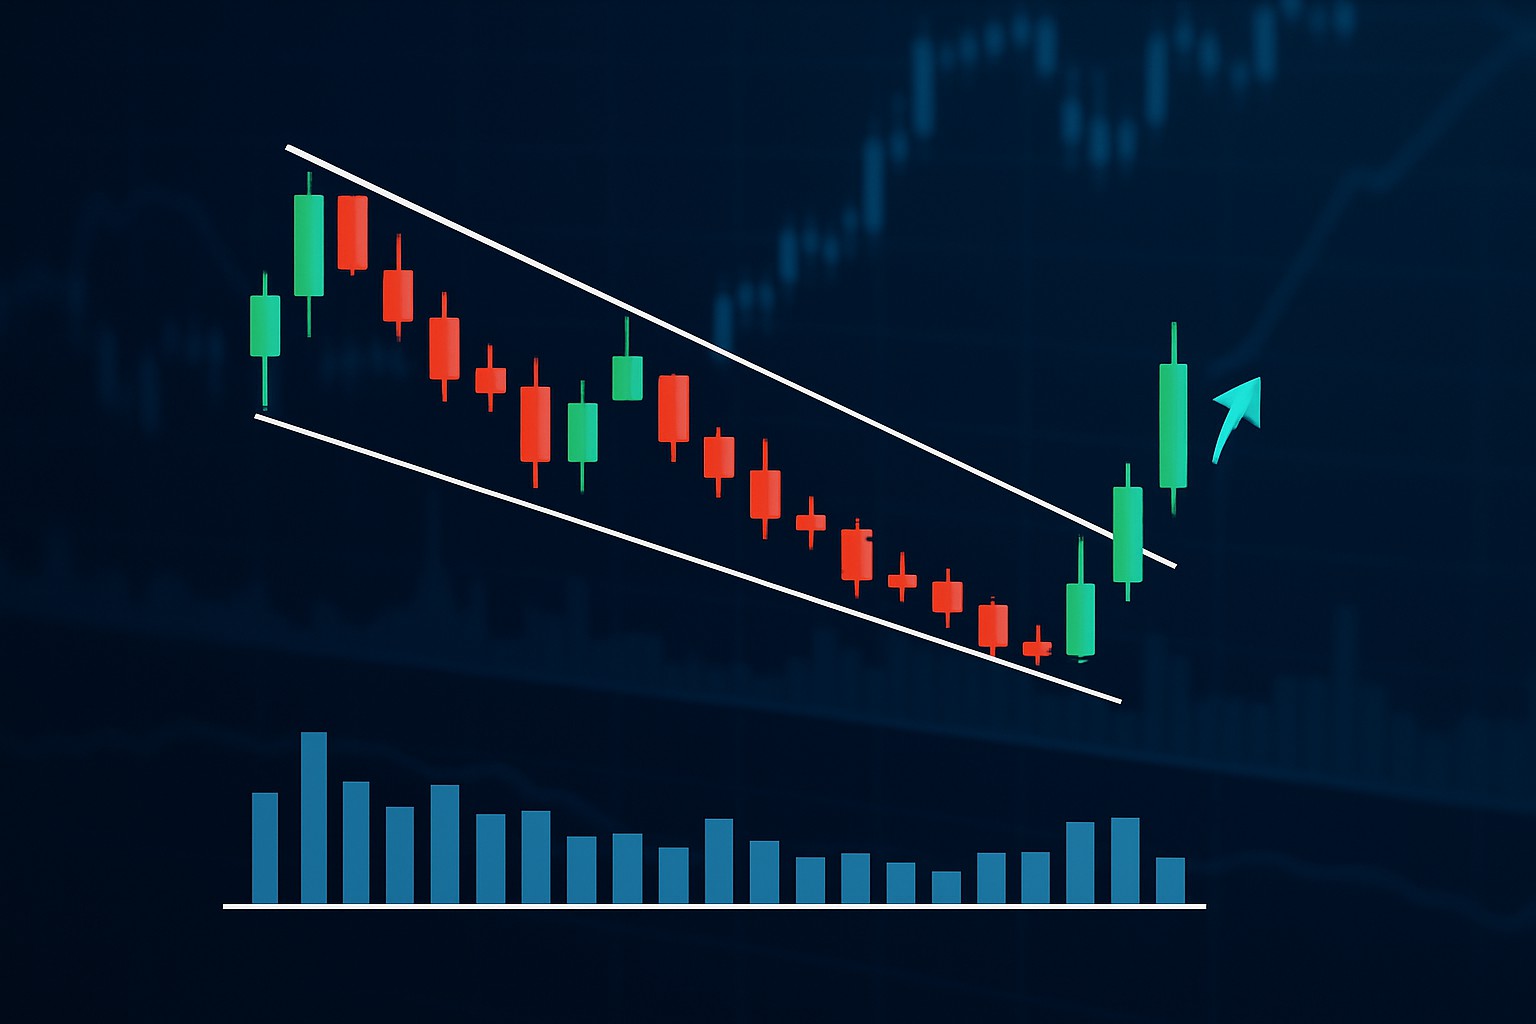
A descending wedge pattern shows up when two trend lines slope downward and start to converge because the upper line falls more steeply than the lower one. Imagine the price bouncing inside a triangle that points downward and slowly squeezes tighter like a funnel narrowing as it goes. As this shape forms the gap between those lines gets smaller, signaling a drop in volatility and often hinting at a market reversal just around the corner.
People often get tripped up by descending wedge patterns because they look like descending channels or pennants since they all slope downward. The key thing to remember is that in a wedge the lines converge like old friends, whereas channels keep a steady parallel distance apart. Pennants usually pop up after sharp price moves and tend to have a tighter more compact formation.
Spot a descending wedge pattern by keeping a close eye on the price action and sketching out two downward-sloping lines that connect the highs and lows—just make sure they’re inching closer together as time goes on. It’s really key to watch the volume during this whole formation, since a dip in volume tends to back up the pattern’s credibility.
Spot a series of lower highs and lower lows on your price chart—these are classic signs that hint at downward momentum.
Draw an upper trend line that connects at least two clear swing highs and slants downward like a gentle slide.
Sketch a lower trend line linking the swing lows. It should slope downward too but more relaxed so the lines gradually squeeze together.
Keep a close eye on volume as the pattern takes shape. Usually it starts dwindling as the wedge tightens like the market holding its breath.
Watch for a breakout above the upper trend line with a spike in volume. That’s your cue the pattern is legit and ready to run.
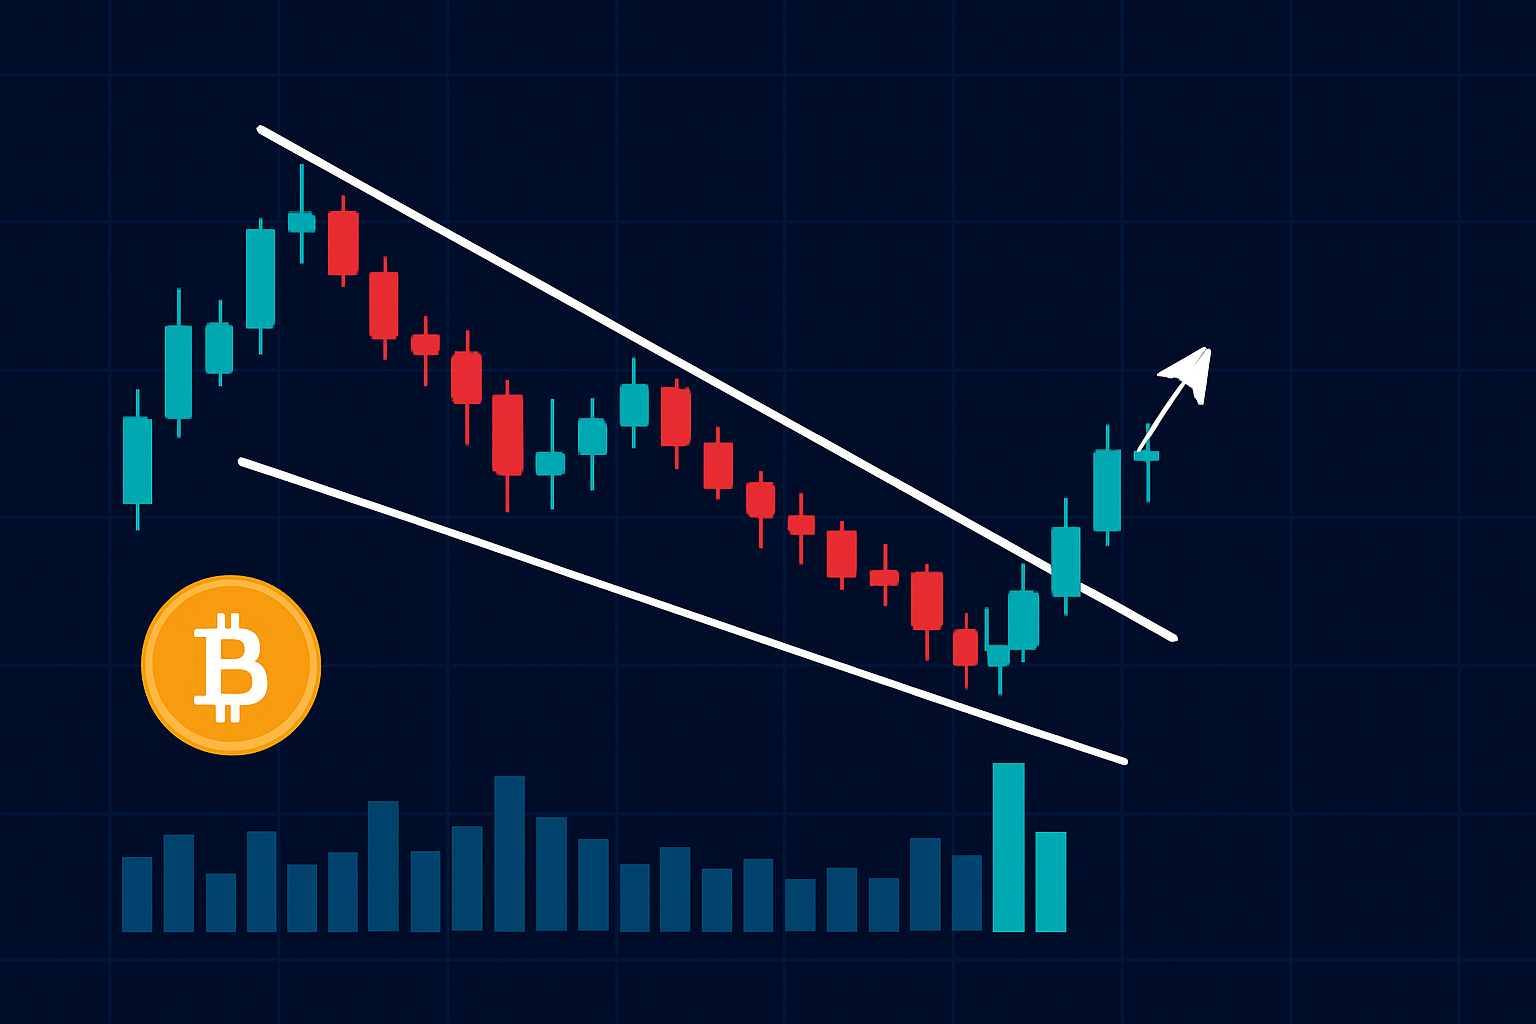
Chart illustrating a descending wedge pattern with trend lines converging and breakout confirmation.
Take a Bitcoin chart as an example where the price is making lower highs and lower lows within a tightening range. When you connect these dots, the classic descending wedge shape starts to take form. You’ll often notice volume dipping during this phase almost like the market is holding its breath. Then it suddenly surges when the price breaks above the upper trend line.
Descending wedge patterns are important because they capture the tug-of-war between sellers and buyers as things come to a boil. Often this pattern signals that selling pressure is starting to chill out and momentum usually swings in favor of the bulls.
Imagine the descending wedge like a spring getting squeezed tighter and tighter. The more you compress it, the more impressive—and sometimes surprising—the bounce tends to be once it finally lets go.
Most descending wedge patterns usually wrap up with a bullish breakout, where the price sneaks above the upper trend line after a bit of consolidation. There are those curveballs—sometimes you get a downward breakout that signals the bearish trend is not quite done yet. It’s really wise to double-check the breakout direction with some trusty indicators and volume before jumping into any trades.
When it comes to trading, descending wedge patterns can be a real game-changer if you know how to read them right. These patterns often sneak up on you, quietly signaling potential reversals or breakouts. Traders who keep an eye out for that tightening range might just catch the perfect entry point before the crowd catches on. Of course, patience and a sharp eye are key here; it’s not always a smooth ride, but the payoff can make the wait worthwhile. So, buckle up and get ready to spot those wedges—you'll find they are a bit like secret handshakes in the trading world, subtle but powerful when understood.
Trading descending wedges often comes down to patiently waiting for a clear breakout before diving into a position. This discipline helps keep risk in check and honestly boosts your odds of scoring decent gains. A common game plan is to go long once the price nudges above the upper trend line with solid volume backing it up—because volume doesn’t lie. Many traders like to set stop losses just below recent swing lows and aim to take profits near classic past resistance levels. When you mix these tactics with strong risk management you tend to build not just your confidence but also better overall results.
Be patient and hold your horses until you see a confirmed breakout above that upper descending trend line. Jumping in too early can lead to regret.
Keep an eye out for volume spikes because they are the market’s way of signaling that this breakout means business.
Enter a long position once the breakout candle firmly closes above the trend line. Don’t be shy about waiting for that green light.
Protect yourself by setting a stop loss just below the most recent swing low. Think of it as your safety net when things don’t go your way.
Plan your exit around prior resistance or those measured move levels so you can lock in profits before the market changes its tune.
Managing risk is absolutely key when trading wedge patterns. Traders do best when they exercise patience and hold off until a breakout is confirmed, rather than diving in headfirst too soon. Descending wedges have a bit of a reputation for throwing false breakouts, so keeping an eye on volume alongside other trusty indicators like RSI or moving averages usually helps steer clear of costly slip-ups.
Let’s be honest, descending wedges often get a bit of a bad rap, and not always for good reason. Many individuals jump to conclusions or overlook subtle clues, which can turn a promising setup into a head-scratcher. In my experience, knowing where these pitfalls lie can save you from some frustrating missteps. So, let’s unpack some of the classic blunders and misunderstandings that tend to trip people up when dealing with descending wedges.
Traders often find themselves tripping over some all-too-familiar mistakes when working with descending wedge patterns. It’s easy to mix these up with other setups and rush into trades before the stars align with solid confirmation. Many overlook subtle shifts in volume, ignore the bigger market picture, and put too much faith in a breakout actually happening.
Descending wedges often pop up as bullish reversal patterns, but their antics can shift depending on the market context and the timeframe you’re eyeballing. A descending wedge sometimes sneaks into a downtrend, making the direction of the breakout a bit of a wild card. Traders usually lean on analysis across multiple timeframes to double-check the pattern’s significance, hoping higher timeframes back up the move they’re expecting.
| Pattern Variation | Typical Trend Context | Breakout Direction Probability | Volume Characteristics | Suggested Complementary Indicators |
|---|---|---|---|---|
| Classic Descending Wedge | Commonly spotted during downtrends or those sideways consolidation episodes | Usually breaks out on the bullish side of things | Volume tends to dip before suddenly spiking right at the breakout | RSI, MACD, Moving Averages |
| Continuation Wedge | Pops up often in strong downtrends | Typically, the breakout keeps heading downward | Volume patterns can be all over the place here | Fibonacci retracement, Volume Weighted Average |
| Multi-Timeframe Wedge | Shows up across multiple timeframes | Generally needs a thumbs-up from several timeframes before confirming | Volume behavior shifts depending on which timeframe you’re watching | Higher timeframe trend lines, Stochastics |
| Failure/False Breakout | Can crop up in pretty much any market condition | Breakouts tend to flip-flop and reverse quickly | Volume spikes? Not something you can always trust here | Bollinger Bands, Stop loss for managing risk |
| Extended Wedge | Found in those longer-lasting patterns | Breakouts might take their sweet time compared to your usual wedges | Volume typically drifts downward slowly | TrendSpider’s pattern recognition tools |
Incorporating descending wedge patterns into a broader trading strategy can really boost your edge. Tools like TrendSpider automate pattern detection and, combined with a careful look at volume and broker integrations, placing orders becomes smoother. It’s wise to double-check signals across multiple timeframes and technical indicators so you don’t put all your eggs in one basket. Keeping a trade journal using software like Edgewonk helps track your results and fine-tune your approach over time.

Struggling to improve your trading performance? Edgewonk's advanced analytics tools are designed to give you the edge you need.
With detailed trade journaling, robust strategy analysis, and psychological insights, you'll gain a comprehensive understanding of your strengths and weaknesses. Don't miss out on this game-changing opportunity.

23 posts written
Learn how the harami candlestick pattern signals potential market reversals. This guide breaks down...

Master the hammer candlestick pattern—a key indicator for market reversals. This beginner-friendly g...

Unlock the power of the bear flag pattern with our practical, step-by-step guide. Understand market...

Discover what IOUs mean in finance, their role as informal debt acknowledgments, and how understandi...