


Technical Analysis
Most Important Candle Patterns Every Trader Should Know
Unlock the power of candle patterns to decode market psychology and improve your trading precision....

The harami candlestick pattern is a distinctive formation featuring two candles that traders watch during technical analysis. We will explore what makes a harami stand out, how you can spot it on price charts easily, and how to trade it with practical strategies.
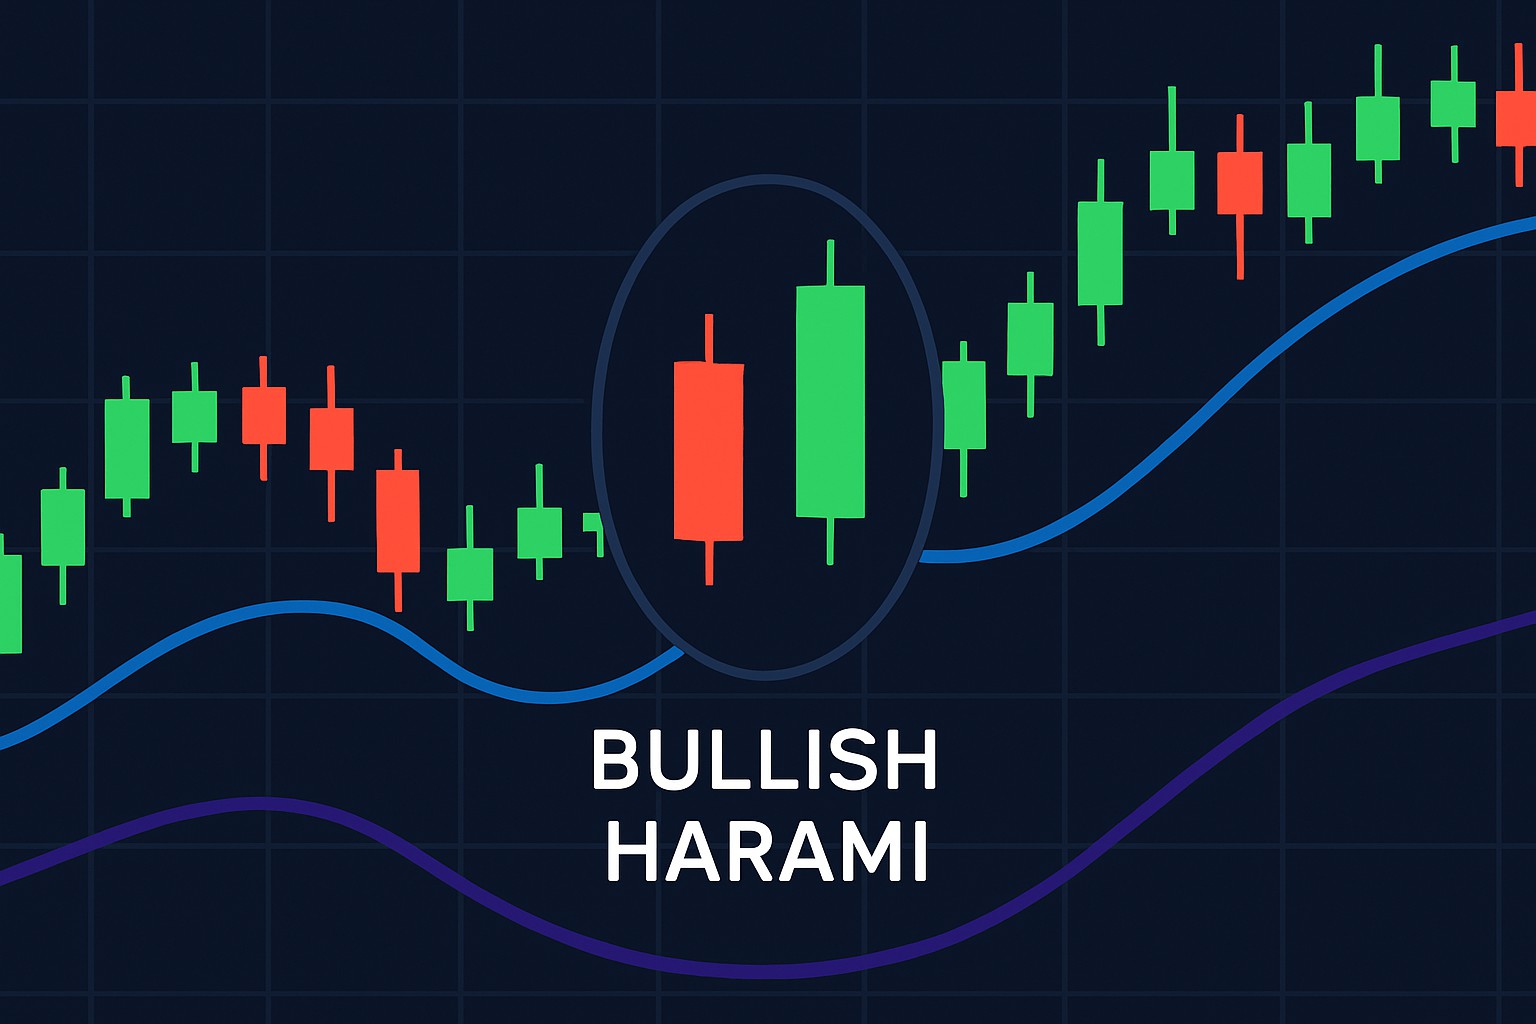
A harami candlestick pattern shows up as two candles, with the second candle’s real body noticeably smaller and snugly fitting within the larger real body of the first. Picture it like a big egg cradling a smaller egg inside the bigger candle plays the role of a careful guardian, often hinting at a possible hiccup or reversal in the ongoing trend.
Harami patterns come in two main flavors: bullish and bearish. A bullish harami pops up during a downtrend and gives a little nudge that the market might be gearing up for a turnaround. It kicks off with a hefty bearish candle, followed by a smaller bullish candle that snugly fits within the range of the first one. On the flip side, a bearish harami shows up during an uptrend and gently hints that things could be about to slide downward. This pattern starts with a big bullish candle, then a smaller bearish candle settles inside it.
| Feature | Bullish Harami | Bearish Harami |
|---|---|---|
| Candle 1 Color | Bearish (usually red or black, painting a gloomy picture) | Bullish (commonly green or white, giving off a hopeful vibe) |
| Candle 2 Color | Bullish (green or white, a little spark of optimism) | Bearish (red or black, whispering caution) |
| Trend Prior to Pattern | A downtrend, stocks on a bit of a slippery slope | An uptrend, things looking nice and rosy |
| Typical Market Implication | Might just be the market’s way of saying, “Hold on, things could turn up” | Often a nudge that the tide might be turning and prices could slip down |
| Example Scenario | Picture a stock taking a tumble, then a small bullish candle shows up, hinting someone’s stepping back in to buy | Imagine a stock having a good run, then a tiny bearish candle pops up, suggesting sellers might be quietly lining up |
People often mix up the harami with engulfing patterns or doji candles which is understandable if you are just diving into chart reading. The big giveaway is this: in an engulfing pattern the second candle swallows the first one whole with no ifs or buts. Meanwhile the harami features a second candle that is notably smaller and nestled inside the larger candle before it like a cozy little secret. As for the doji it is a different beast with open and close prices neck and neck giving it a distinctive cross-shaped look.
Spotting a harami pattern means you’ll want to pay close attention to the chart—no skimming allowed. It’s all about checking the size and placement of those candles. Honestly, getting a feel for the trend leading up to it can make a world of difference. Volume usually adds a handy layer of confirmation to show whether the market supports this pattern.
Size up the dominant trend direction—whether the market is riding a wave up or slipping down—since harami patterns often hint at a possible turnaround.
Pinpoint a sizable 'mother' candle that really flexes some muscle with a strong price move following the current trend.
Spot a smaller 'baby' candle cozying up entirely within the vertical range of the mother's real body—think of it as the little one nesting inside.
Make sure this pattern pops up right after a noticeable price move, because that’s when it tends to pack the most punch.
Take a peek at trading volume or maybe some other indicators like RSI or MACD to give you that extra bit of confidence before calling it.
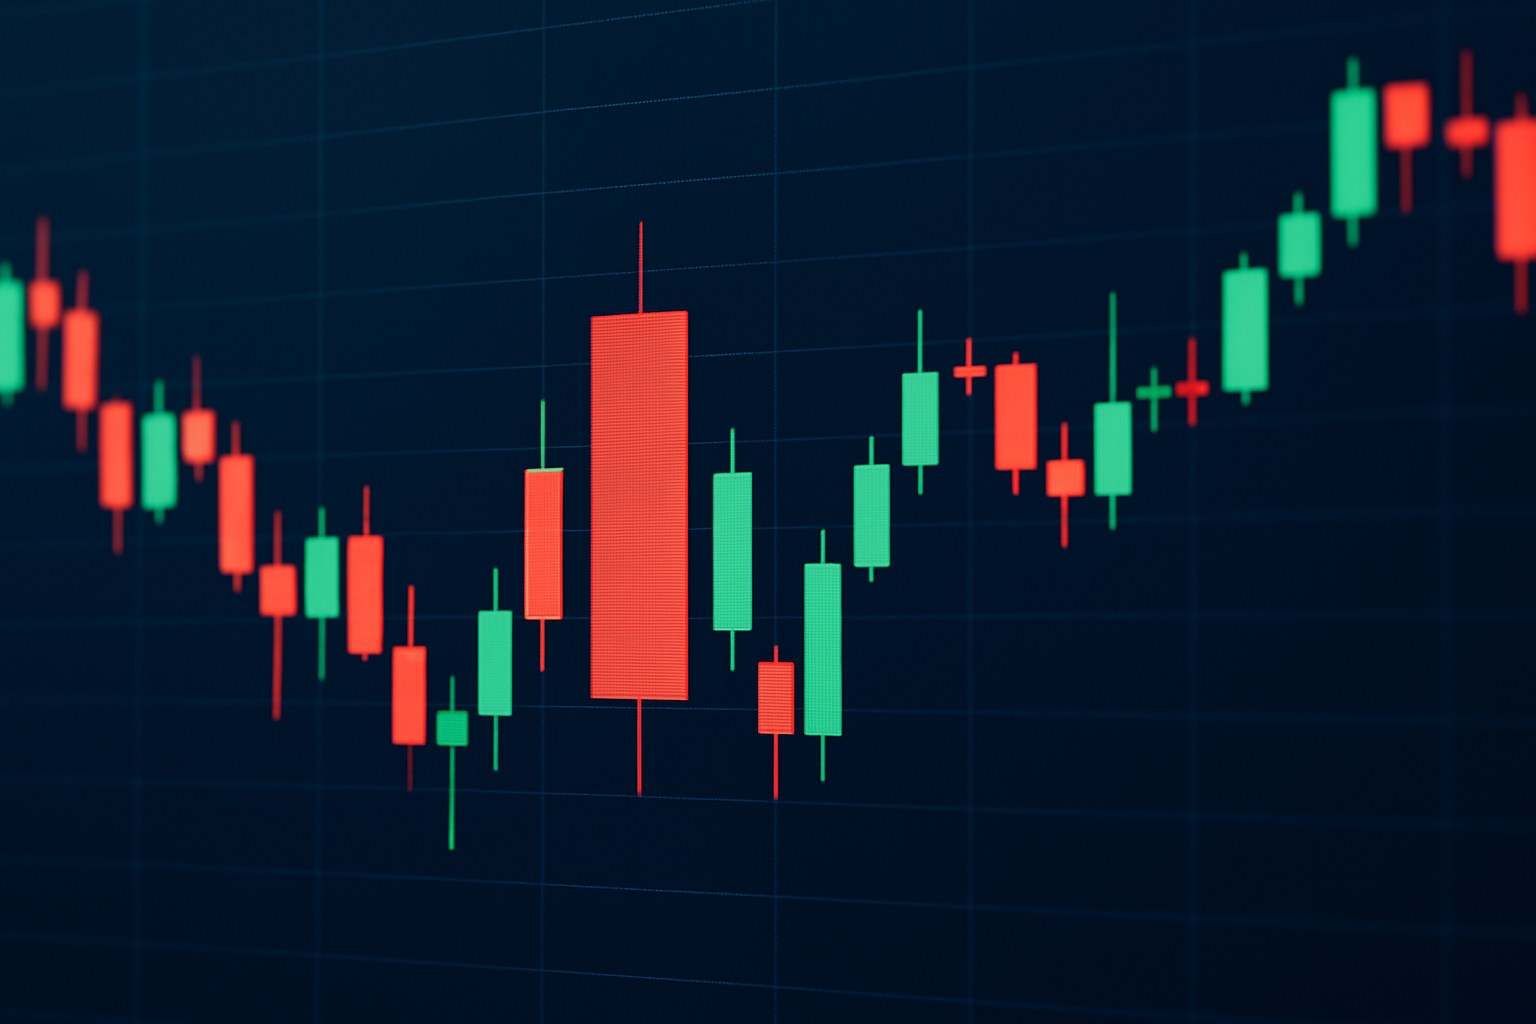
Example of a bullish harami candlestick pattern on a live trading chart, illustrating the smaller candle fully contained within the previous candle's body.
The harami pattern marks a spot in the market where momentum usually takes a breather and traders catch their breath. After a strong move the smaller candle often spells uncertainty or a pause for thought among buyers and sellers, suggesting a subtle tug-of-war for control.
"The harami often feels like a brief breather in the market after a strong run. It offers traders a little pause to step back and reassess, hinting that the earlier momentum might be starting to lose a bit of steam."
Incorporating the harami pattern into your trading calls for a good dose of patience and thoughtful risk management. It’s really key to hang back and wait for confirmation before jumping in, and pairing this with other indicators alongside support and resistance levels can help solidify the trade opportunity.
For instance, take the bullish harami. If you catch this pattern during a downtrend, you might think about going long once the next candle closes above the baby candle's high. It’s a neat little signal that often flies under the radar. To keep your risk from sneaking up on you, I’d suggest placing a stop-loss just below the mother candle’s low—think of it as your safety net. Then you can aim for a profit target near a recent resistance level or stick to a comfortable risk-to-reward ratio. Flipping the script with a bearish harami in an uptrend, you could look to short when a confirmation candle closes below the baby candle’s low.
The harami pattern can be a handy tool in your trading arsenal, but leaning on it alone is a bit like putting all your eggs in one basket. It tends to pop up in sideways markets without really waving a red flag for any genuine reversals.
To really make the most of harami candlestick patterns, it’s a good idea to blend their signals with solid trend analysis and check them out across multiple timeframes. I’ve found that practicing how to spot and trade haramis on demo accounts first can save you from a few headaches once real money is involved. Plus, keeping a trading journal and staying open to learning as you go often does wonders for sharpening your understanding.

Struggling to improve your trading performance? Edgewonk's advanced analytics tools are designed to give you the edge you need.
With detailed trade journaling, robust strategy analysis, and psychological insights, you'll gain a comprehensive understanding of your strengths and weaknesses. Don't miss out on this game-changing opportunity.

23 posts written
Unlock the power of candle patterns to decode market psychology and improve your trading precision....

Master the hammer candlestick pattern—a key indicator for market reversals. This beginner-friendly g...

Unlock the power of the bear flag pattern with our practical, step-by-step guide. Understand market...

Learn how the harami candlestick pattern signals potential market reversals. This guide breaks down...