


Technical Analysis
What the Doji Candlestick Means in Price Action
Discover the doji candlestick—a powerful price action signal revealing market indecision. This begin...

This article walks you through how to spot and trade the double top chart pattern giving your market timing a much-needed boost.
The double top chart pattern is a key bearish reversal signal in technical analysis that’s worth keeping an eye on. Catching it early can give traders a heads-up about potential price drops, basically flagging when a rally has run out of steam. Being able to spot this pattern not only helps traders make smarter calls but also lets them manage risk more effectively
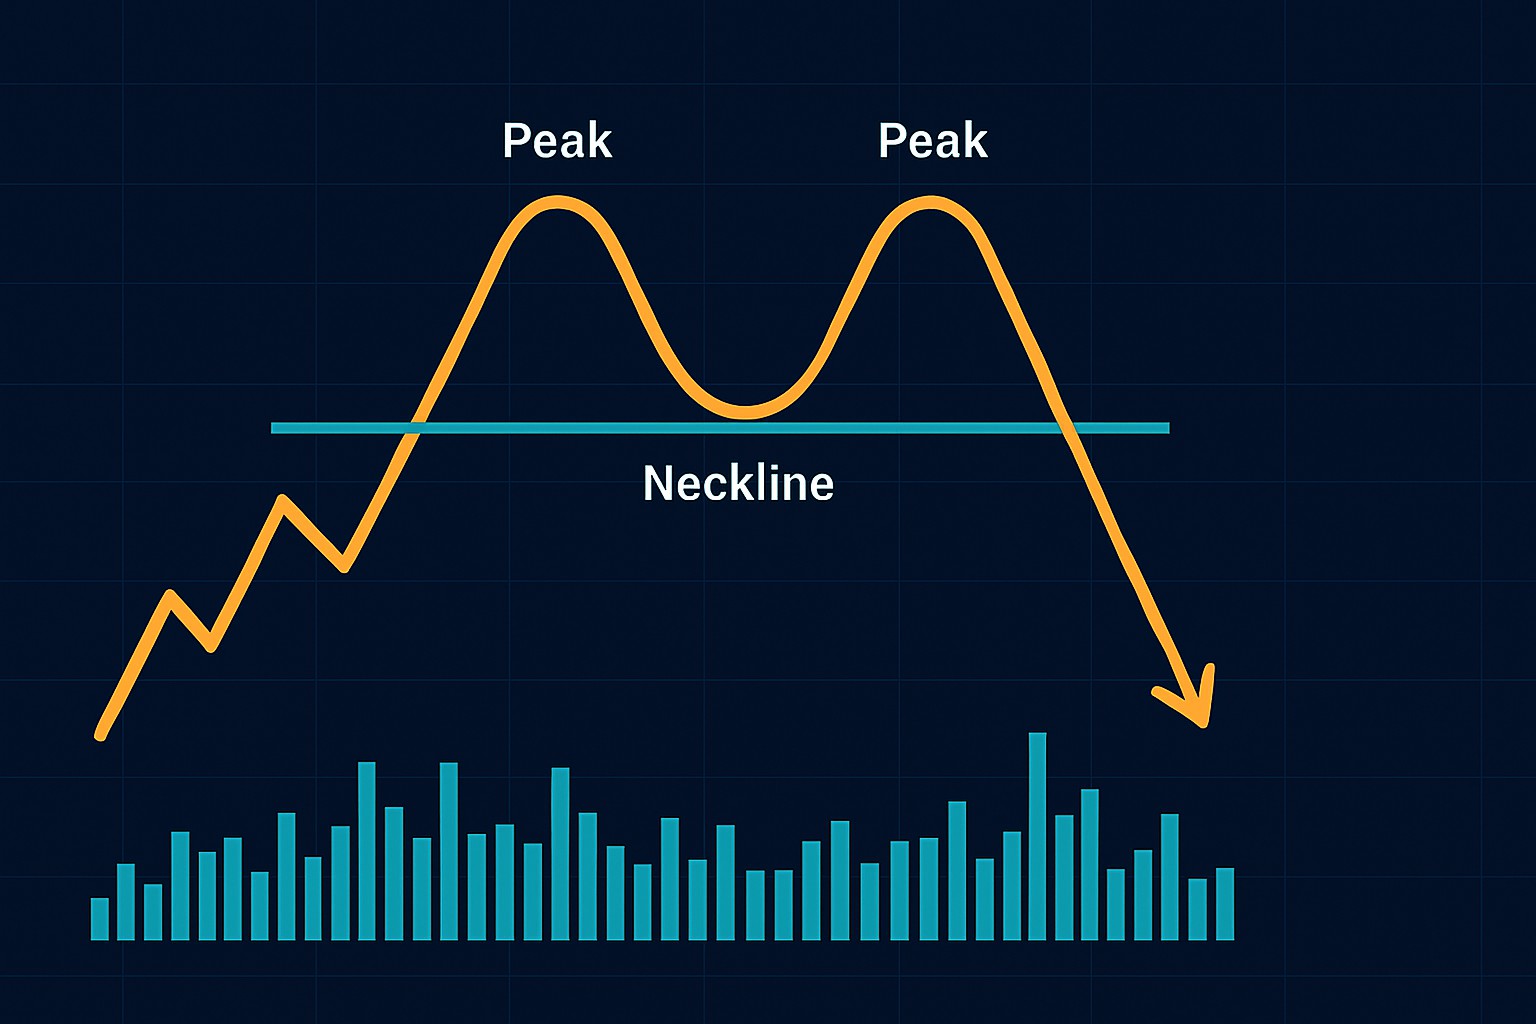
A double top pattern pops up when a price climbs to a high point then dips to a moderate low before making another run at the same resistance level but can’t break through. Imagine two distinct peaks that resemble a big bold M on the chart. This pattern often waves a red flag about a weakening uptrend and hints at a possible bearish reversal where sellers start flexing their muscles and push prices downward.
Visualization of a classic double top chart pattern showing two distinct peaks and the neckline.
Volume and the time between the two peaks are key when confirming a double top. Generally, lower volume on the second peak signals weaker buying pressure almost like the enthusiasm fizzled out.
Make sure there was a clear uptrend beforehand because a double top usually signals a reversal after prices have climbed steadily for a bit.
Spot the first peak where the price hits a high and then takes a breather hinting at early resistance.
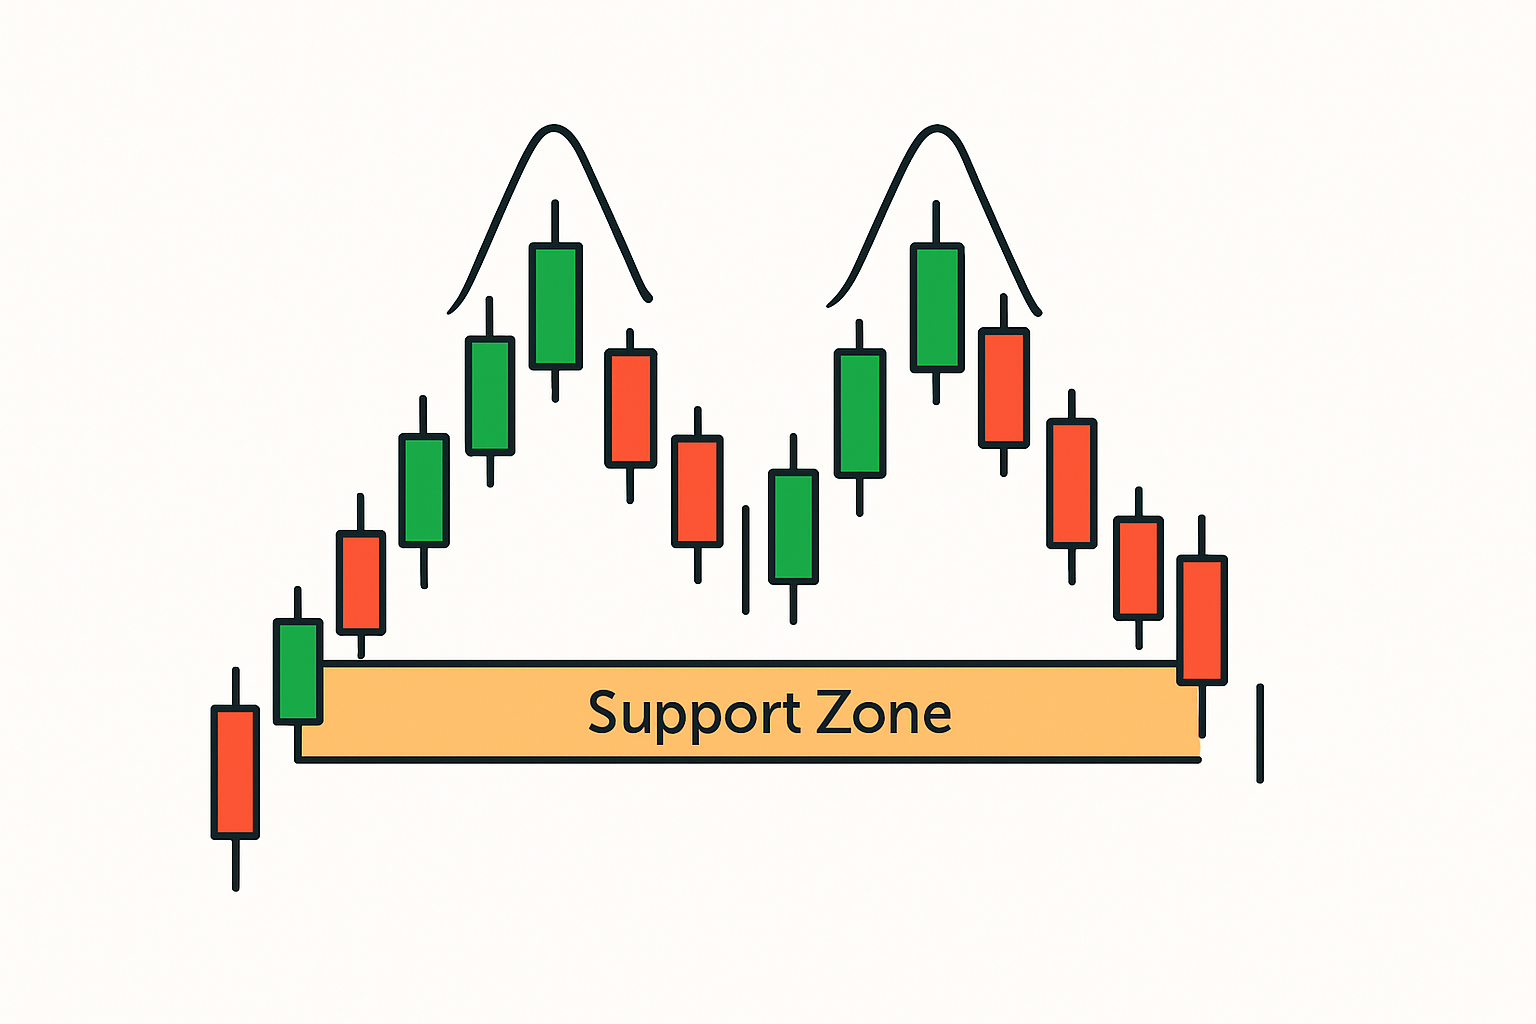
Keep an eye on the retracement or trough where the price dips from that first peak forming the neckline support.
Watch for a second peak that sneaks close to the same price level as the first. This is the market waving a white flag in its struggle to push higher.
Double-check the neckline support level set at the trough’s low because this is the vital spot to monitor moving forward.
Look out for a solid break below the neckline with volume picking up to confirm the pattern and give you a heads-up about a likely further drop.
Cut down on those pesky false signals by ensuring the peaks really stand out and that any breakout below the neckline comes with a noticeably higher volume. You can spot the difference between double tops and patterns like head and shoulders by paying close attention to the peak heights and the timing.
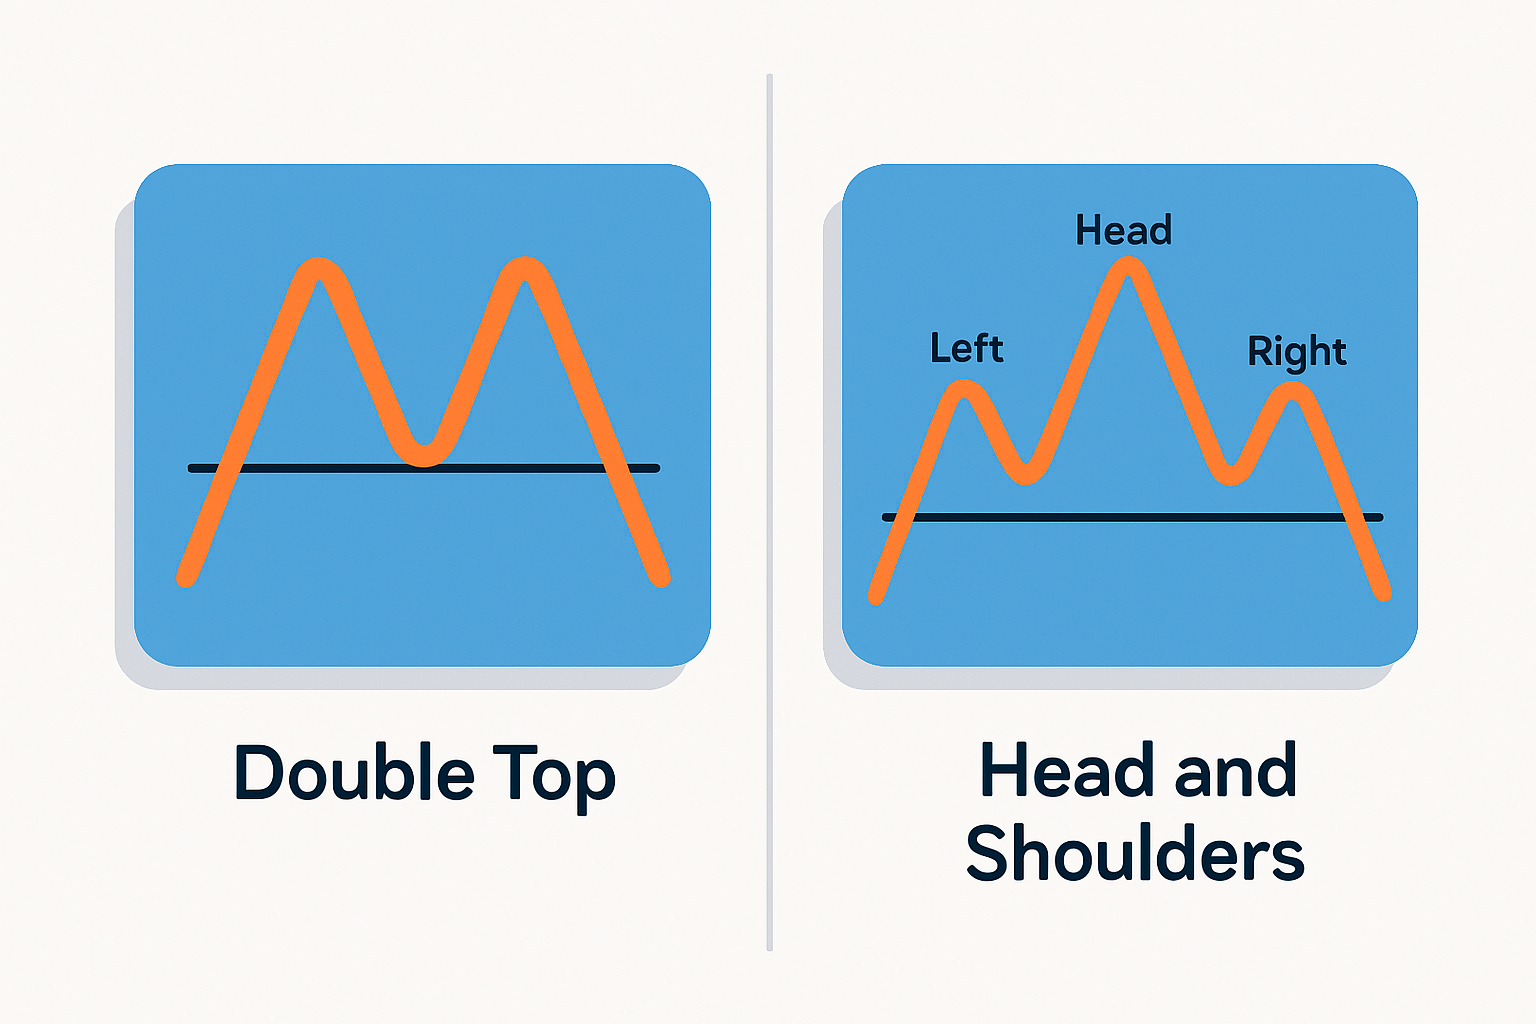
Comparison between a double top pattern and a head and shoulders pattern to help traders distinguish them.
It really pays off to pair volume analysis with trusty indicators like RSI or MACD. I’ve found that using reliable charting tools to zoom in closely and eyeball those peak levels can make all the difference.
Traders often lean on double top patterns to get a better handle on when to jump in and when to bow out. Typically, they’ll tuck their stop-loss orders just above that second peak—kind of like setting a safety net—and then target price drops based on the height of the pattern to keep risks in check while eyeing potential gains.
Make sure the pattern is fully cooked by spotting a clear breakout below the neckline support—no half measures here.
Jump into a sell or short position shortly after the breakout to ride the downtrend while it’s fresh and juicy.
Set a stop-loss just above the second peak to keep your losses in check, just in case the pattern decides to throw you a curveball.
Figure out your price target by measuring the vertical distance from that peak down to the neckline, then project it downward—kind of like connecting the dots with a purpose.
Back up the double top setup with other trusty technical tools like moving averages or volume analysis to nail the timing on your entry and exit. It makes all the difference.
Using advanced charting platforms like TradingView and TrendSpider can take the hassle out of spotting double top chart patterns, making the process both easier and surprisingly precise. TradingView offers user-friendly charting tools packed with customizable indicators that do a great job highlighting support and resistance levels, not to mention tracking volume trends—it's like having a trusty sidekick by your side. TrendSpider leans on AI-powered pattern recognition and sends dynamic alerts, keeping traders on their toes about potential double top setups. Both platforms let you set up alerts for neckline breakouts, which is a lifesaver when you need to move fast.

Are you tired of juggling multiple tools for your trading needs? TradingView is the all-in-one platform that streamlines your analysis and decision-making.
With its powerful charting capabilities, real-time data, and vibrant community, TradingView empowers traders like you to stay ahead of the market. Join thousands who trust TradingView for their trading success.

16 posts written
Discover the doji candlestick—a powerful price action signal revealing market indecision. This begin...

Learn how the harami candlestick pattern signals potential market reversals. This guide breaks down...

Discover what IOUs mean in finance, their role as informal debt acknowledgments, and how understandi...

Unlock the power of the head and shoulders pattern with this complete guide. Learn to spot, trade, a...