


Technical Analysis
Most Important Candle Patterns Every Trader Should Know
Unlock the power of candle patterns to decode market psychology and improve your trading precision....

The upside down hammer candlestick pattern is a key signal in technical analysis that gives traders a heads-up about possible market reversals. It might look tricky at first glance but don’t worry—this article will walk you through its shape, what it means and how to actually put it to work.
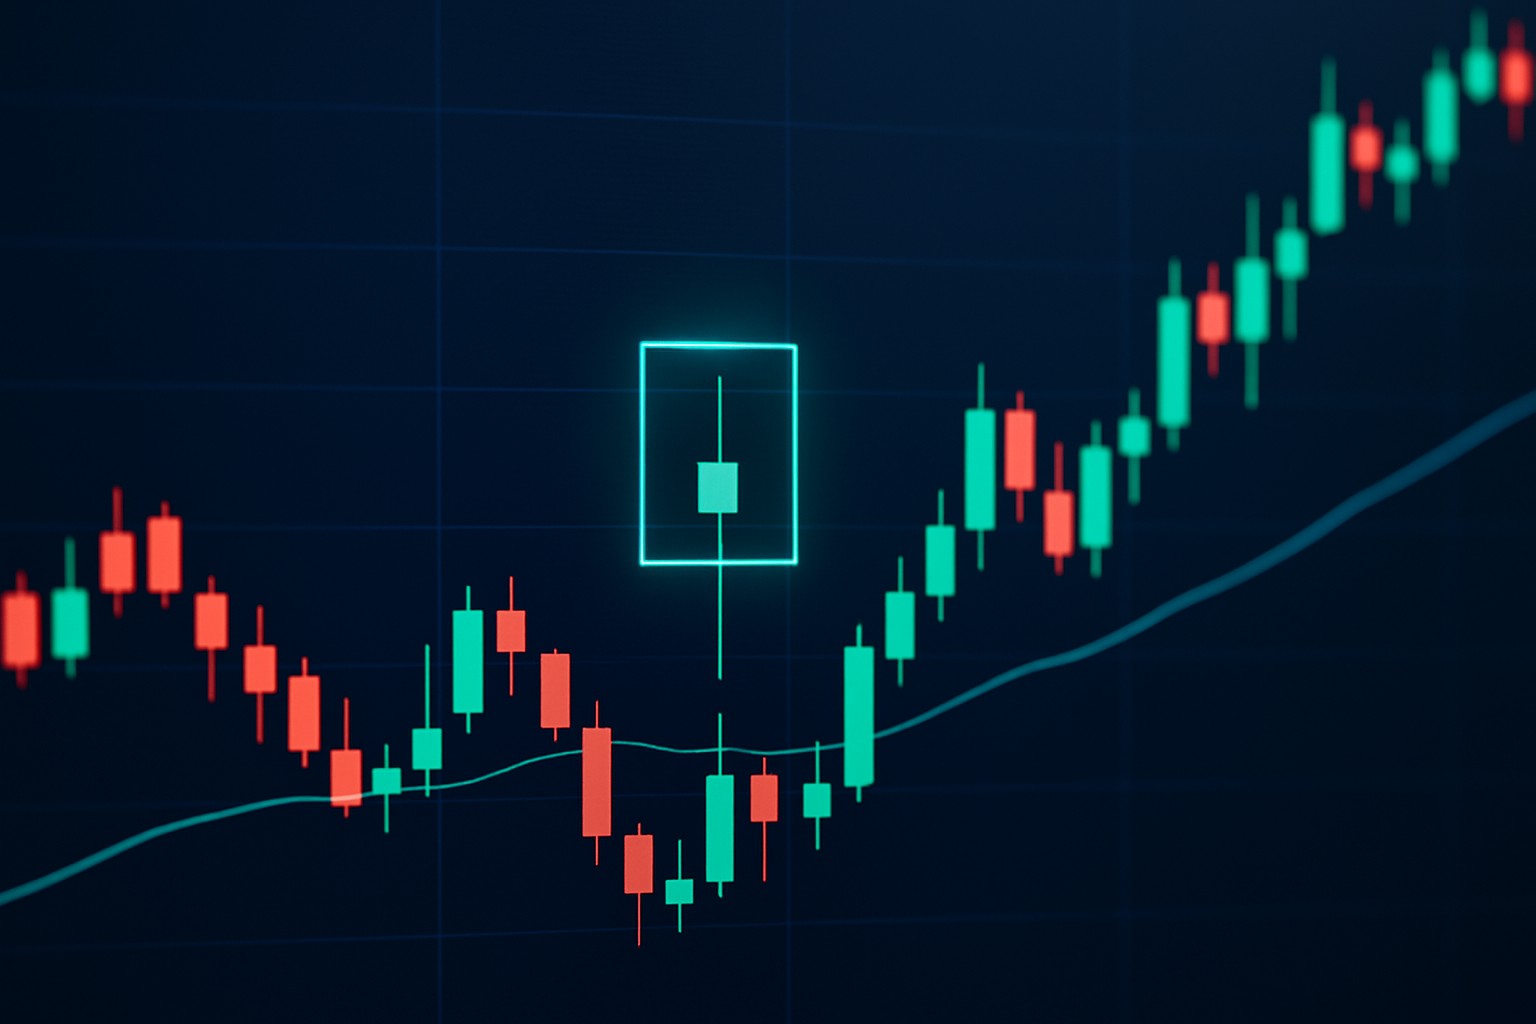
Candlestick charts are a favorite among traders for keeping an eye on price movements over specific time frames. The upside down hammer stands out as a unique candlestick pattern, sporting a small real body perched near the candle’s low and a long upper shadow that catches your eye. Unlike the regular hammer, this pattern often hints at a possible bullish reversal when it appears after a downtrend.
Visual representation of the upside down hammer candlestick pattern on a price chart
The upside down hammer really tells a story about market sentiment. That long upper shadow? It’s like buyers were eager to push prices higher but quickly hit a wall of selling pressure. Meanwhile, the small real body hanging out near the bottom hints at some hesitation or a pretty weak close—kind of like the market wasn’t quite sure what to do next.
This pattern is important because it often signals that the downward momentum might be losing steam. During a downtrend an upside down hammer shows that buyers made a solid attempt to jump in even though they were initially held back.
The upside down hammer often behaves like a careful little test—buyers make a nice effort to lift prices, but sellers are not having any of it and swiftly push them right back down. It is a classic sign that the market might be gearing up to change direction before you know it.
To reliably spot the upside down hammer on charts, it’s really about keeping an eye on both the pattern’s shape and the spot it pops up in the trend. Mix it up with look-alikes like the shooting star or inverted hammer by paying close attention to where it lands and taking a good hard look at the candle’s proportions.
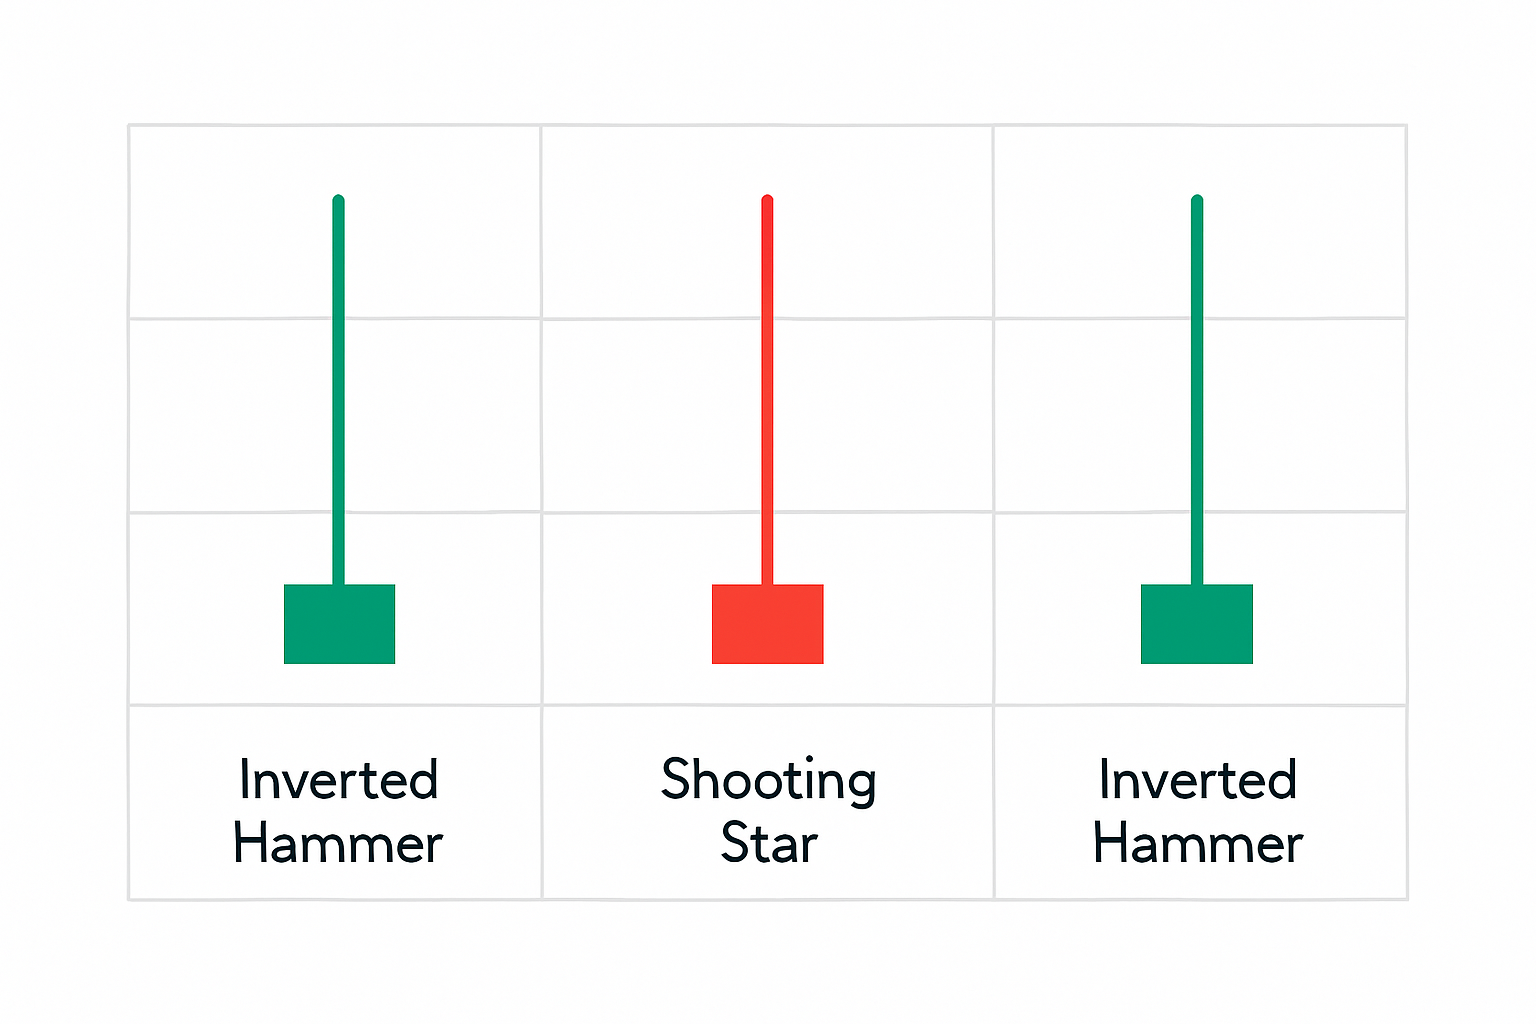
Side-by-side candlestick comparisons to help distinguish the upside down hammer from similar patterns
When it comes to trading, the upside down hammer can be a real game-changer if you know how to read it right. This little candlestick pattern often pops up after a downtrend, waving a subtle flag that the bulls might be preparing to take back control. But it is not a magic wand—I've found that pairing it with other indicators or volume confirmation tends to up your odds significantly. So, think of the upside down hammer as a helpful hint, rather than a guaranteed signal, nudging you to keep your eyes peeled for a possible reversal. And let us be honest, in the choppy waters of trading, a hint this clear is worth its weight in gold.
Traders often throw the upside down hammer pattern into their strategies and tweak entry points, stop losses and profit targets to suit their style. Whether you are in it for swing trading or scalping, getting a good handle on how to read this pattern can give you an edge in spotting trend changes.
Keep an eye out for the inverted hammer pattern after a solid downtrend—it's a classic sign buying pressure might be sneaking back.
Wait for the next candle to close bullish or show an uptick in volume—that’s your green light to believe the setup isn’t a fluke.
Once that confirmation rolls in, take a long position to ride the possible trend reversal while it’s fresh.
Be smart about risk: place your stop loss just below the most recent swing low. It’s a safety net if the reversal decides to bail on you.
When taking profits, eyeball nearby resistance levels or past highs—locking in gains is the name of the game.
Confirmation signals really step up to the plate when it comes to boosting confidence in trading the upside down hammer. You will often see them show up as higher trading volume during the confirmation candle or a bullish candle that closes just above the hammer’s body.
The upside down hammer can offer useful insights on its own but when you add other technical indicators trading precision usually improves. Tools like RSI or MACD help spot shifts in momentum. Support and resistance levels serve as reliable signposts toward sensible target zones.
Although the upside down hammer pattern can be quite handy, traders sometimes trip up by missing the bigger picture or ignoring important confirmation signals. These slip-ups often lead to false trade signals and missed opportunities that can sting a bit.
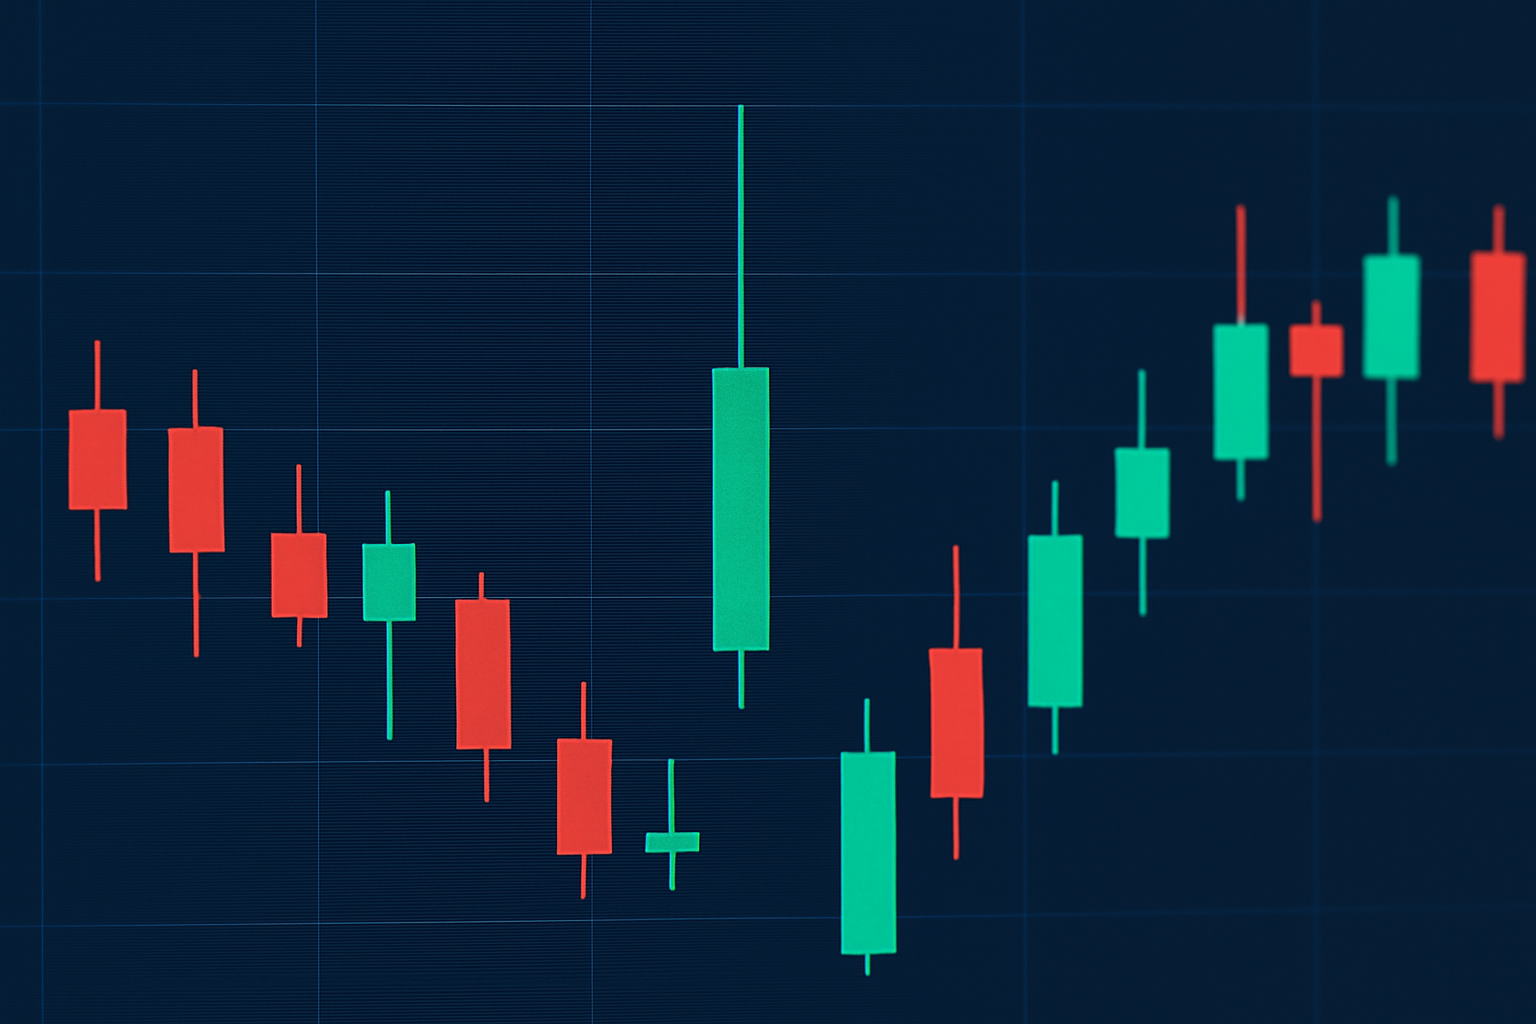
Think back to a recent dip on a popular cryptocurrency chart where an upside down hammer candlestick (or inverted hammer) popped up right after a sharp drop. A trader using Binance for spot trading noticed the long upper wick and small lower body on the candle. What caught their attention was the volume spike on the next candle. They played it smart by setting a stop loss just below the hammer’s low and watched the nearby resistance level to take profit, nabbing a quick rebound.
Historical chart example of an upside down hammer pattern triggering a bullish reversal in crypto trading

Tired of missing opportunities and making suboptimal trading decisions? TrendSpider's cutting-edge platform automates complex technical analysis, saving you time and reducing human error.
With multi-timeframe analysis, dynamic alerts, backtesting, and customizable charting, you'll gain a competitive edge in identifying trends and making informed trades across global markets.

20 posts written
Unlock the power of candle patterns to decode market psychology and improve your trading precision....

Unlock the power of the bear flag pattern with our practical, step-by-step guide. Understand market...

Master the hammer candlestick pattern—a key indicator for market reversals. This beginner-friendly g...

Learn how the harami candlestick pattern signals potential market reversals. This guide breaks down...