
Insights
110 articles
Unlock a wealth of analytical tools and resources to deepen your market understanding and make well-informed trading decisions. Our Insights Hub empowers you with comprehensive data visualizations, market trends, and expert commentary to elevate your trading strategies.
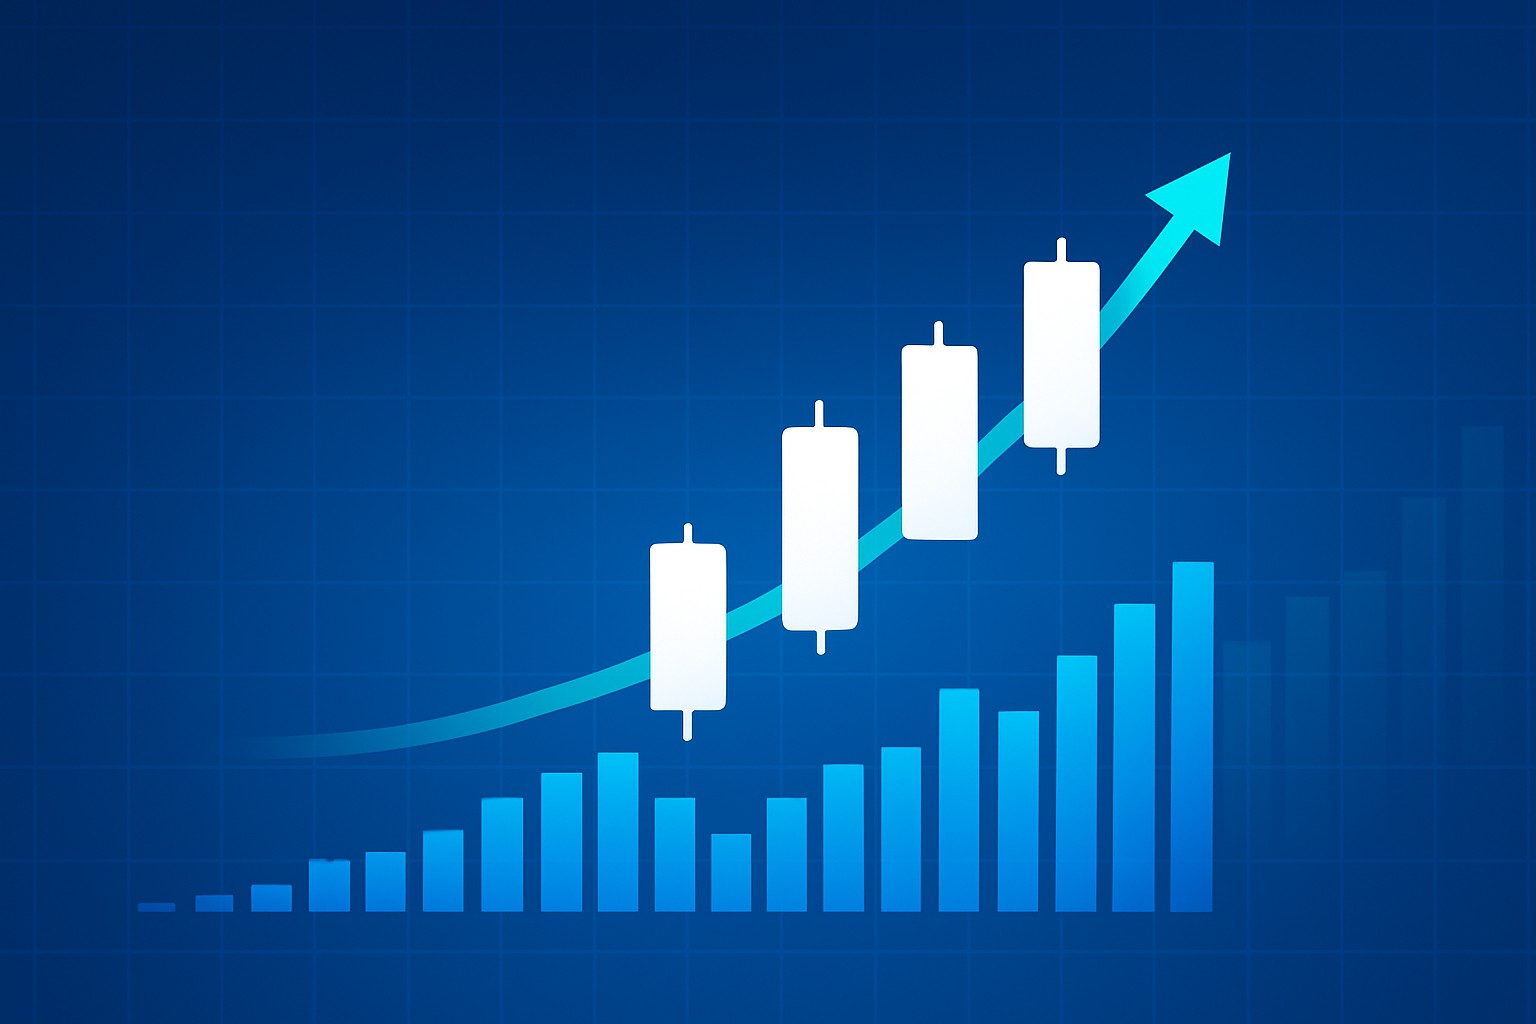
What 3 white soldiers reveal about market direction?
The 3 white soldiers pattern is a powerful bullish signal in technical analysis, revealing sustained buying pressure and potential trend reversal. Learn how this pattern can illuminate market direction for traders.

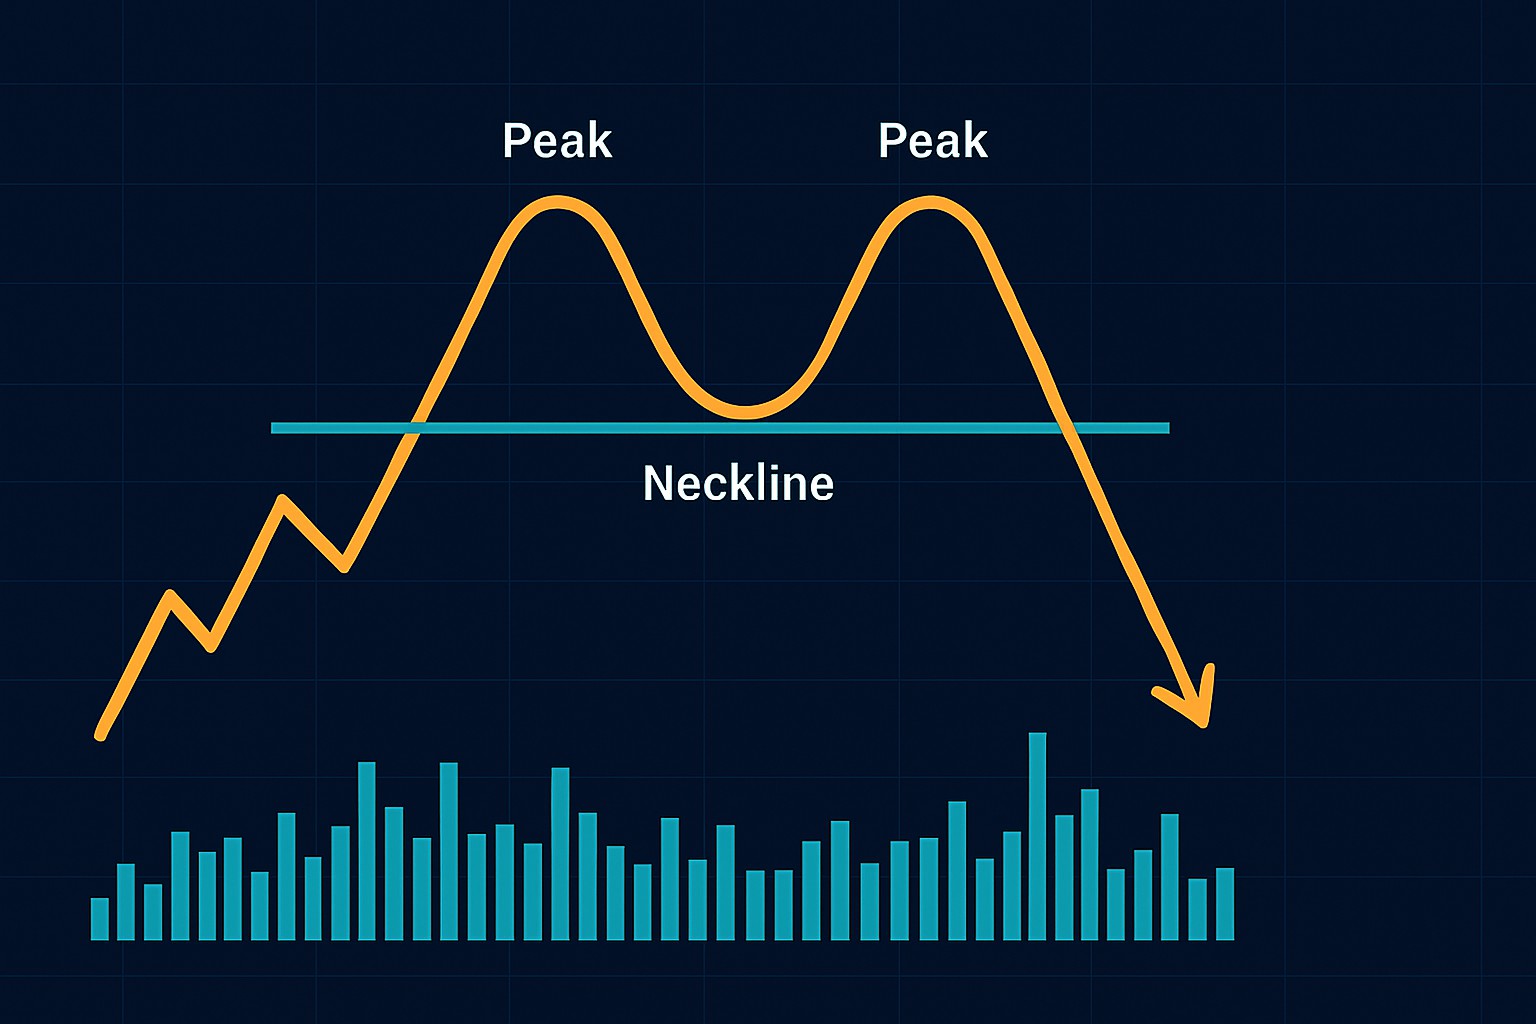
How to Spot a Double Top Chart Pattern
Discover how to reliably spot the double top chart pattern and use it to anticipate price reversals, optimize your trading entries, and manage risks effectively.
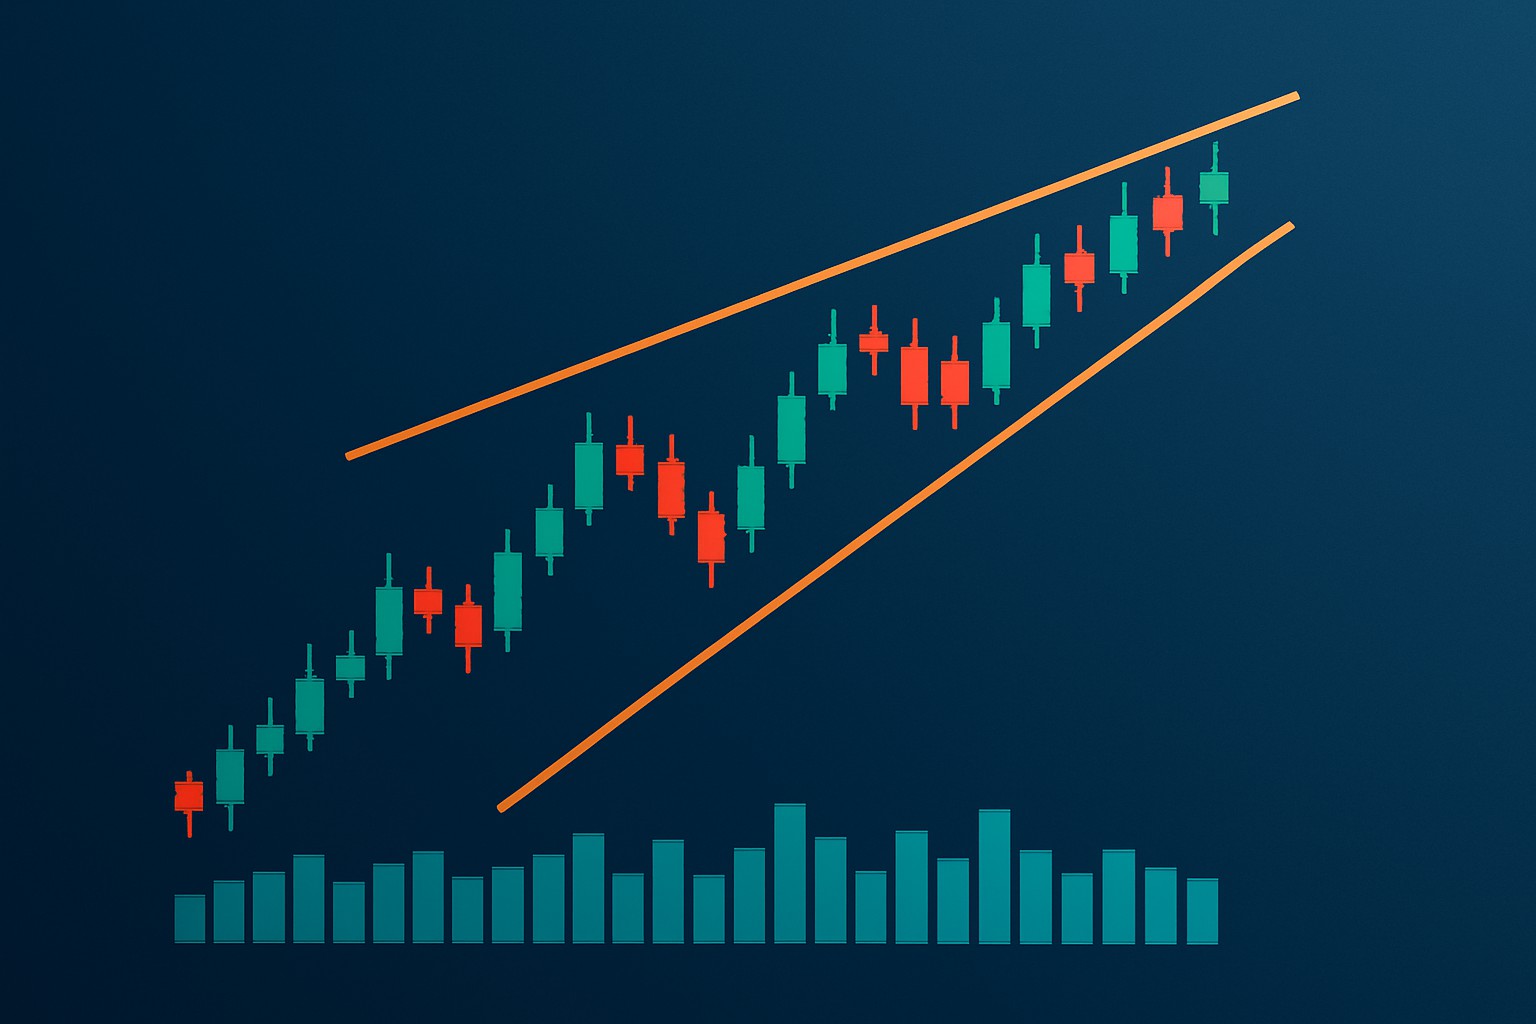
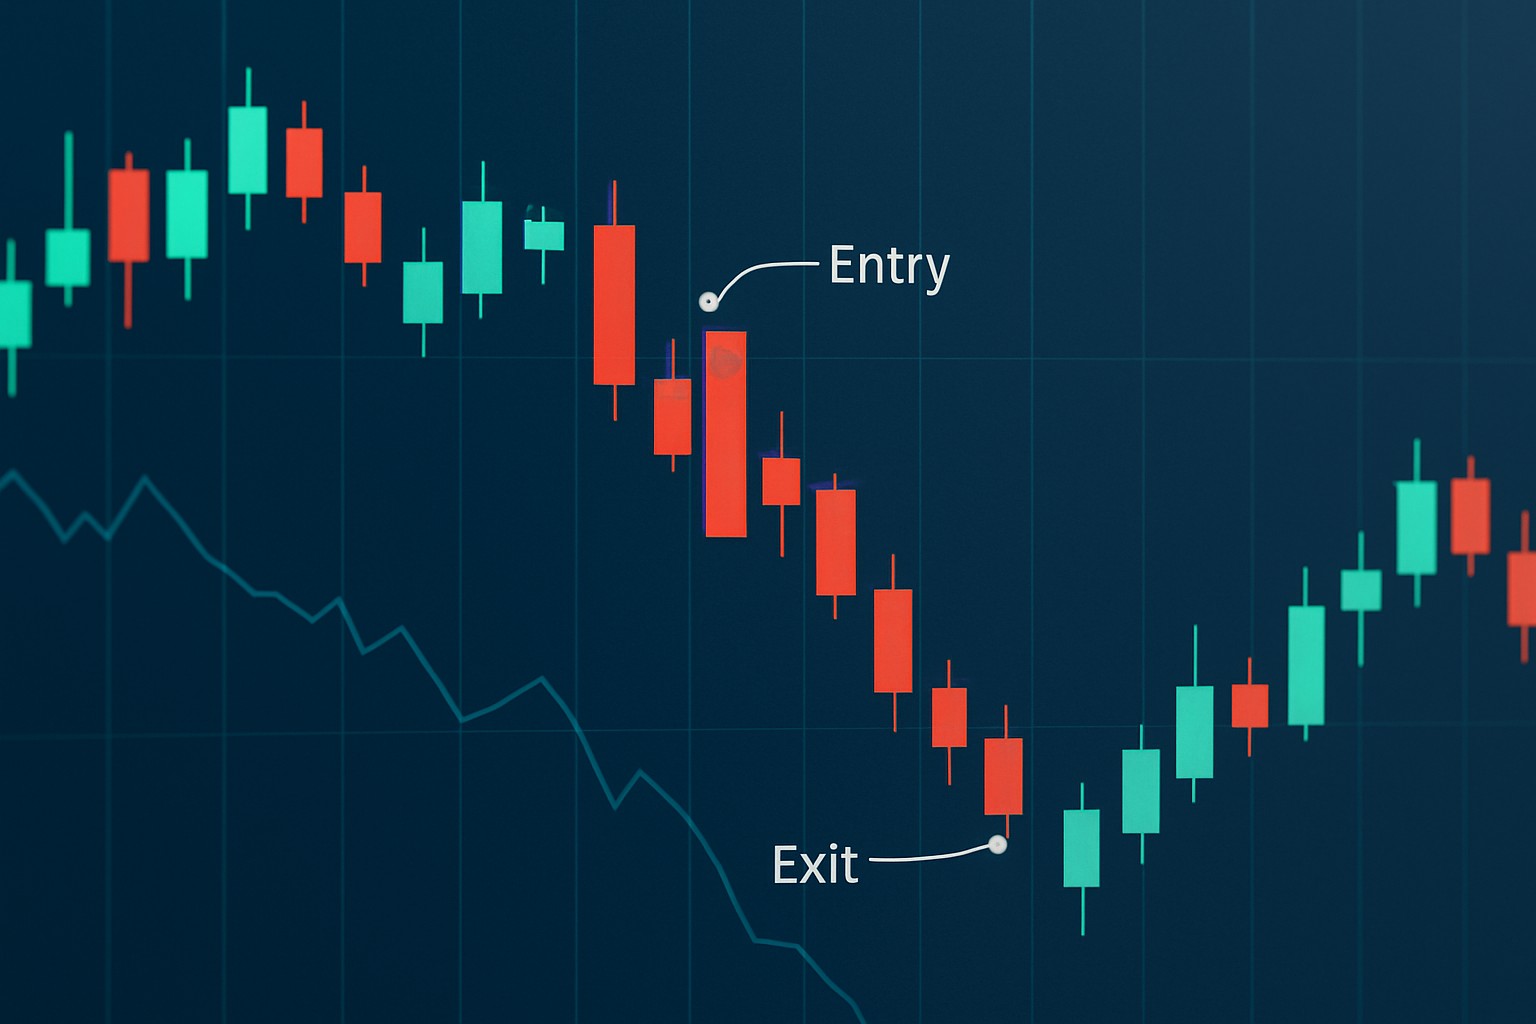
Spot Ascending Wedge Before it Breaks Down
Master the art of spotting ascending wedge patterns before they break down. This guide breaks down step-by-step techniques, indicators, and trade strategies to help you act confidently and protect your portfolio.

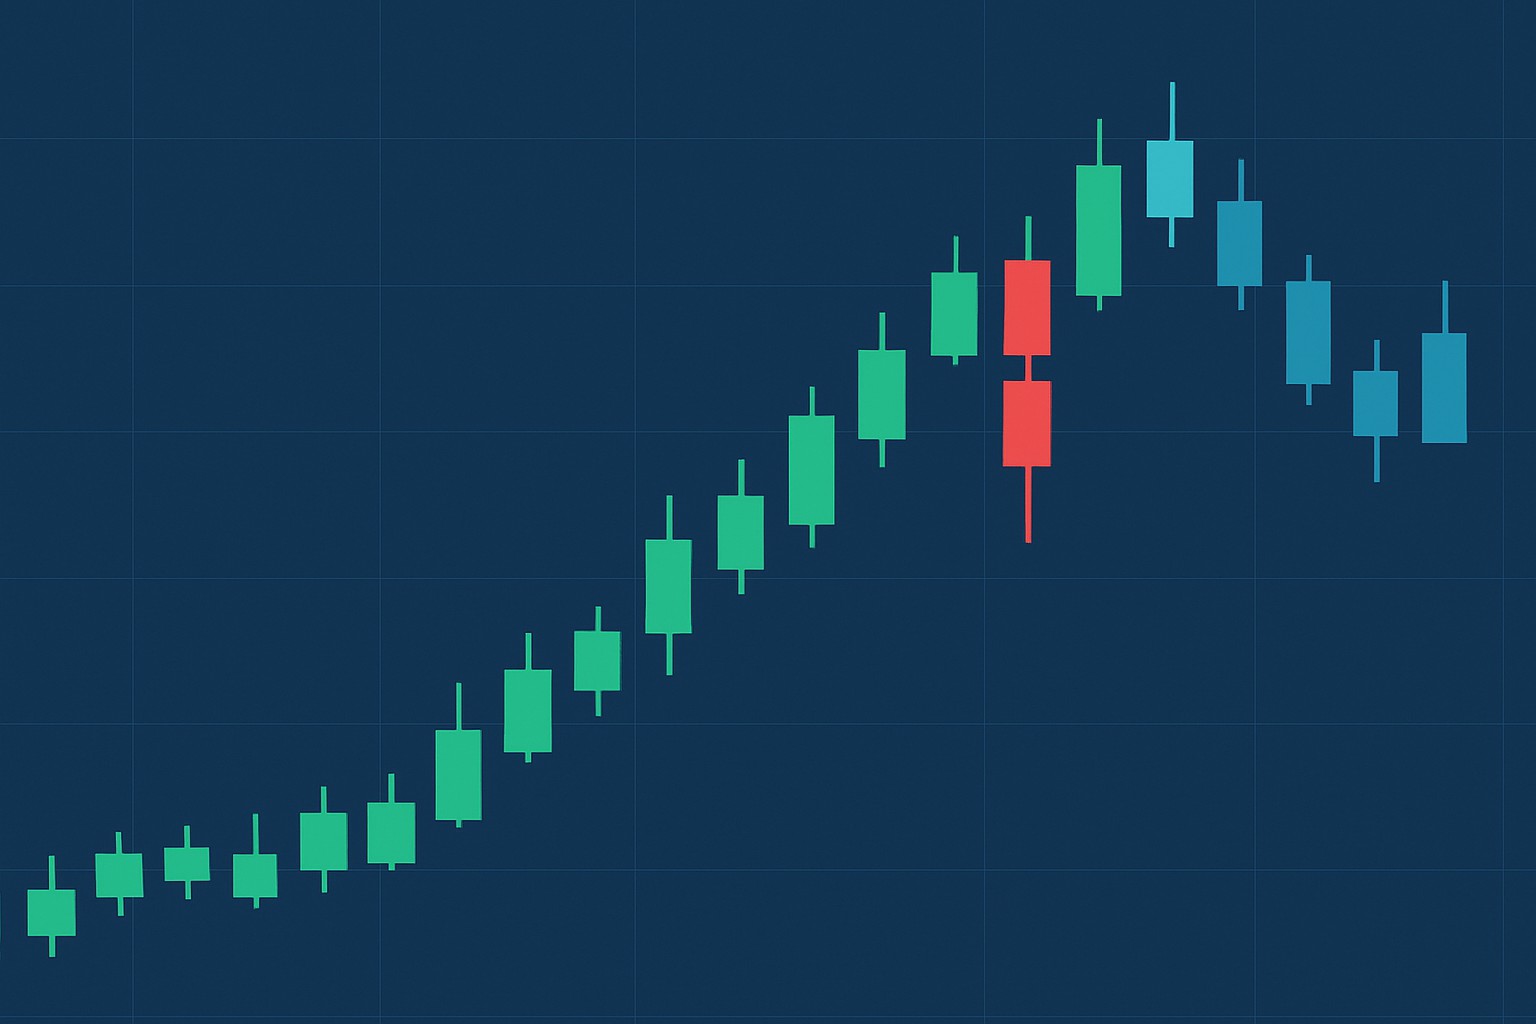
How to Read a Hanging Man Candlestick in Your Chart Analysis
Discover the hanging man candlestick pattern, a vital technical analysis tool that signals possible bearish reversals. This guide breaks down its meaning, identification, and practical uses for traders of all levels.

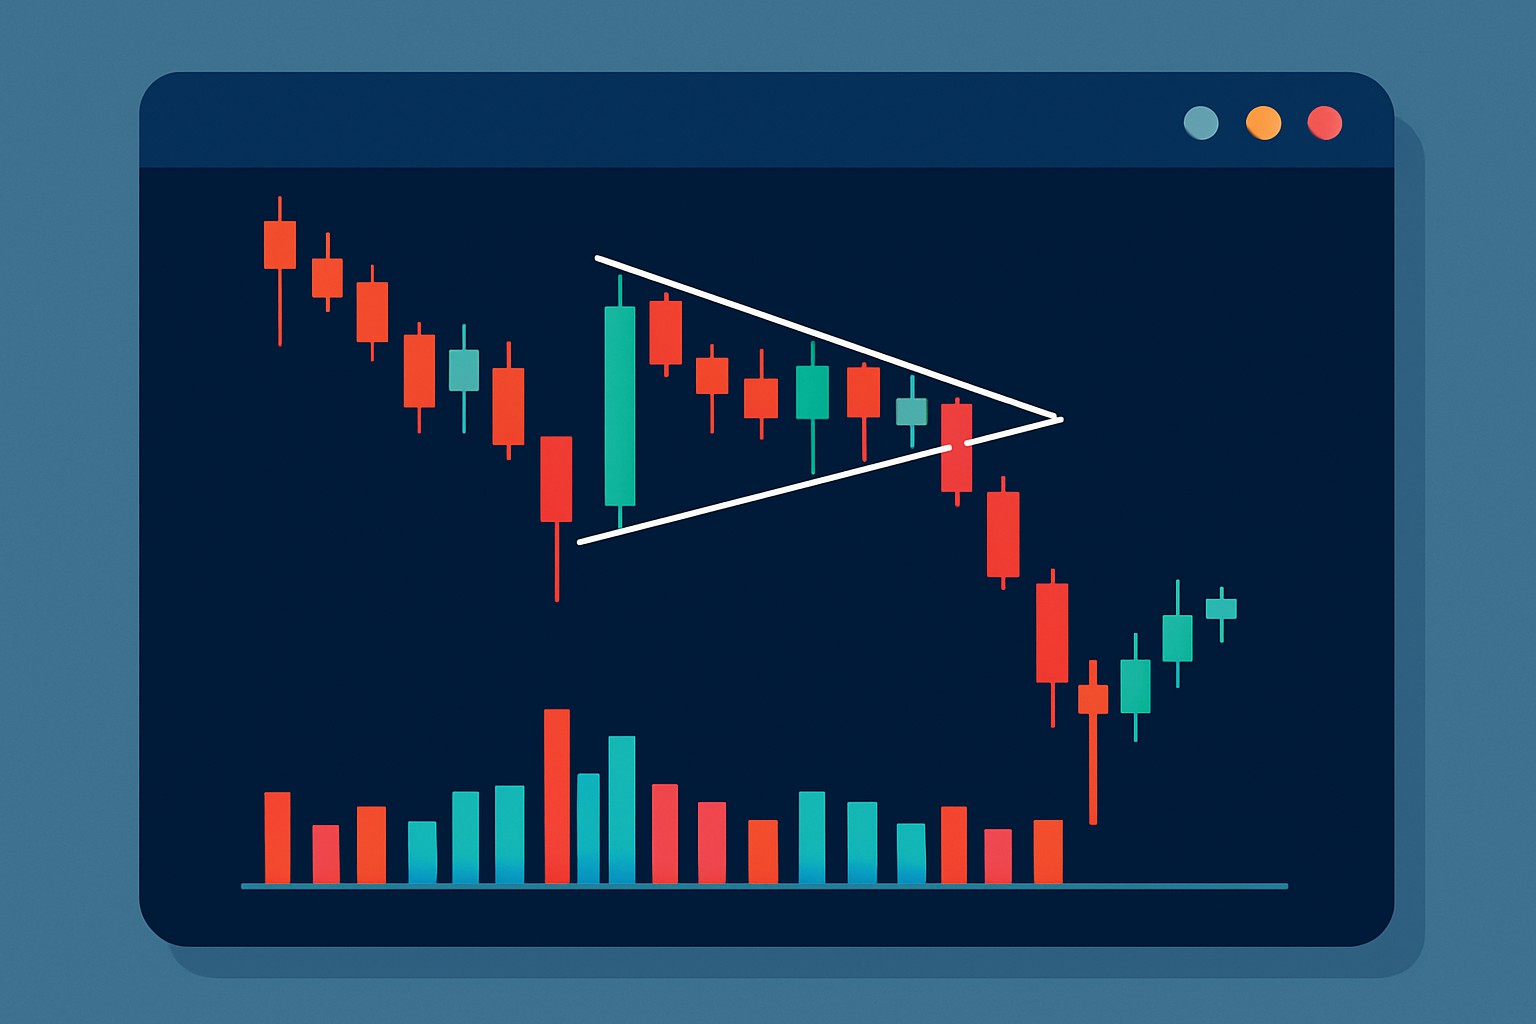
Bearish Pennant Patterns and What They Mean for Traders
Bearish pennant patterns signal brief pauses before downward price trends continue. Discover how to identify, trade, and avoid common pitfalls with this key technical analysis formation.

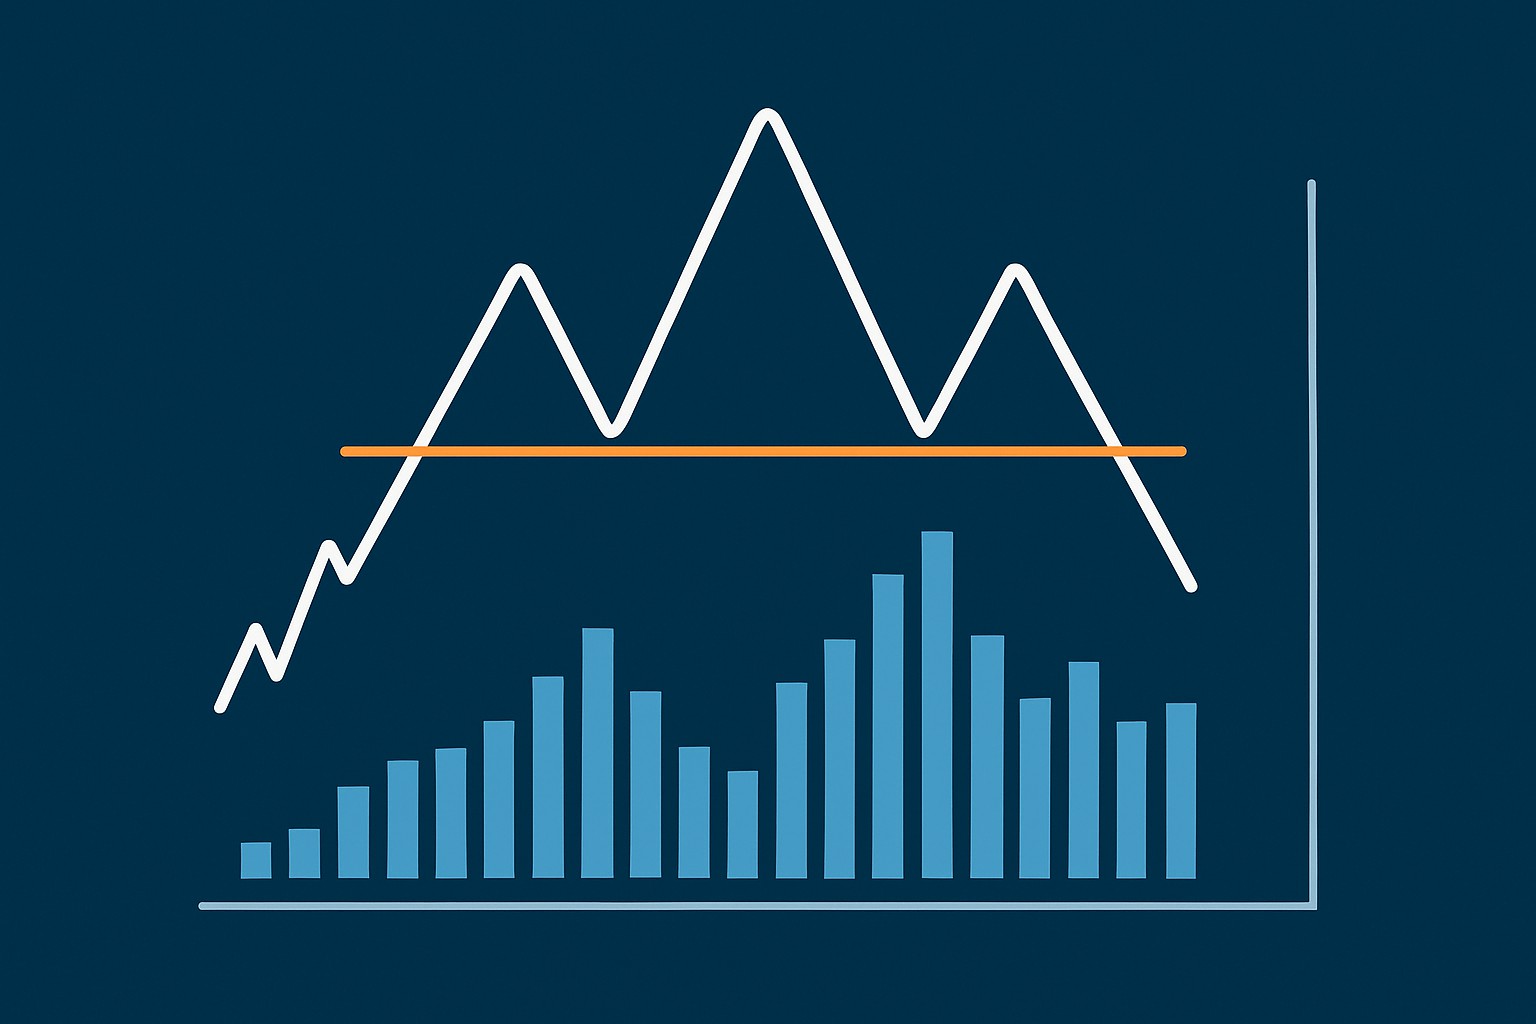
Spotting the Head and Shoulders Reversal Formation
Discover the head and shoulders pattern, a powerful chart formation that signals market reversals. This guide breaks down the pattern, identification steps, and trading strategies for all experience levels.


What is the monetary policy committee and how it shapes markets
Discover the essential role of the monetary policy committee in shaping economies. Learn how it sets interest rates, guides markets, and influences inflation and growth.
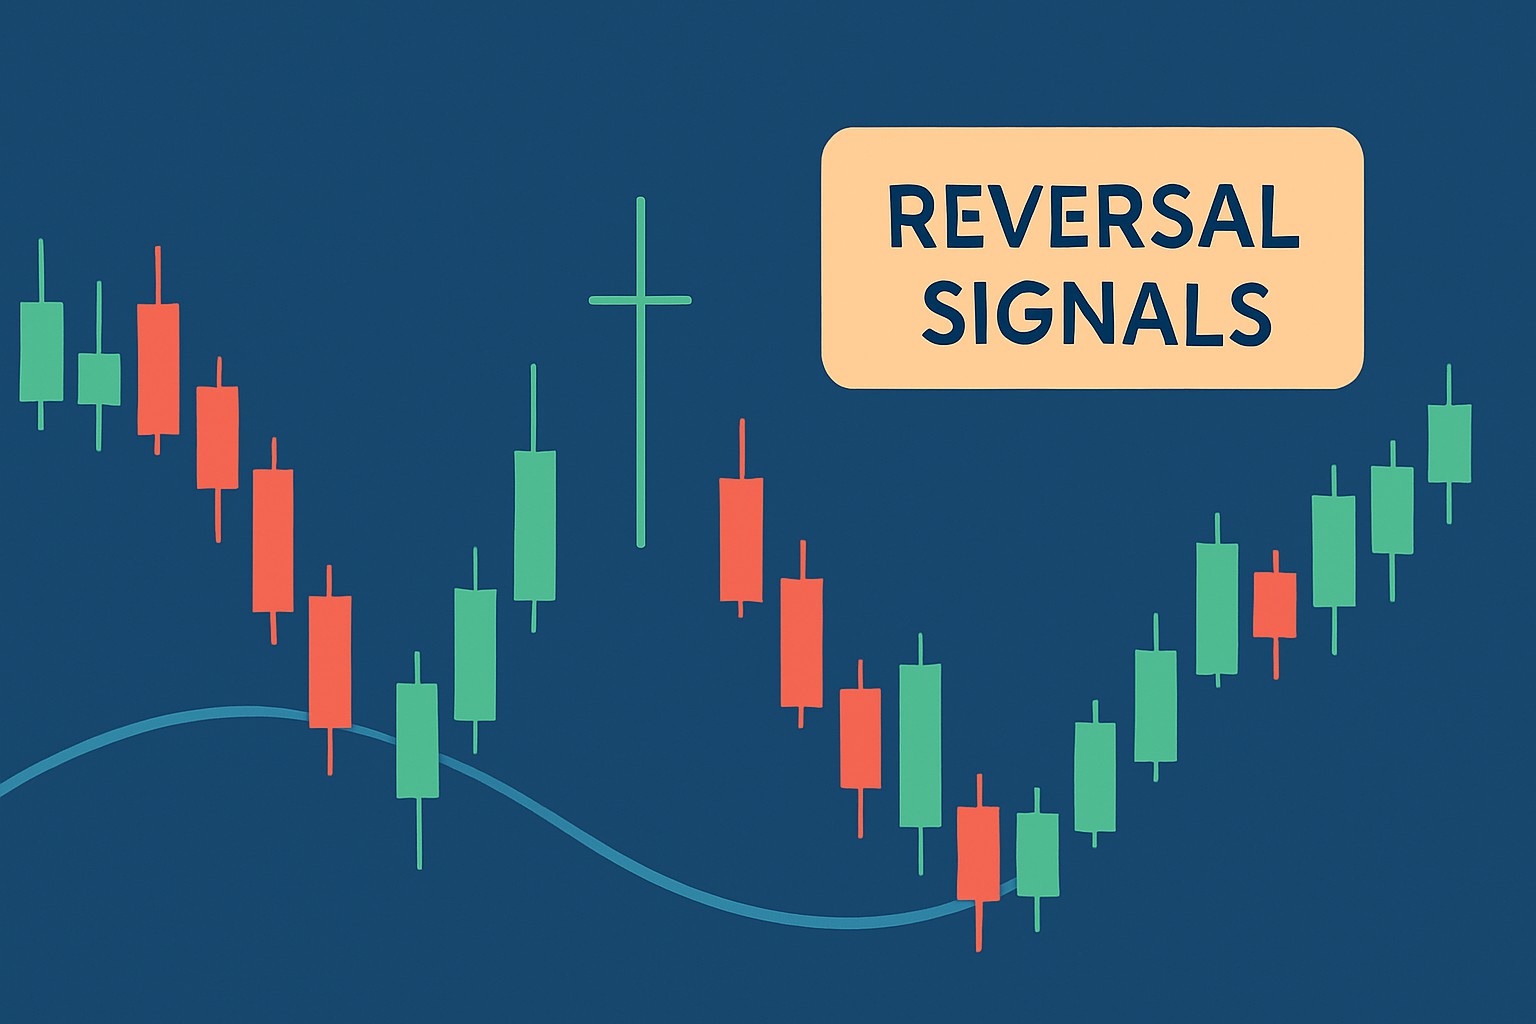
How to Spot and Trade the Dragonfly Doji Reversal Signal
Discover the dragonfly doji candlestick pattern, a key reversal signal in trading, and learn practical strategies to spot and trade it effectively.

How to Spot Bearish Engulfing Candles to Time Your Trades
Master spotting bearish engulfing candles to better time your trades and spot potential reversals. This guide breaks down actionable steps for traders at any experience level.
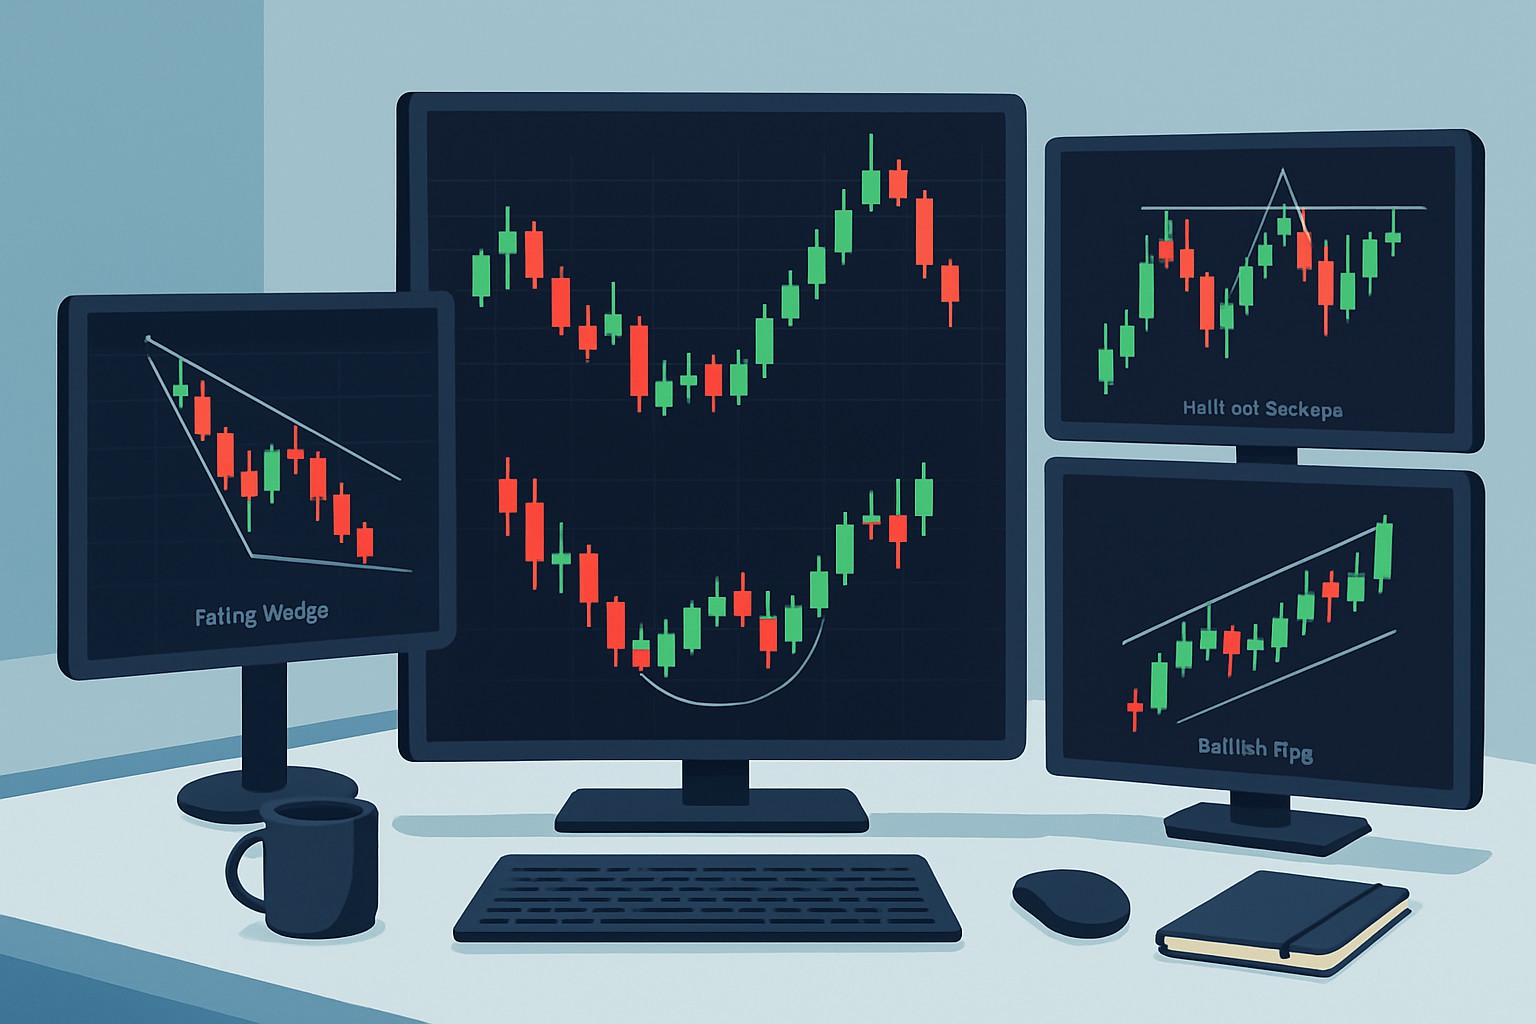
Trading Patterns Cheat Sheet That You Can Keep Handy
Simplify your trading strategy with a comprehensive trading patterns cheat sheet. Learn how to spot key formations and make smarter market moves confidently.

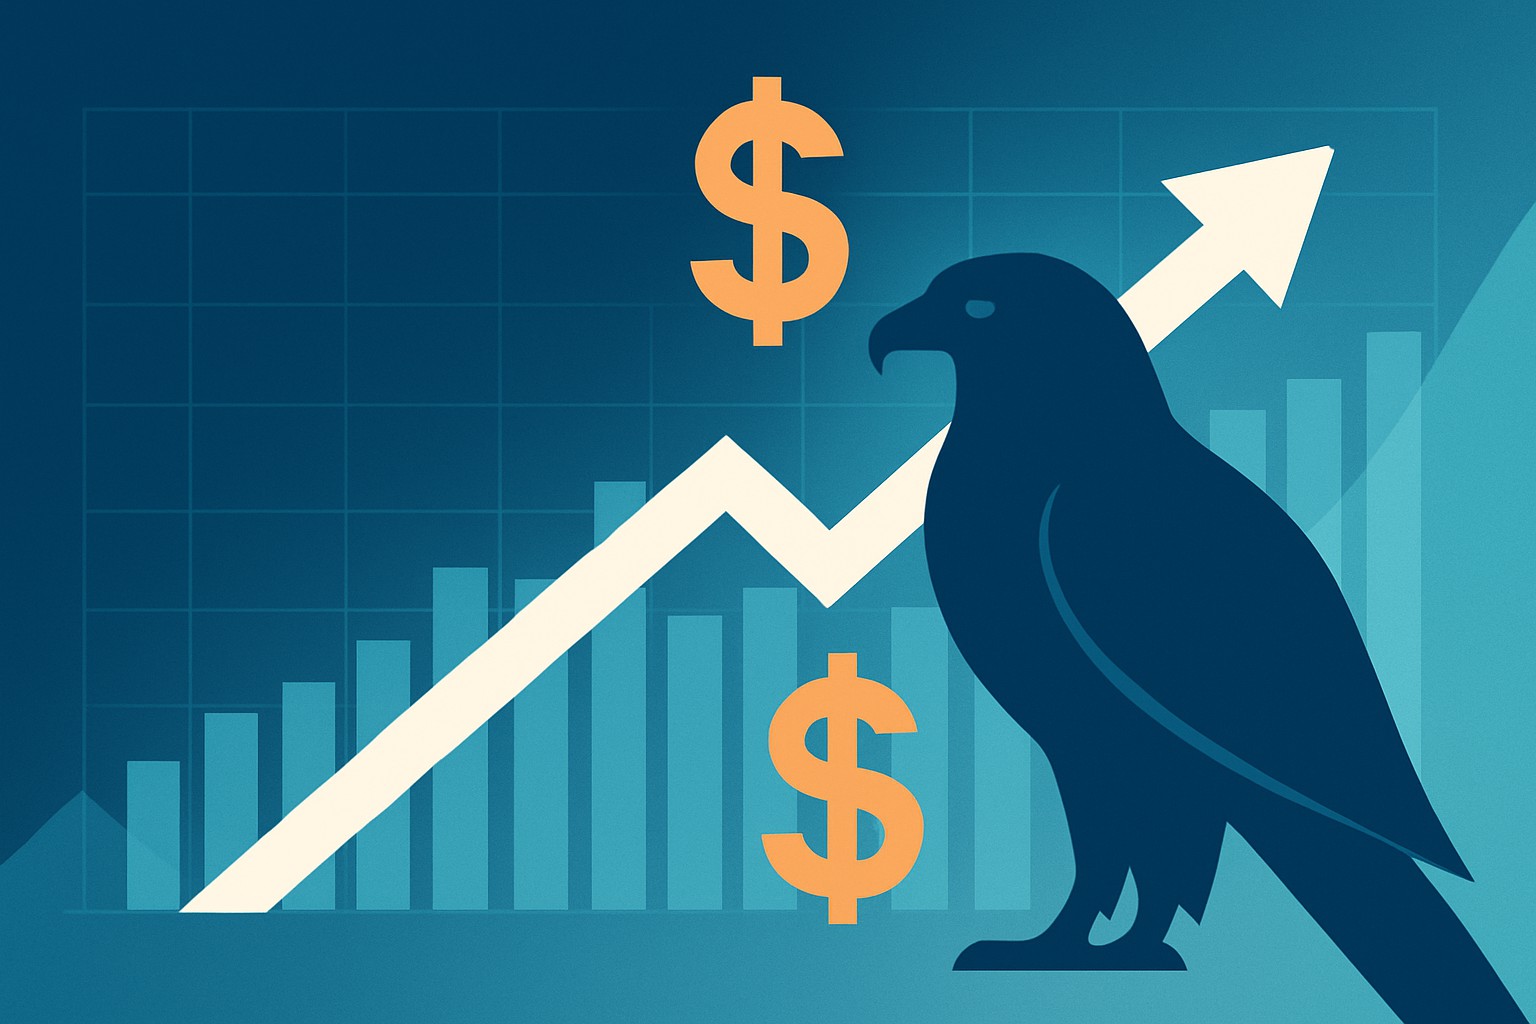
What is the Meaning of Hawkish for Investors?
Unpack the meaning of hawkish in investment contexts, understand its effects on markets, and learn strategies to navigate tightening monetary policy periods.
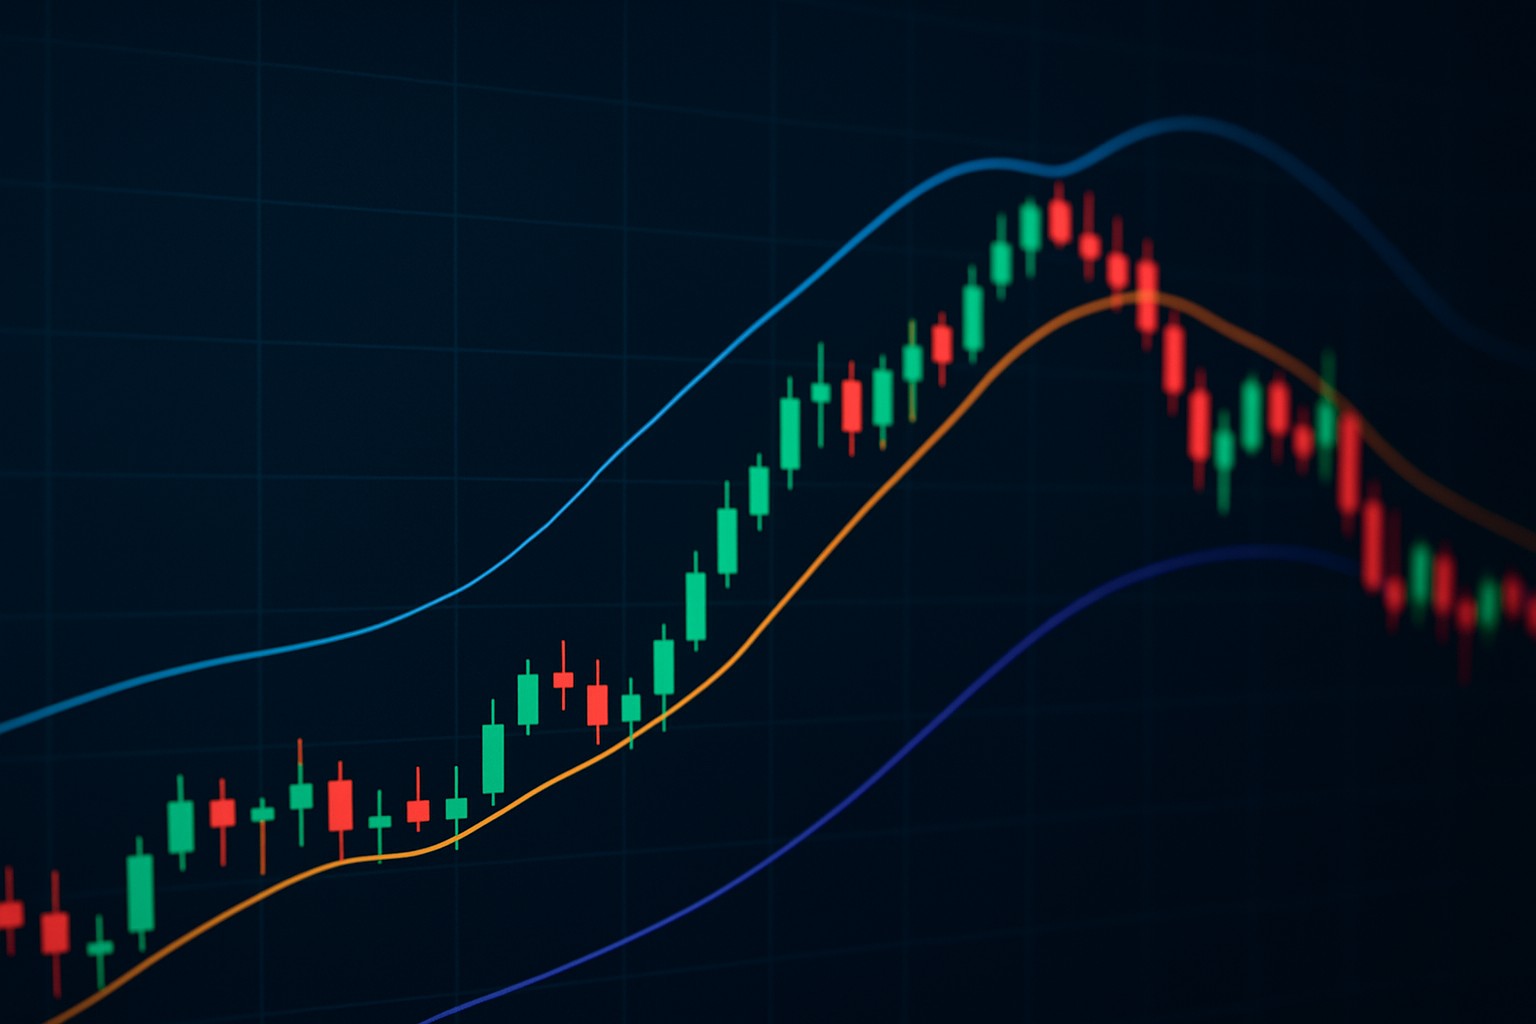
What the DEM Indicator Is and How to Use It
Discover how the DEM indicator offers a smoother, more responsive view of market trends. This guide explains its workings, uses, and how to integrate it confidently into your trading.
