Posts
169 pages
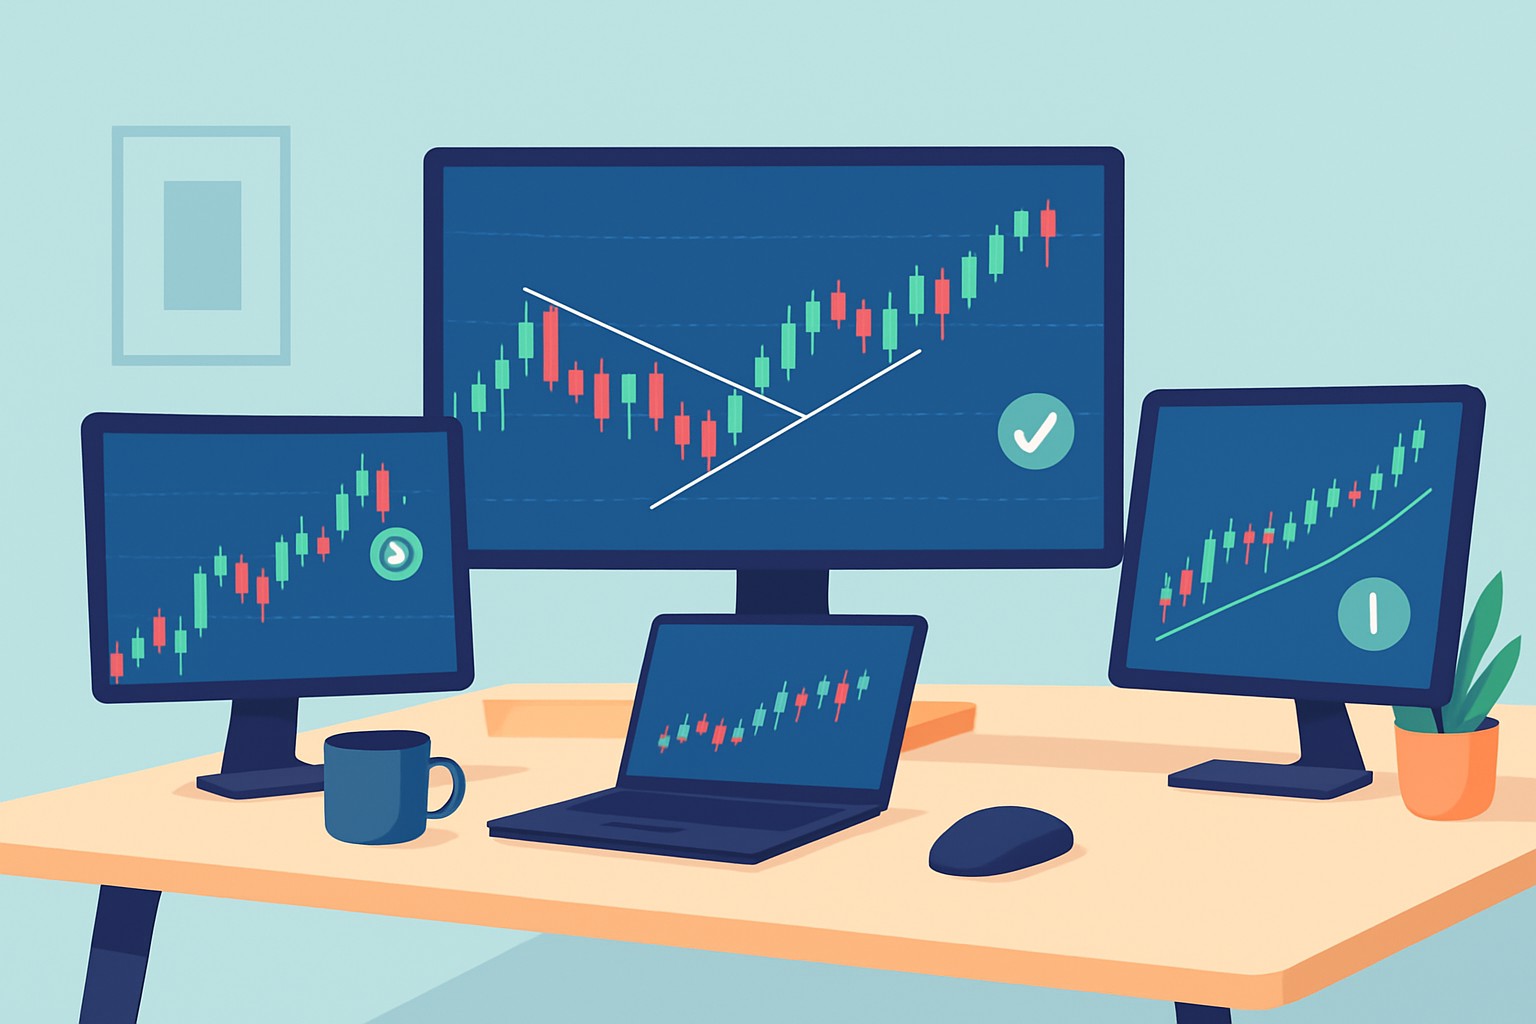
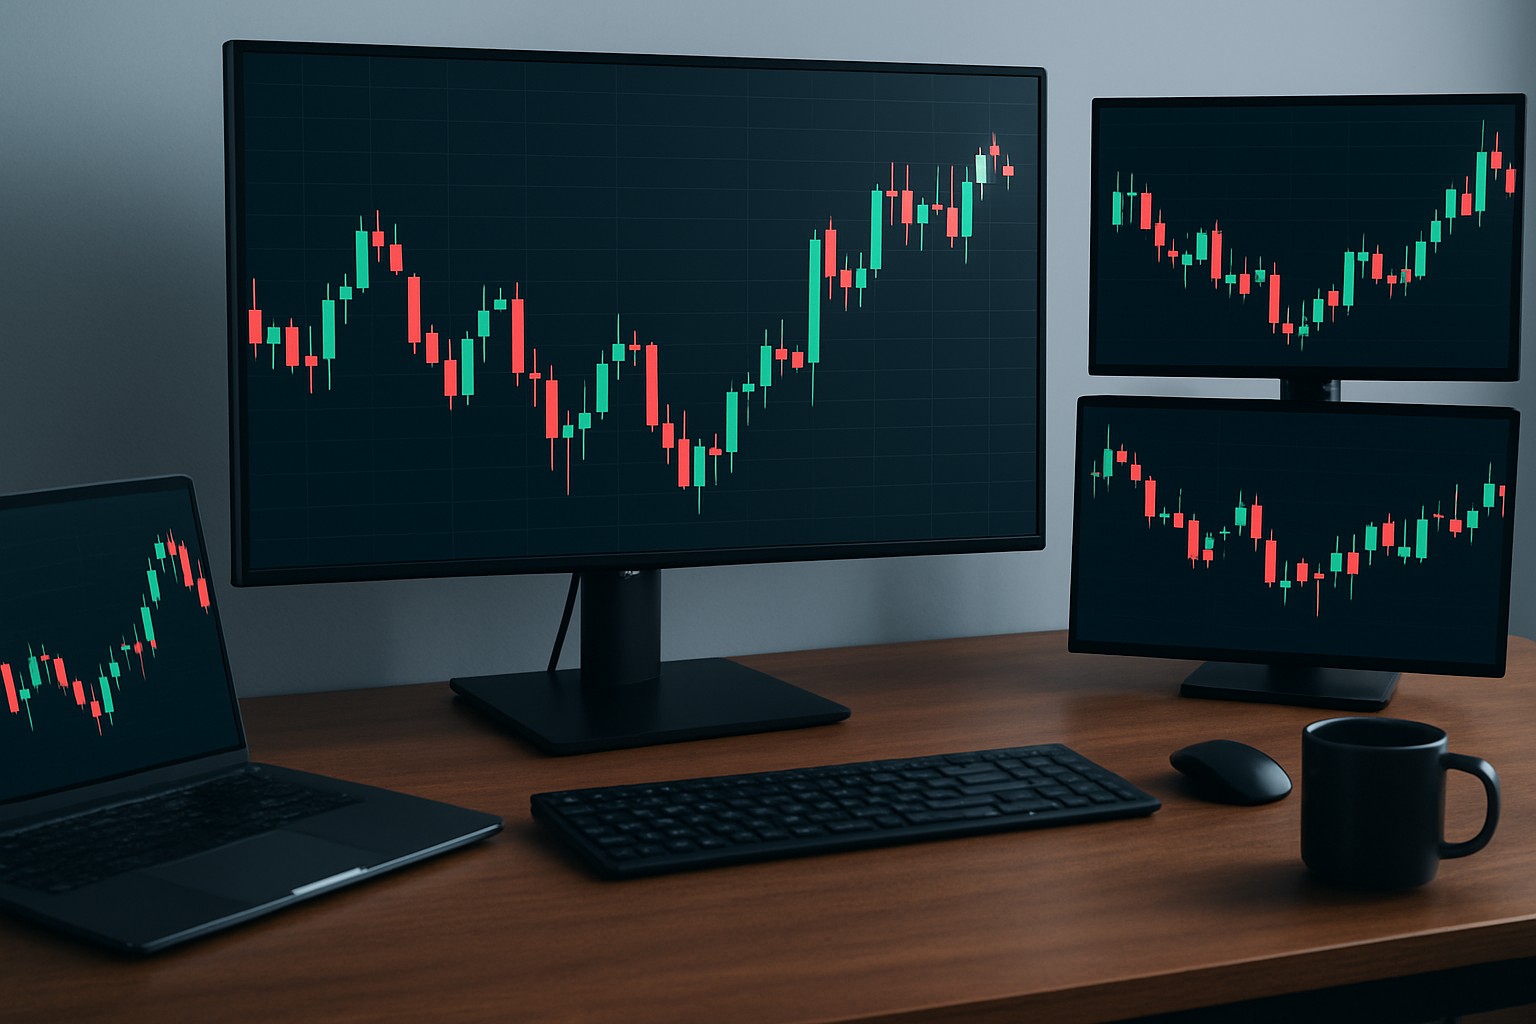
Trade Patterns to Watch When Using TrendSpider Tools
Master trade patterns with TrendSpider’s AI-powered tools. Learn expert tips to spot key formations, customize alerts, and validate setups across timeframes for smarter trading.

How to use supply and demand zones when trading options?
Discover practical strategies for using supply and demand zones in options trading. This guide breaks down key steps to identify zones, choose option plays, and manage risk effectively.

EMA Meaning and Why It Helps Spot Trend Direction
Understanding the EMA meaning empowers traders to identify market trends faster and with greater confidence. This article breaks down the Exponential Moving Average, explaining its calculation, usage, and common strategies.

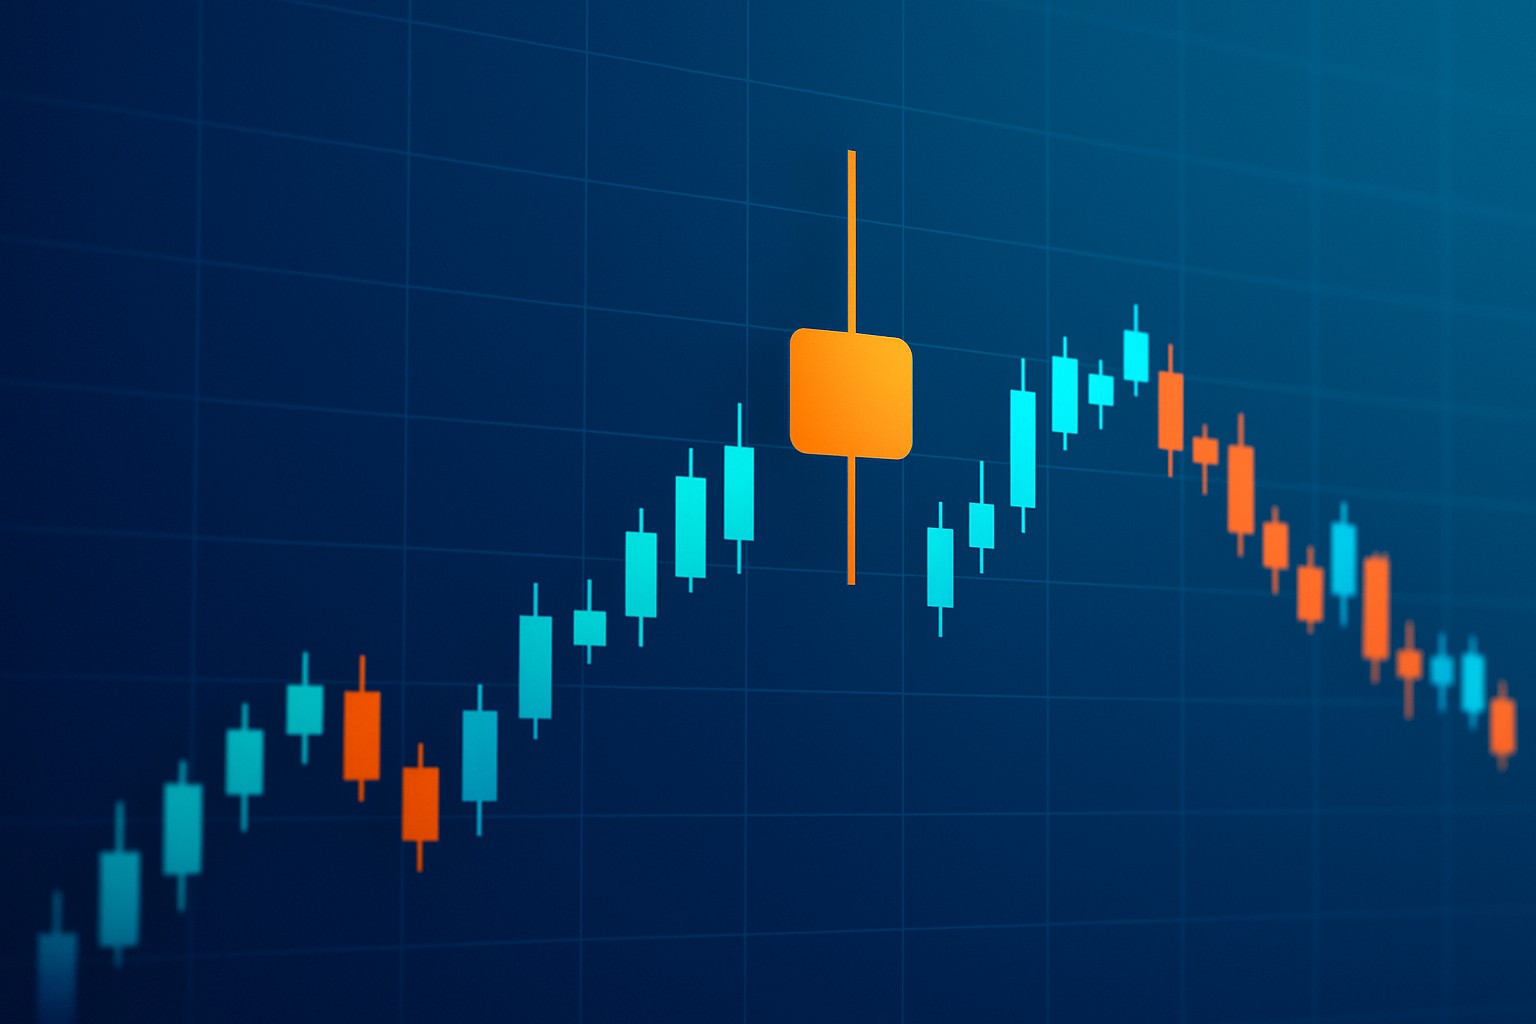
Spinning Top Candle Explained and What It Reveals About Price
The spinning top candle is a key pattern signaling market indecision. Learn how this candlestick reveals price action insights and aids traders in anticipating potential reversals or consolidation.

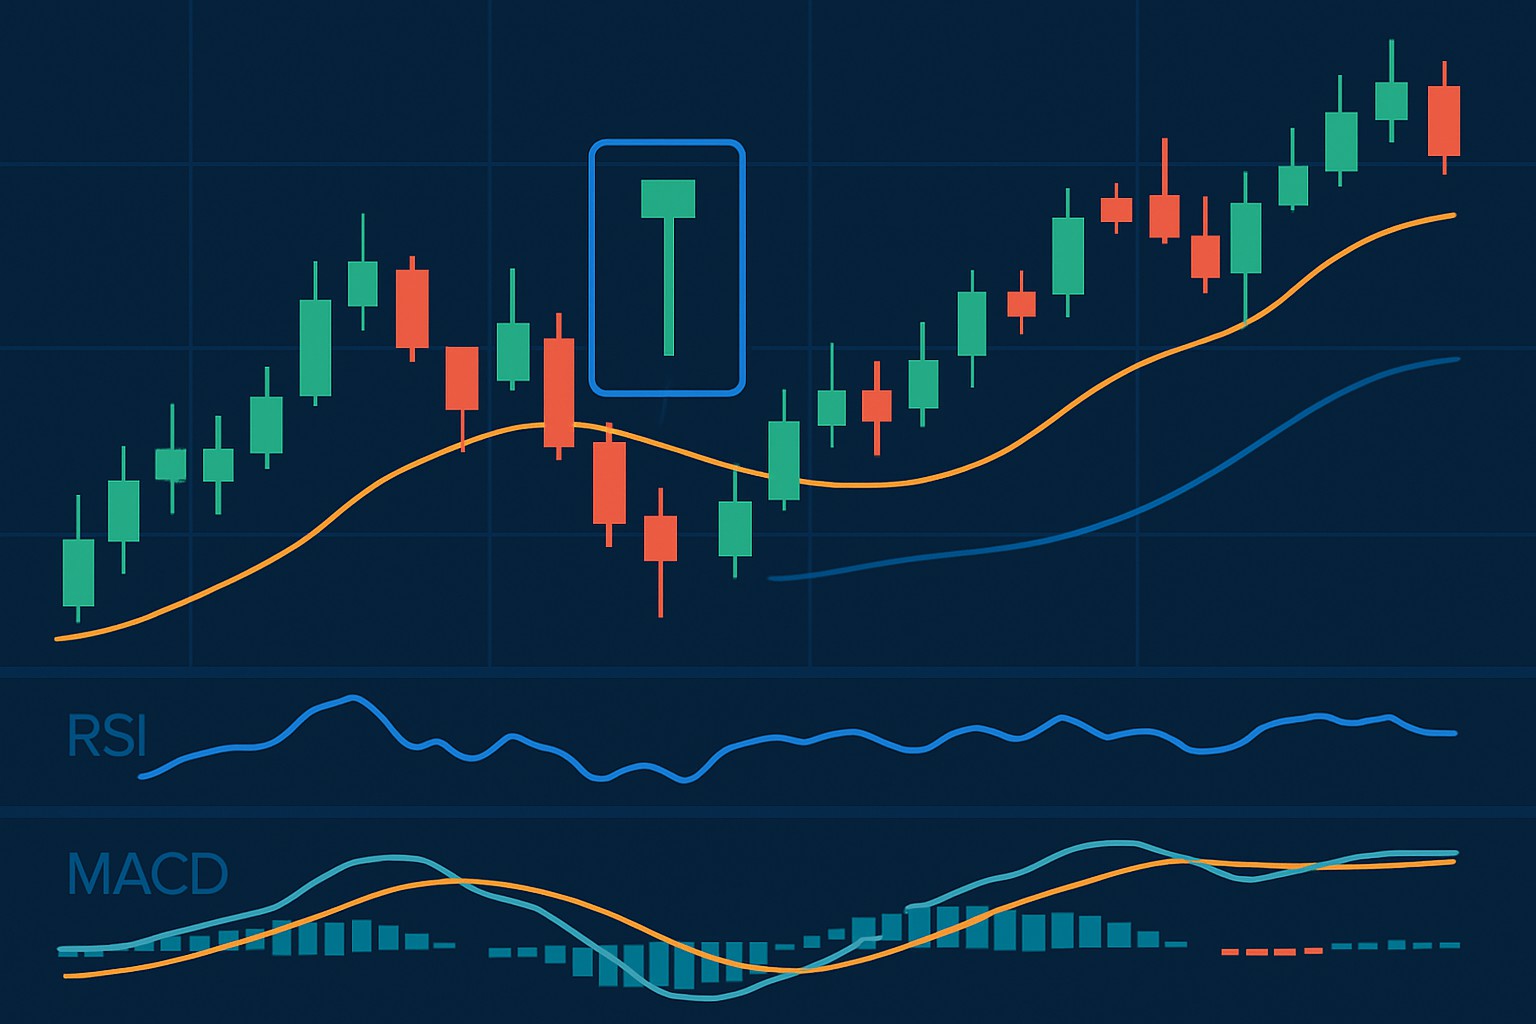
Identify Inverted Hammer Candlestick Patterns Like a Pro
Learn how to identify the inverted hammer candlestick pattern confidently. Understand its meaning, spot it like a pro, and use confirmation techniques for effective trading.
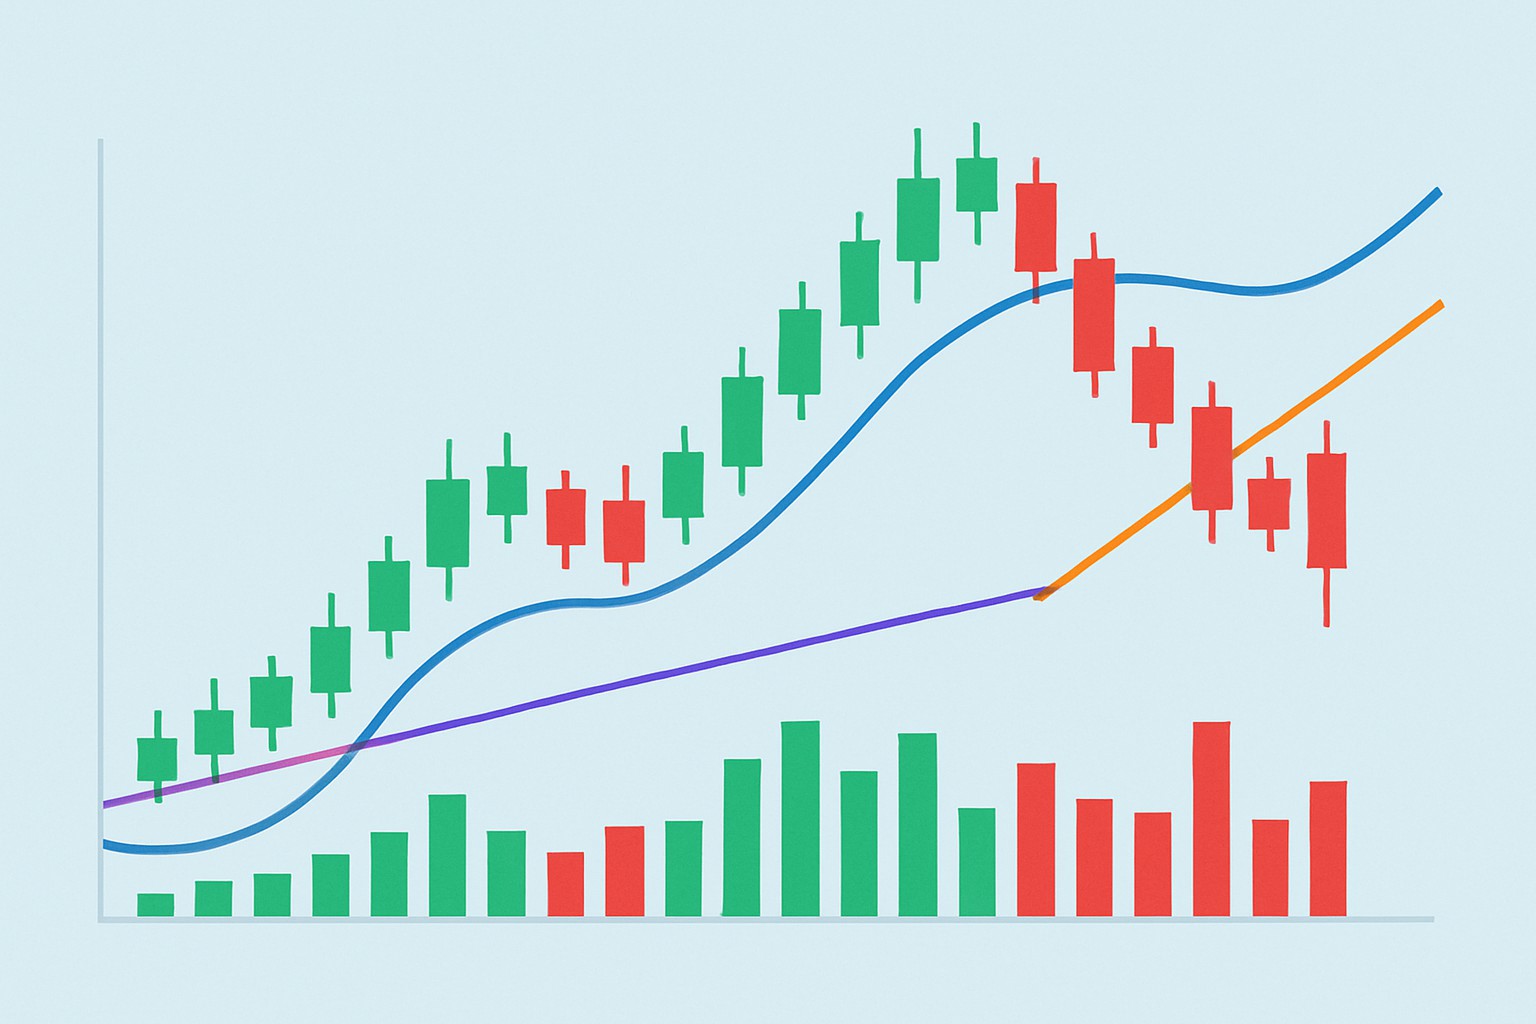
Candlestick Patterns Cheat Sheet
Boost your trading accuracy by mastering candlestick patterns with this expert cheat sheet featuring key signals, confirmation tips, and advanced hacks.
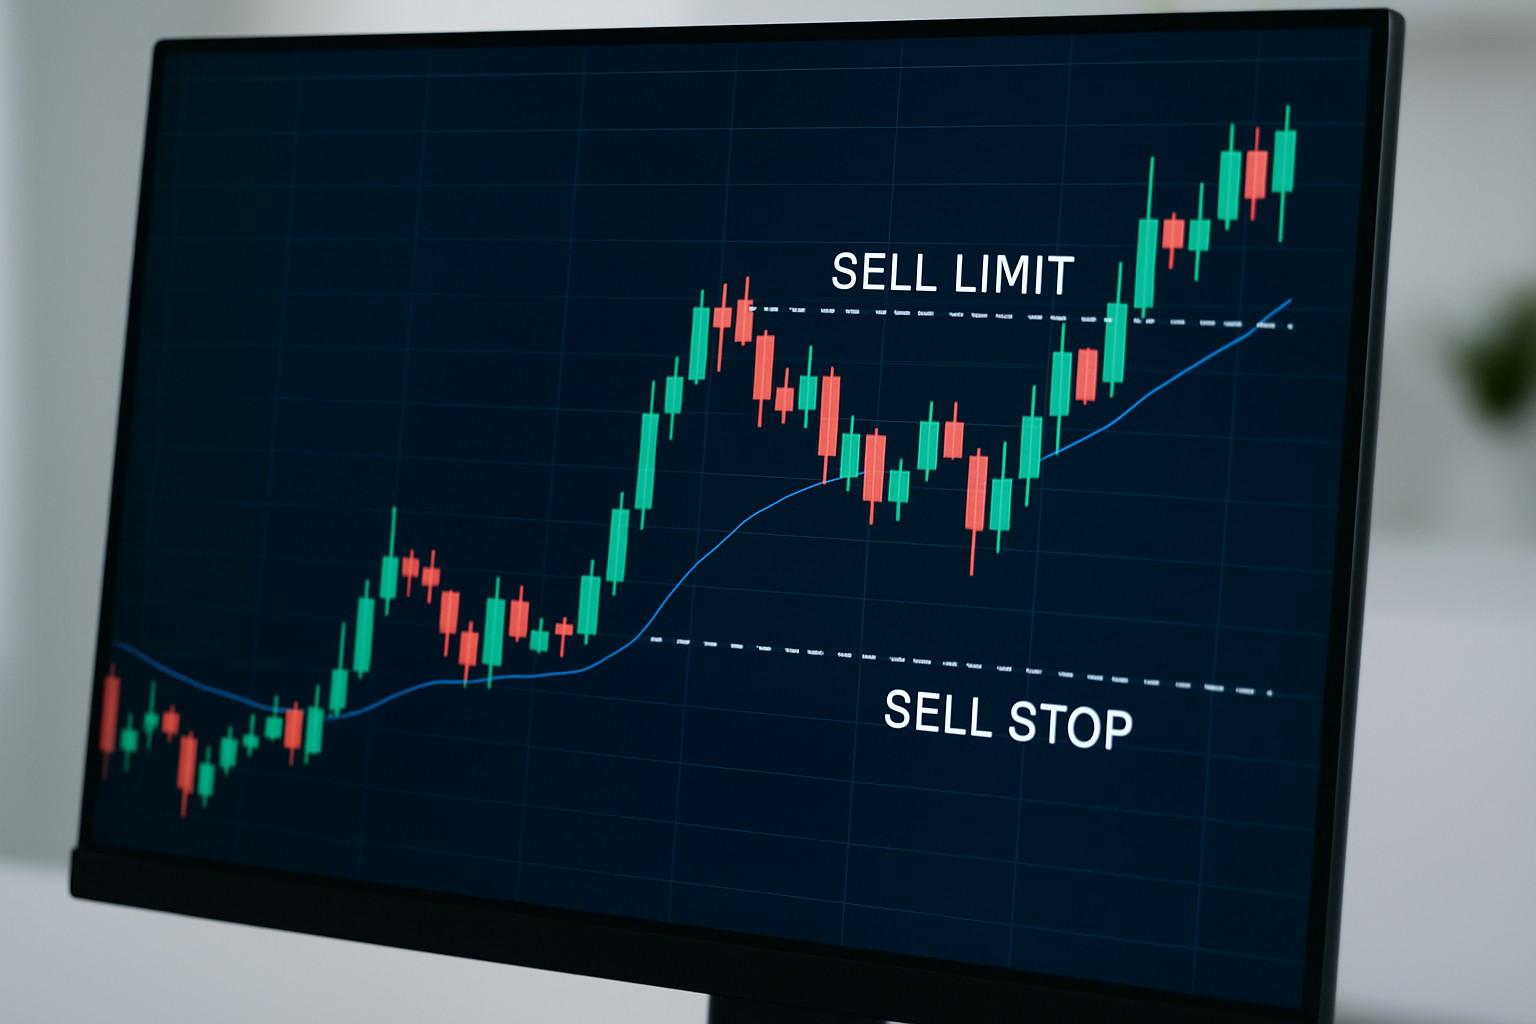
Sell limit vs sell stop orders - what is the difference?
Learn the crucial differences between sell limit and sell stop orders to enhance trade execution and risk control in volatile markets.

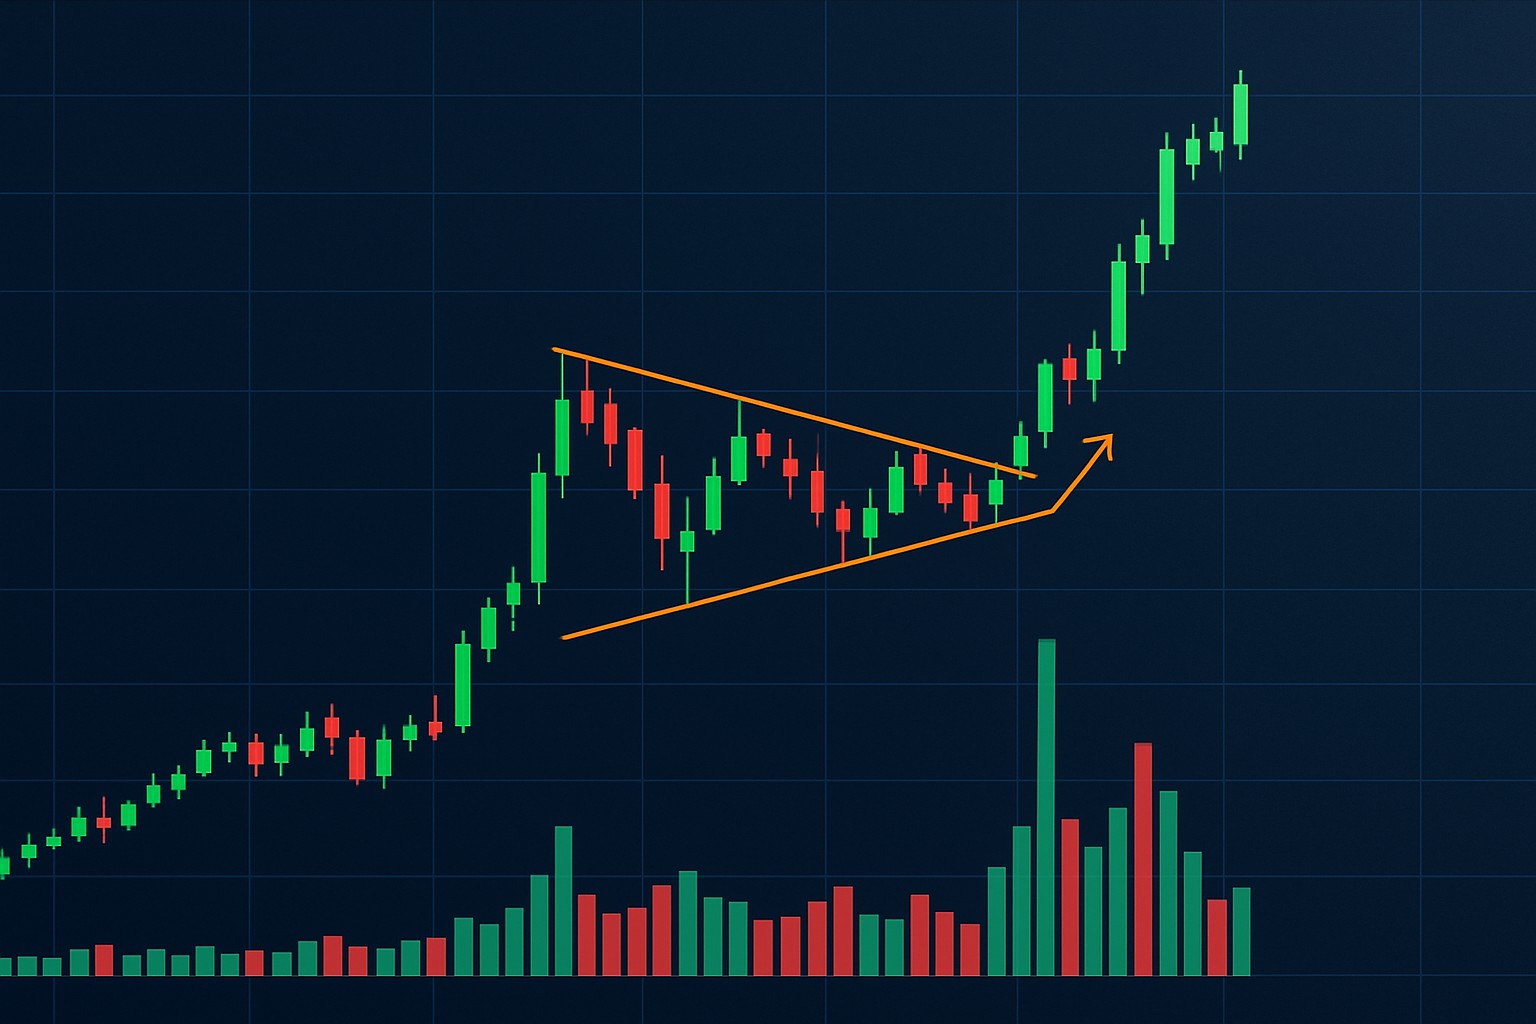
How to Spot a Bullish Pennant Formation on Charts
Discover how to spot bullish pennant formations on price charts, understand their significance, and use them to harness potential uptrends confidently—even if you're new to trading.
How to Trade Reversal Candle Patterns in Any Market
Master reversal candle patterns with our step-by-step guide to identifying trend changes and improving your trade timing across all markets.
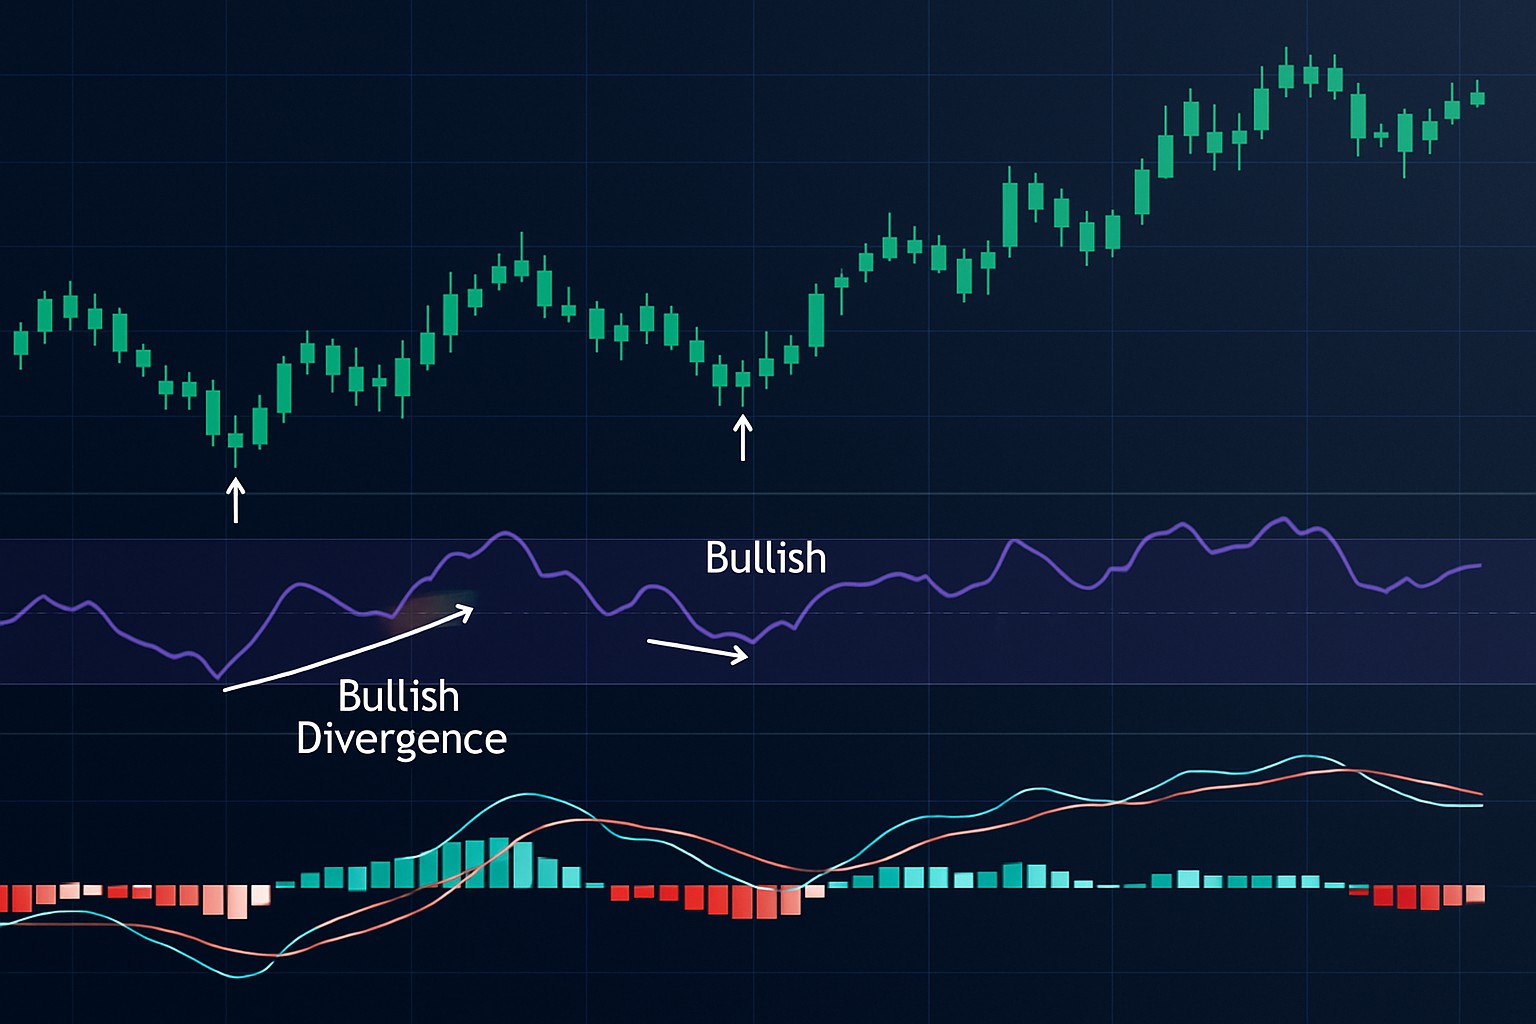
How to Trade Bullish Divergences on Any Timeframe
Unlock the power of bullish divergence with expert strategies to identify potential price reversals across any timeframe and improve your trading profits.

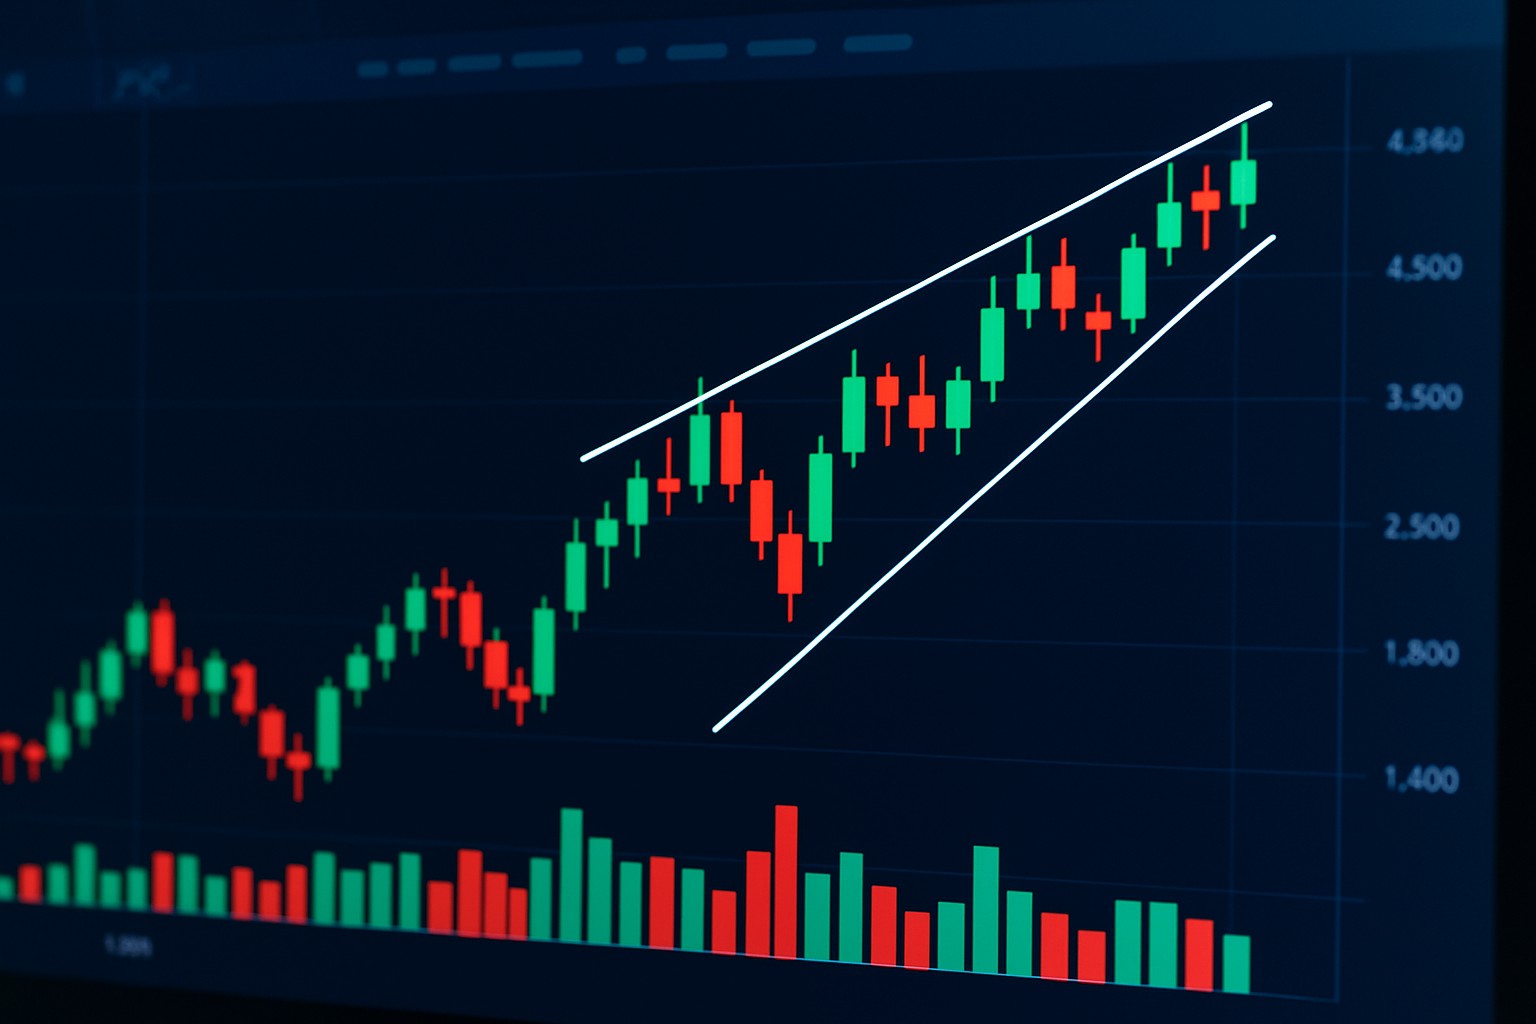
Recognize the Ascending Wedge Pattern in Charts
Learn to confidently spot the ascending wedge pattern, a key technical indicator signaling potential reversals, with this practical how-to guide for traders of all levels.

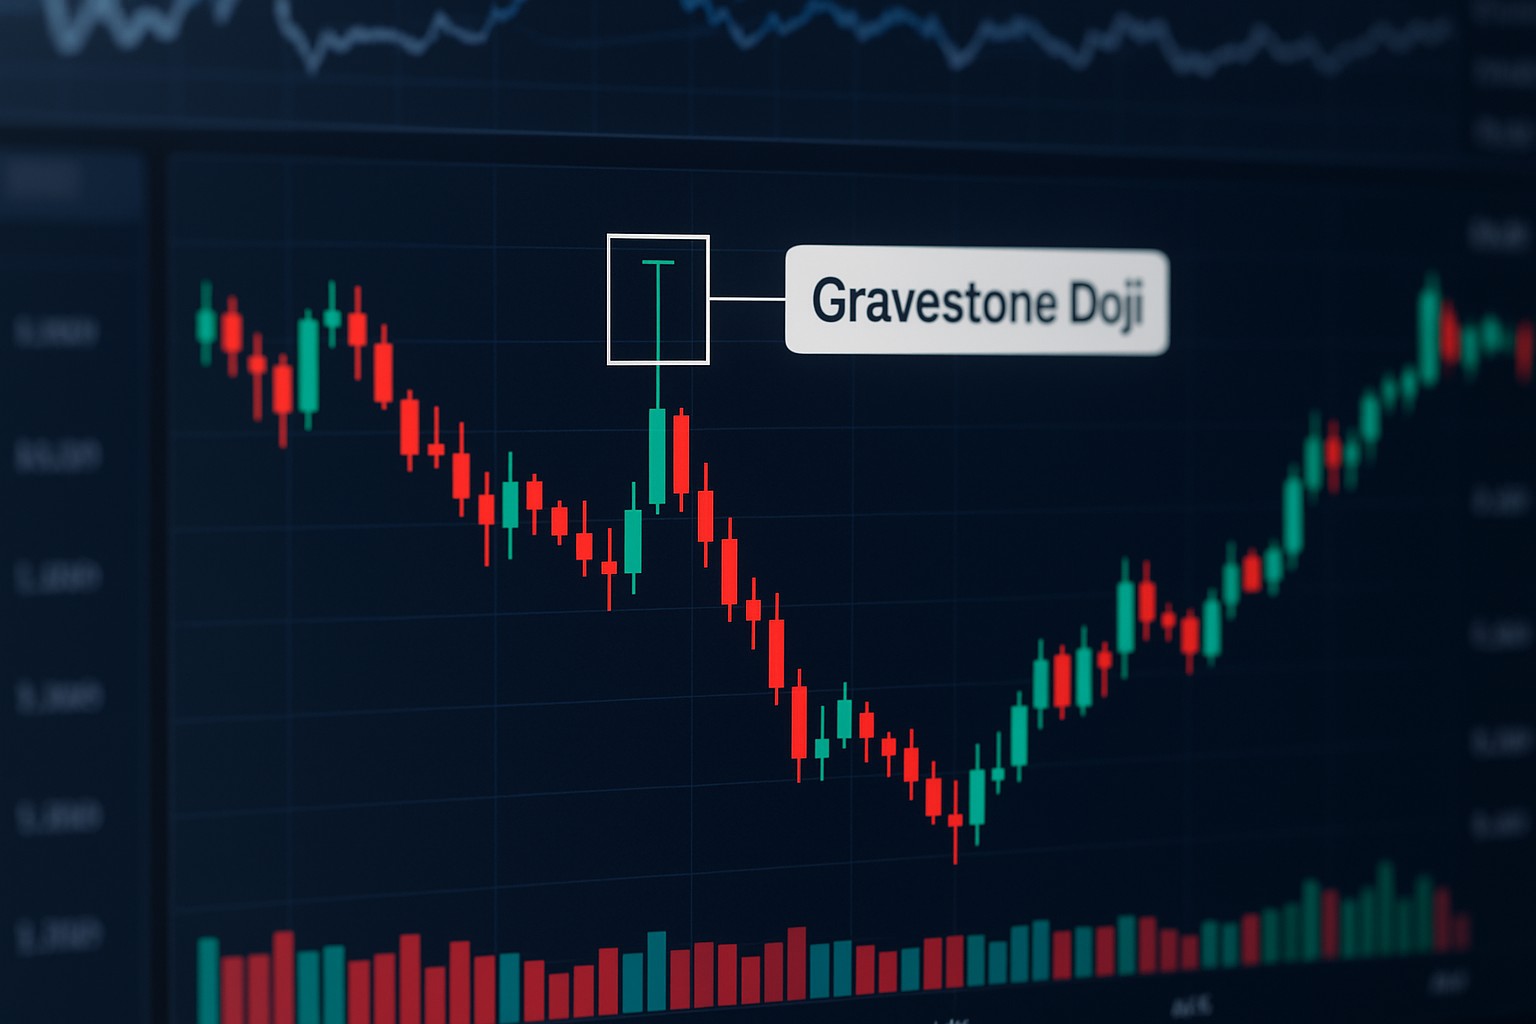
How to Identify Gravestone Doji Candles on Your Charts
Master the gravestone doji candle pattern to spot potential market reversals. This guide breaks down its identification and trading significance in simple terms.